Woodland Terrace neighborhood in Philadelphia, Pennsylvania (PA), 19104, 19143 detailed profile
Settings
X


Business Search - 14 Million verified businesses
Area: 0.093 square miles
Population: 1,815
Population density:
| Woodland Terrace: | 19,427 people per square mile |
| Philadelphia: | 11,602 people per square mile |

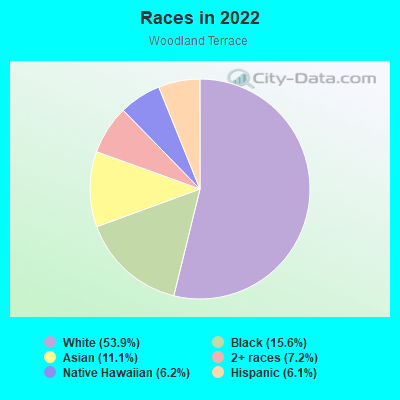
- 1,04053.9%White
- 30115.6%Black
- 21411.1%Asian
- 1387.2%Two or more races
- 1196.2%Native Hawaiian and Other
Pacific Islander - 1186.1%Hispanic or Latino
Median household income in 2022:
| Woodland Terrace: | $72,611 |
| Philadelphia: | $56,517 |
Distribution of median household income
![Distribution of median household income]()
- 156Less than $10,000
- 66$10,000 to $19,999
- 93$20,000 to $29,999
- 73$30,000 to $39,999
- 152$40,000 to $49,999
- 51$50,000 to $59,999
- 93$60,000 to $74,999
- 65$75,000 to $99,999
- 62$100,000 to $124,999
- 33$125,000 to $149,999
- 20$150,000 to $199,999
- 38$200,000 or more

Distribution of owner-occupied house/condo value
![Distribution of owner-occupied house/condo value]()
- 29Less than $50,000
- 14$100,000 to $149,999
- 12$150,000 to $199,999
- 13$200,000 to $249,999
- 12$250,000 to $299,999
- 18$300,000 to $399,999
- 21$400,000 to $499,999
- 26$500,000 to $749,999
- 27$750,000 to $999,999
- 20$1,000,000 or more

Distribution of rent paid by renters
![Distribution of rent paid by renters]()
- 9$100 to $199
- 1$200 to $299
- 30$300 to $399
- 36$400 to $499
- 69$600 to $699
- 69$700 to $799
- 63$800 to $899
- 208$900 to $999
- 323$1,000 to $1,249
- 43$1,250 to $1,499
- 100$1,500 to $1,999
- 124$2,000 or more

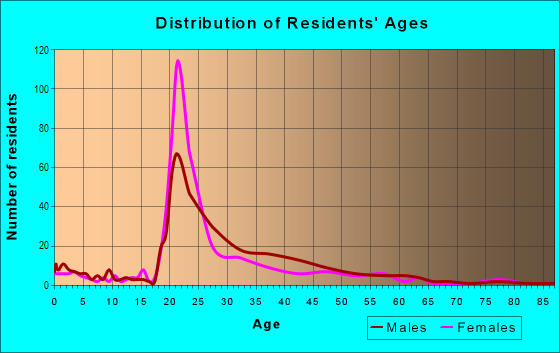
| Males: | 816 |
| Females: | 999 |
Males:
| This neighborhood: | 30.8 years |
| Whole city: | 34.1 years |
| This neighborhood: | 31.8 years |
| Whole city: | 36.3 years |
Average household size:
| Woodland Terrace: | 7.4 people |
| Philadelphia: | 2.2 people |
Percentage of family households:
| Woodland Terrace: | 20.6% |
| Philadelphia: | 36.5% |
| Here: | 12.8% |
| Philadelphia: | 28.0% |
Percentage of married-couple families with children (among all households):
| Woodland Terrace: | 27.6% |
| Philadelphia: | 23.5% |
Percentage of single-mother households (among all households):
| Woodland Terrace: | 14.9% |
| Philadelphia: | 17.6% |
Percentage of never married males 15 years old and over:
Percentage of never married females 15 years old and over:
| Woodland Terrace: | 31.0% |
| Philadelphia: | 23.9% |
Percentage of never married females 15 years old and over:
| Woodland Terrace: | 46.4% |
| city: | 26.0% |
Percentage of people that speak English not well or not at all:
| Woodland Terrace: | 1.6% |
| Philadelphia: | 7.0% |
Percentage of people born in this state:
Percentage of people born in another U.S. state:
Percentage of native residents but born outside the U.S.:
Percentage of foreign born residents:
| Here: | 32.2% |
| Philadelphia: | 61.6% |
Percentage of people born in another U.S. state:
| Woodland Terrace: | 49.4% |
| Philadelphia: | 18.9% |
Percentage of native residents but born outside the U.S.:
| Here: | 3.1% |
| city: | 3.7% |
Percentage of foreign born residents:
| Here: | 15.3% |
| Philadelphia: | 15.7% |
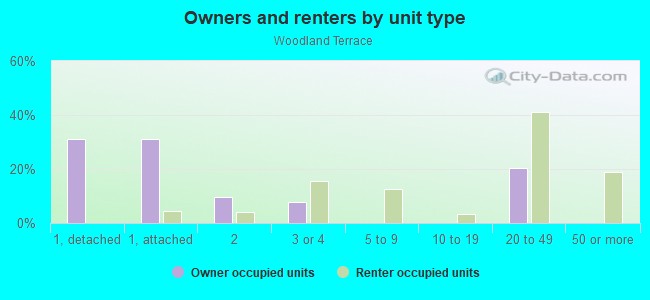
Owner-occupied
Renter-occupied

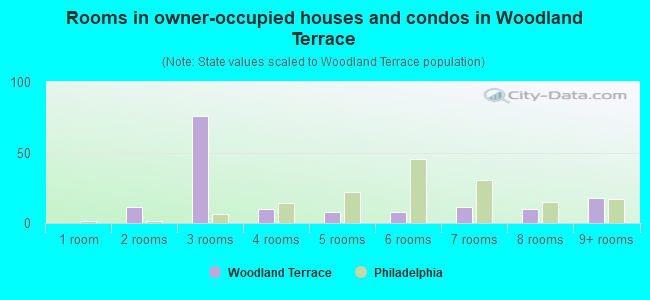
- Rooms in owner-occupied houses and condos in Woodland Terrace
- 01 room
- 112 rooms
- 763 rooms
- 104 rooms
- 85 rooms
- 86 rooms
- 117 rooms
- 108 rooms
- 189+ rooms
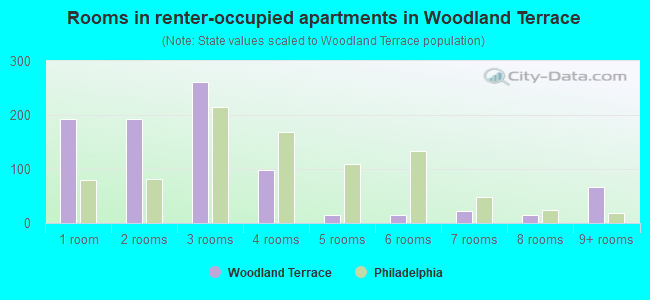
- Rooms in renter-occupied apartments in Woodland Terrace
- 1921 room
- 1922 rooms
- 2623 rooms
- 984 rooms
- 145 rooms
- 146 rooms
- 237 rooms
- 158 rooms
- 679+ rooms
Owner-occupied
Renter-occupied

- Bedrooms in owner-occupied houses and condos in Woodland Terrace
- 0no bedroom
- 371 bedroom
- 112 bedrooms
- 183 bedrooms
- 224 bedrooms
- 135+ bedrooms
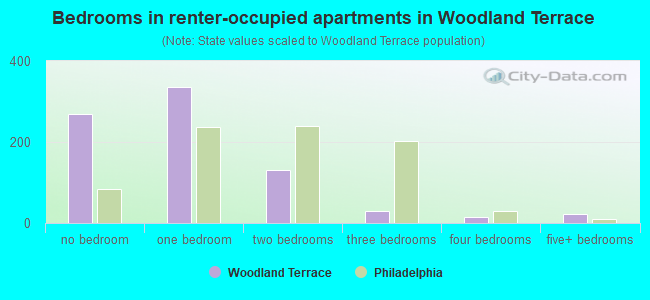
- Bedrooms in renter-occupied apartments in Woodland Terrace
- 270no bedroom
- 3371 bedroom
- 1312 bedrooms
- 303 bedrooms
- 144 bedrooms
- 215+ bedrooms
Average number of cars or other vehicles available in houses/condos:
Average number of cars or other vehicles available in apartments:
| This neighborhood: | 1.2 |
| Philadelphia: | 1.3 |
Average number of cars or other vehicles available in apartments:
| Here: | 0.5 |
| city: | 0.8 |
Percentage of units with a mortgage:
| Woodland Terrace: | 68.8% |
| Philadelphia: | 58.9% |
Average estimated value of townhouses or other attached units in 2022 (12.0% of all units):
| This neighborhood: | $451,202 |
| city: | $243,508 |
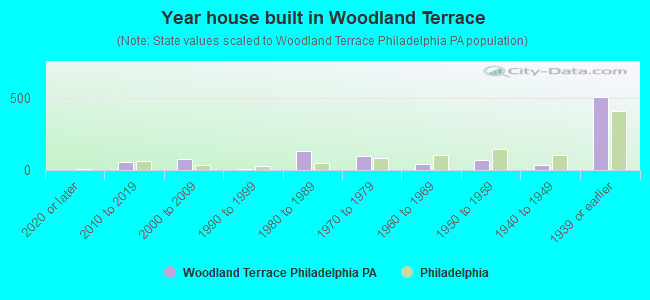
- Year house built in Woodland Terrace
- 02020 or later
- 532010 to 2019
- 792000 to 2009
- 61990 to 1999
- 1291980 to 1989
- 991970 to 1979
- 441960 to 1969
- 671950 to 1959
- 321940 to 1949
- 5041939 or earlier
City-data.com crime index for city in 2020 (higher means more crime):
| City: | 169.8 |
| U.S. average: | 219.5 |
Travel time to work (commute)
![Travel time to work (commute)]()
- 41Less than 5 minutes
- 895 to 9 minutes
- 8010 to 14 minutes
- 14215 to 19 minutes
- 8020 to 24 minutes
- 5925 to 29 minutes
- 11530 to 34 minutes
- 1535 to 39 minutes
- 2440 to 44 minutes
- 5045 to 59 minutes
- 8060 to 89 minutes
- 4590 or more minutes

Means of transportation to work
![Means of transportation to work]()
- 13.8%137Drove a car alone
- 12.2%121Carpooled
- 4.6%46Bus
- 3.9%39Subway or elevated rail
- 11.7%116Long-distance train or commuter rail
- 14.0%139Light rail, streetcar or trolley
- 18.8%187Taxi
- 9.1%90Motorcycle
- 8.3%82Bicycle
- 27.5%273Walked
- 3.9%39Other means
- 15.2%151Worked at home

Time leaving home to go to work
![Time leaving home to go to work]()
- 112:00 a.m. to 4:59 a.m.
- 55:00 a.m. to 5:29 a.m.
- 355:30 a.m. to 5:59 a.m.
- 106:00 a.m. to 6:29 a.m.
- 236:30 a.m. to 6:59 a.m.
- 527:00 a.m. to 7:29 a.m.
- 887:30 a.m. to 7:59 a.m.
- 1238:00 a.m. to 8:29 a.m.
- 708:30 a.m. to 8:59 a.m.
- 1519:00 a.m. to 9:59 a.m.
- 2010:00 a.m. to 10:59 a.m.
- 2011:00 a.m. to 11:59 a.m.
- 13412:00 p.m. to 3:59 p.m.
- 414:00 p.m. to 11:59 p.m.

Occupations of males:
- Percentage of males in management occupations (except farmers):
Here: 5.7% city: 9.1%
- Percentage of males in business and financial operations occupations:
Here: 5.0% city: 6.0%
- Percentage of males in computer and mathematical occupations:
Here: 8.8% city: 4.6%
- Percentage of males in architecture and engineering occupations:
Here: 2.9% city: 2.4%
- Percentage of males in life, physical, and social science occupations:
Here: 9.5% city: 1.7%
- Percentage of males in community and social services occupations:
Here: 3.1% city: 1.9%
- Percentage of males in education, training, and library occupations:
Here: 8.7% city: 4.0%
- Percentage of males in arts, design, entertainment, sports, and media occupations:
Here: 1.9% city: 2.5%
- Percentage of males in healthcare practitioners and technical occupations:
Here: 6.0% city: 4.3%
- Percentage of males in service occupations:
Here: 10.6% city: 19.3%
- Percentage of males in sales and office occupations:
Here: 17.9% city: 14.1%
- Percentage of males in construction, extraction, and maintenance occupations:
Here: 4.1% city: 6.4%
- Percentage of males in production occupations:
Here: 6.7% city: 5.0%
- Percentage of males in material moving occupations:
Here: 8.4% city: 6.2%
Occupations of females:
- Percentage of females in management occupations (except farmers):
Here: 10.9% city: 9.1%
- Percentage of females in business and financial operations occupations:
Here: 2.9% city: 6.6%
- Percentage of females in computer and mathematical occupations:
Here: 7.3% city: 1.7%
- Percentage of females in architecture and engineering occupations:
Here: 1.3% city: 0.7%
- Percentage of females in life, physical, and social science occupations:
Here: 6.9% city: 1.6%
- Percentage of females in community and social services occupations:
Here: 3.8% city: 3.6%
- Percentage of females in legal occupations:
Here: 1.7% city: 1.9%
- Percentage of females in education, training, and library occupations:
Here: 23.8% city: 8.5%
- Percentage of females in arts, design, entertainment, sports, and media occupations:
Here: 3.6% city: 2.4%
- Percentage of females in healthcare practitioners and technical occupations:
Here: 7.6% city: 10.3%
- Percentage of females in service occupations:
Here: 11.6% city: 24.4%
- Percentage of females in sales and office occupations:
Here: 17.2% city: 23.4%
- Percentage of females in production occupations:
Here: 1.4% city: 2.4%
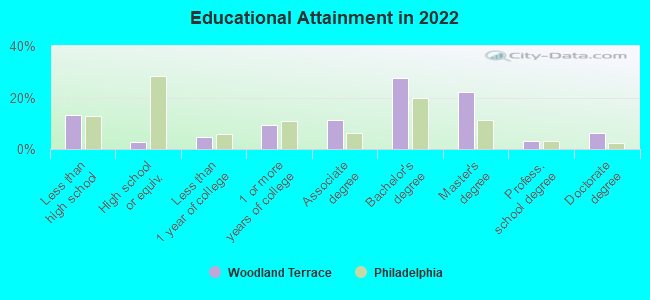
Education in this neighborhood (subdivision or community):
- Percentage of people 3 years and older in K-12 schools:
Woodland Terrace: 8.9% Philadelphia: 15.6%
- Percentage of people 3 years and older in undergraduate colleges:
Woodland Terrace: 32.9% Philadelphia: 6.0%
- Percentage of people 3 years and older in grad. or professional schools:
Woodland Terrace: 13.4% Philadelphia: 2.8%
- Percentage of students K-12 enrolled in private schools:
Woodland Terrace: 77.0% Philadelphia: 25.0%
Percentage of population below poverty level:
| Woodland Terrace: | 23.4% |
| Philadelphia: | 21.7% |
Median year owner moved in (as recorded in 2022):
Median year renter moved in (as recorded in 2022):
| Woodland Terrace: | 2002 |
| Philadelphia: | 2007 |
Median year renter moved in (as recorded in 2022):
| Woodland Terrace: | 2019 |
| Philadelphia: | 2019 |
Percentage of married-couple families with both working:
| Woodland Terrace: | 77.7% |
| Philadelphia: | 71.4% |
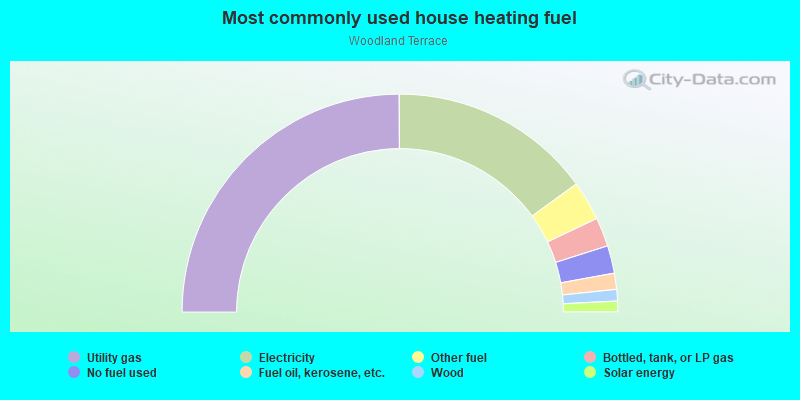
- 49.9%Utility gas
- 30.1%Electricity
- 5.9%Other fuel
- 4.3%Bottled, tank, or LP gas
- 4.1%No fuel used
- 2.4%Fuel oil, kerosene, etc.
- 1.7%Wood
- 1.6%Solar energy
Highways in this neighborhood:
US Hwy 13 (Baltimore Ave)
Length: 0.66 miles
Direction: E-W
Address range: 4000 to 4499
Direction: E-W
Address range: 4000 to 4499
Chester Ave
Length: 0.44 miles
Directions: E-W, SW-NE
Address range: 4001 to 4499
Directions: E-W, SW-NE
Address range: 4001 to 4499
Roads and streets:
Woodland Ave
Length: 0.45 miles
Directions: E-W, SW-NE
Address range: 4000 to 4299
Directions: E-W, SW-NE
Address range: 4000 to 4299
S 45th St
Length: 0.39 miles
Direction: SE-NW
Address range: 900 to 1299
Direction: SE-NW
Address range: 900 to 1299
S 43rd St
Length: 0.28 miles
Directions: E-W, N-S
Address range: 500 to 699
Directions: E-W, N-S
Address range: 500 to 699
S 42nd St
Length: 0.20 miles
Direction: N-S
Address range: 500 to 699
Direction: N-S
Address range: 500 to 699
Regent Sq
Length: 0.13 miles
Direction: E-W
Address range: 4200 to 4299
Direction: E-W
Address range: 4200 to 4299
S 41st St
Length: 0.12 miles
Direction: N-S
Address range: 500 to 699
Direction: N-S
Address range: 500 to 699
Kingsessing Ave
Length: 0.09 miles
Direction: E-W
Address range: 4300 to 4499
Direction: E-W
Address range: 4300 to 4499
Woodland Ter
Length: 0.08 miles
Direction: N-S
Address range: 500 to 599
Direction: N-S
Address range: 500 to 599
S Holly St
Length: 0.06 miles
Direction: N-S
Address range: 500 to 599
Direction: N-S
Address range: 500 to 599
S 40th St
Length: 0.05 miles
Direction: N-S
Address range: 500 to 599
Direction: N-S
Address range: 500 to 599
Springfield Ave
Length: 0.04 miles
Direction: SW-NE
Address range: 4496 to 4499
Direction: SW-NE
Address range: 4496 to 4499
St Marks St
Length: 0.04 miles
Direction: N-S
Address range: 500 to 599
Direction: N-S
Address range: 500 to 599