World Trade Center (WTC) neighborhood in New York, New York (NY), 10280 detailed profile
Settings
X


Business Search - 14 Million verified businesses
Area: 0.035 square miles
Population: 1,149
Population density:
| World Trade Center (WTC): | 32,749 people per square mile |
| New York: | 27,483 people per square mile |

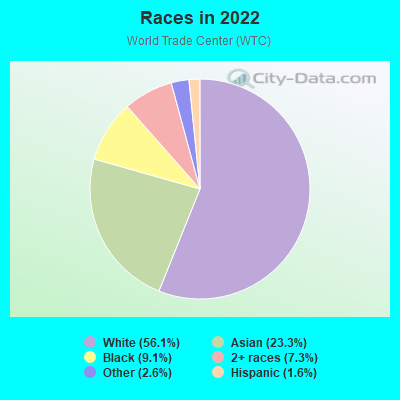
- 66256.1%White
- 27523.3%Asian
- 1079.1%Black
- 867.3%Two or more races
- 312.6%Some other race
- 191.6%Hispanic or Latino
Median household income in 2022:
| World Trade Center (WTC): | $193,285 |
| New York: | $74,694 |
Distribution of median household income
![Distribution of median household income]()
- 30Less than $10,000
- 67$20,000 to $29,999
- 34$30,000 to $39,999
- 93$40,000 to $49,999
- 29$50,000 to $59,999
- 21$60,000 to $74,999
- 17$75,000 to $99,999
- 15$100,000 to $124,999
- 45$125,000 to $149,999
- 18$150,000 to $199,999
- 411$200,000 or more

Distribution of owner-occupied house/condo value
![Distribution of owner-occupied house/condo value]()
- 9$300,000 to $399,999
- 13$400,000 to $499,999
- 21$500,000 to $749,999
- 47$750,000 to $999,999
- 109$1,000,000 or more

Distribution of rent paid by renters
![Distribution of rent paid by renters]()
- 1$1,250 to $1,499
- 150$1,500 to $1,999
- 700$2,000 or more

Median rent in 2022:
| World Trade Center (WTC): | $3,283 |
| New York: | $1,573 |
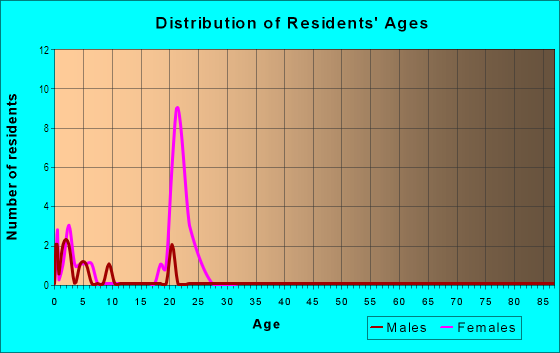
| Males: | 568 |
| Females: | 580 |
Males:
| This neighborhood: | 32.6 years |
| Whole city: | 37.0 years |
| This neighborhood: | 32.6 years |
| Whole city: | 39.8 years |
Average household size:
| World Trade Center (WTC): | 1.7 people |
| New York: | 2.4 people |
Percentage of family households:
| World Trade Center (WTC): | 35.3% |
| New York: | 38.3% |
| Here: | 33.0% |
| New York: | 34.8% |
Percentage of married-couple families with children (among all households):
| World Trade Center (WTC): | 58.1% |
| New York: | 25.9% |
Percentage of single-mother households (among all households):
| World Trade Center (WTC): | 44.8% |
| New York: | 11.8% |
Percentage of never married males 15 years old and over:
Percentage of never married females 15 years old and over:
| World Trade Center (WTC): | 25.8% |
| New York: | 21.7% |
Percentage of never married females 15 years old and over:
| World Trade Center (WTC): | 22.9% |
| city: | 22.4% |
Percentage of people that speak English not well or not at all:
| World Trade Center (WTC): | 1.8% |
| New York: | 12.2% |
Percentage of people born in this state:
Percentage of people born in another U.S. state:
Percentage of native residents but born outside the U.S.:
Percentage of foreign born residents:
| Here: | 31.5% |
| New York: | 48.0% |
Percentage of people born in another U.S. state:
| World Trade Center (WTC): | 36.7% |
| New York: | 11.7% |
Percentage of native residents but born outside the U.S.:
| Here: | 2.0% |
| city: | 3.6% |
Percentage of foreign born residents:
| Here: | 29.8% |
| New York: | 36.8% |
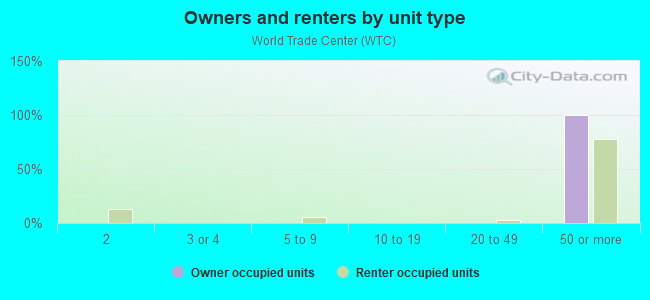
Owner-occupied
Renter-occupied

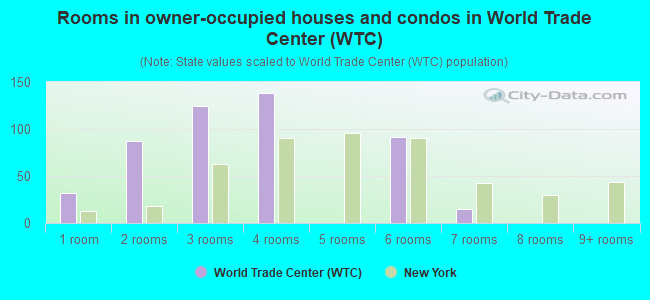
- Rooms in owner-occupied houses and condos in World Trade Center <
> - 321 room
- 872 rooms
- 1243 rooms
- 1384 rooms
- 05 rooms
- 916 rooms
- 157 rooms
- 08 rooms
- 09+ rooms
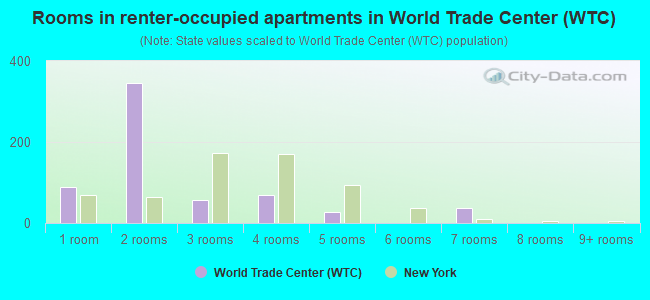
- Rooms in renter-occupied apartments in World Trade Center <
> - 881 room
- 3452 rooms
- 573 rooms
- 694 rooms
- 275 rooms
- 06 rooms
- 367 rooms
- 08 rooms
- 09+ rooms
Owner-occupied
Renter-occupied
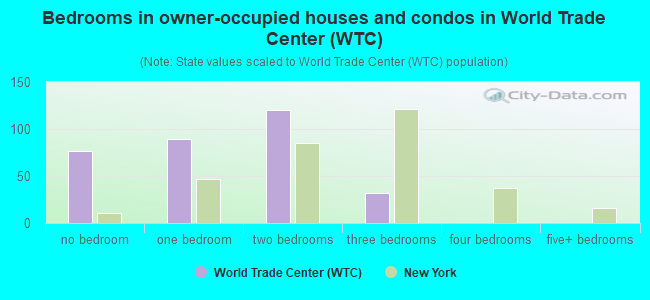
- Bedrooms in owner-occupied houses and condos in World Trade Center <
> - 77no bedroom
- 891 bedroom
- 1202 bedrooms
- 323 bedrooms
- 04 bedrooms
- 05+ bedrooms
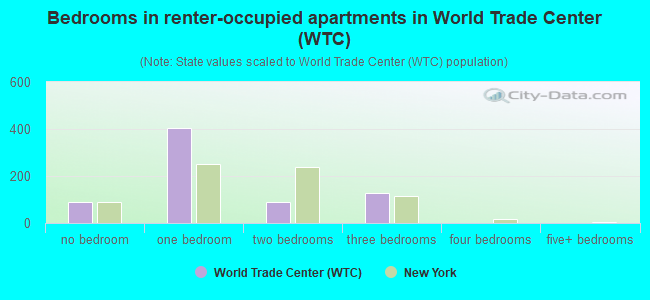
- Bedrooms in renter-occupied apartments in World Trade Center <
> - 90no bedroom
- 4061 bedroom
- 902 bedrooms
- 1263 bedrooms
- 04 bedrooms
- 05+ bedrooms
Average number of cars or other vehicles available in houses/condos:
Average number of cars or other vehicles available in apartments:
| This neighborhood: | |
| New York: |
Average number of cars or other vehicles available in apartments:
| Here: | |
| city: |
Percentage of units with a mortgage:
| World Trade Center (WTC): | 76.6% |
| New York: | 56.2% |
Average estimated '22 value of housing units in 5-or-more-unit structures (97.3% of all units):
| World Trade Center (WTC): | $936,776 |
| New York: | $1,049,248 |
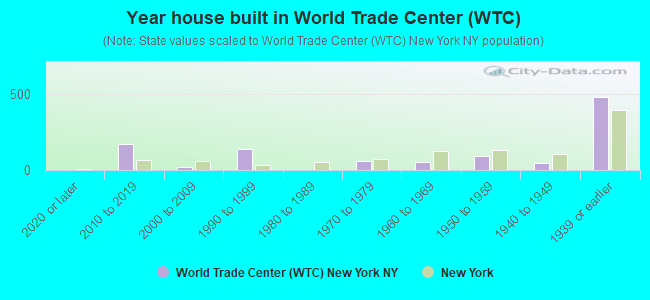
- Year house built in World Trade Center <
> - 02020 or later
- 1732010 to 2019
- 202000 to 2009
- 1351990 to 1999
- 01980 to 1989
- 561970 to 1979
- 501960 to 1969
- 911950 to 1959
- 461940 to 1949
- 4761939 or earlier
City-data.com crime index for city in 2020 (higher means more crime):
| City: | 229.7 |
| U.S. average: | 219.5 |
Travel time to work (commute)
![Travel time to work (commute)]()
- 15 to 9 minutes
- 810 to 14 minutes
- 515 to 19 minutes
- 520 to 24 minutes
- 525 to 29 minutes
- 930 to 34 minutes
- 435 to 39 minutes
- 340 to 44 minutes
- 8045 to 59 minutes
- 460 to 89 minutes
- 290 or more minutes

Means of transportation to work
![Means of transportation to work]()
- 6.0%42Drove a car alone
- 2.7%19Carpooled
- 13.1%91Bus
- 57.0%397Subway or elevated rail
- 26.4%184Long-distance train or commuter rail
- 2.9%20Light rail, streetcar or trolley
- 0.1%1Ferryboat
- 11.3%79Bicycle
- 11.9%83Walked
- 2.2%15Other means
- 22.2%155Worked at home

Time leaving home to go to work
![Time leaving home to go to work]()
- 16:30 a.m. to 6:59 a.m.
- 57:00 a.m. to 7:29 a.m.
- 47:30 a.m. to 7:59 a.m.
- 178:00 a.m. to 8:29 a.m.
- 68:30 a.m. to 8:59 a.m.
- 109:00 a.m. to 9:59 a.m.
- 210:00 a.m. to 10:59 a.m.

Occupations of males:
- Percentage of males in management occupations (except farmers):
Here: 11.1% city: 11.2%
- Percentage of males in business and financial operations occupations:
Here: 13.6% city: 6.4%
- Percentage of males in computer and mathematical occupations:
Here: 18.3% city: 5.3%
- Percentage of males in legal occupations:
Here: 43.8% city: 2.1%
- Percentage of males in sales and office occupations:
Here: 11.6% city: 15.0%
Occupations of females:
- Percentage of females in management occupations (except farmers):
Here: 27.9% city: 10.4%
- Percentage of females in business and financial operations occupations:
Here: 12.9% city: 7.1%
- Percentage of females in computer and mathematical occupations:
Here: 6.0% city: 1.9%
- Percentage of females in architecture and engineering occupations:
Here: 8.4% city: 0.6%
- Percentage of females in healthcare practitioners and technical occupations:
Here: 22.1% city: 7.8%
- Percentage of females in sales and office occupations:
Here: 20.4% city: 22.5%
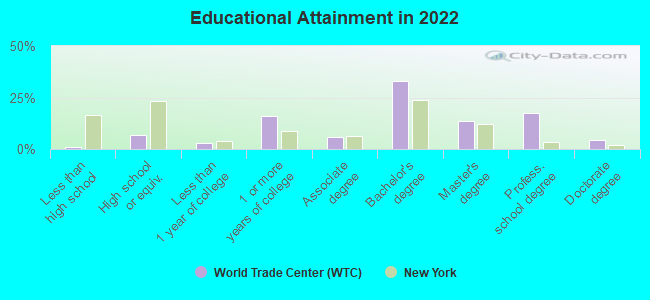
Education in this neighborhood (subdivision or community):
- Percentage of people 3 years and older in K-12 schools:
World Trade Center (WTC): 27.0% New York: 15.2%
- Percentage of people 3 years and older in undergraduate colleges:
World Trade Center (WTC): 3.7% New York: 5.1%
- Percentage of people 3 years and older in grad. or professional schools:
World Trade Center (WTC): 1.4% New York: 2.1%
- Percentage of students K-12 enrolled in private schools:
World Trade Center (WTC): 73.9% New York: 19.6%
Percentage of population below poverty level:
| World Trade Center (WTC): | 5.7% |
| New York: | 18.3% |
Median year renter moved in (as recorded in 2022):
| World Trade Center (WTC): | 2000 |
| New York: | 2016 |
Percentage of married-couple families with both working:
| World Trade Center (WTC): | 98.6% |
| New York: | 65.6% |
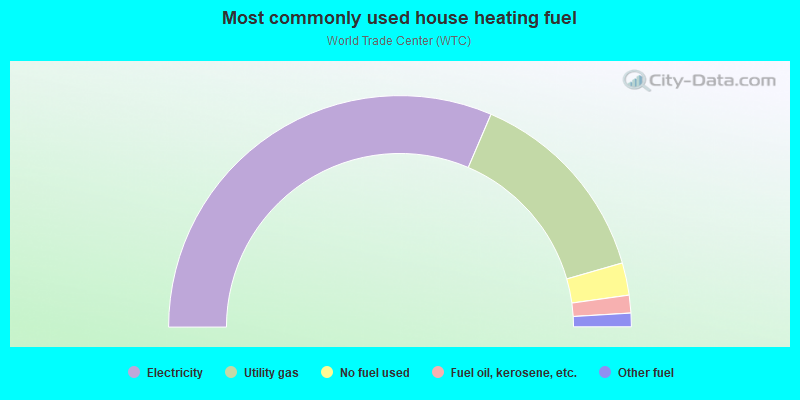
- 62.9%Electricity
- 28.2%Utility gas
- 4.5%No fuel used
- 2.5%Fuel oil, kerosene, etc.
- 1.9%Other fuel
Roads and streets:
Liberty St
Length: 0.20 miles
Direction: SE-NW
Address range: 100 to 199
Direction: SE-NW
Address range: 100 to 199
Church St
Length: 0.10 miles
Direction: SW-NE
Address range: 19 to 54
Direction: SW-NE
Address range: 19 to 54
Trinity Pl
Length: 0.06 miles
Direction: SW-NE
Address range: 130 to 199
Direction: SW-NE
Address range: 130 to 199