Young Terrace neighborhood in Norfolk, Virginia (VA), 23510 detailed profile
Settings
X


Business Search - 14 Million verified businesses
Area: 0.087 square miles
Population: 1,057
Population density:
| Young Terrace: | 12,105 people per square mile |
| Norfolk: | 4,337 people per square mile |

- 1,00894.7%Black
- 262.4%Two or more races
- 151.4%White
- 70.7%Hispanic or Latino
- 60.6%Asian
- 20.2%American Indian

Distribution of median household income
![Distribution of median household income]()
- 156Less than $10,000
- 137$10,000 to $19,999
- 57$20,000 to $29,999
- 43$30,000 to $39,999
- 17$40,000 to $49,999
- 9$50,000 to $59,999
- 27$60,000 to $74,999
- 17$75,000 to $99,999
- 10$100,000 to $124,999
- 26$125,000 to $149,999
- 26$150,000 to $199,999
- 36$200,000 or more

Distribution of owner-occupied house/condo value
![Distribution of owner-occupied house/condo value]()
- 18Less than $50,000
- 7$150,000 to $199,999
- 5$200,000 to $249,999
- 12$250,000 to $299,999
- 29$300,000 to $399,999
- 11$400,000 to $499,999
- 11$500,000 to $749,999
- 6$750,000 to $999,999
- 9$1,000,000 or more

Distribution of rent paid by renters
![Distribution of rent paid by renters]()
- 40Less than $100
- 53$100 to $199
- 66$200 to $299
- 47$300 to $399
- 47$400 to $499
- 84$500 to $599
- 32$600 to $699
- 36$700 to $799
- 16$800 to $899
- 11$900 to $999
- 3$1,000 to $1,249
- 17$1,250 to $1,499
- 31$1,500 to $1,999
- 42$2,000 or more

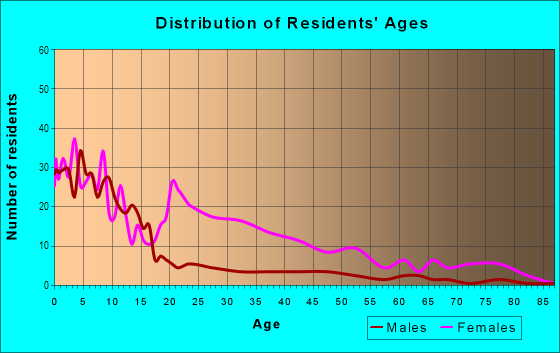
| Males: | 313 |
| Females: | 744 |
Males:
| This neighborhood: | 30.2 years |
| Whole city: | 31.3 years |
| This neighborhood: | 41.6 years |
| Whole city: | 34.4 years |
Average household size:
| Young Terrace: | 2.1 people |
| Norfolk: | 2.3 people |
Percentage of family households:
| Young Terrace: | 68.6% |
| Norfolk: | 41.3% |
| Here: | 13.0% |
| Norfolk: | 31.7% |
Percentage of married-couple families with children (among all households):
| Young Terrace: | 2.6% |
| Norfolk: | 20.2% |
Percentage of single-mother households (among all households):
| Young Terrace: | 41.7% |
| Norfolk: | 16.3% |
Percentage of never married males 15 years old and over:
Percentage of never married females 15 years old and over:
| Young Terrace: | 10.3% |
| Norfolk: | 25.4% |
Percentage of never married females 15 years old and over:
| Young Terrace: | 53.7% |
| city: | 20.5% |
Percentage of people that speak English not well or not at all:
| Young Terrace: | 1.6% |
| Norfolk: | 1.4% |
Percentage of people born in this state:
Percentage of people born in another U.S. state:
Percentage of native residents but born outside the U.S.:
Percentage of foreign born residents:
| Here: | 88.1% |
| Norfolk: | 51.1% |
Percentage of people born in another U.S. state:
| Young Terrace: | 11.9% |
| Norfolk: | 40.8% |
Percentage of native residents but born outside the U.S.:
| Here: | 1.4% |
| city: | 1.6% |
Percentage of foreign born residents:
| Here: | 5.3% |
| Norfolk: | 6.5% |

Owner-occupied
Renter-occupied


- Rooms in owner-occupied houses and condos in Young Terrace
- 11 room
- 102 rooms
- 153 rooms
- 474 rooms
- 45 rooms
- 126 rooms
- 17 rooms
- 48 rooms
- 49+ rooms

- Rooms in renter-occupied apartments in Young Terrace
- 21 room
- 32 rooms
- 503 rooms
- 1644 rooms
- 1625 rooms
- 636 rooms
- 37 rooms
- 08 rooms
- 09+ rooms
Owner-occupied
Renter-occupied

- Bedrooms in owner-occupied houses and condos in Young Terrace
- 4no bedroom
- 321 bedroom
- 412 bedrooms
- 163 bedrooms
- 44 bedrooms
- 45+ bedrooms

- Bedrooms in renter-occupied apartments in Young Terrace
- 2no bedroom
- 691 bedroom
- 2342 bedrooms
- 1363 bedrooms
- 04 bedrooms
- 05+ bedrooms
Average number of cars or other vehicles available in houses/condos:
Average number of cars or other vehicles available in apartments:
| This neighborhood: | 2.3 |
| Norfolk: | 2.0 |
Average number of cars or other vehicles available in apartments:
| Here: | 0.5 |
| city: | 1.3 |
Percentage of units with a mortgage:
| Young Terrace: | 32.6% |
| Norfolk: | 70.0% |
Average estimated value of detached houses in 2022 (3.4% of all units):
| Young Terrace: | $394,755 |
| Norfolk: | $337,508 |

- Year house built in Young Terrace
- 02020 or later
- 132010 to 2019
- 322000 to 2009
- 211990 to 1999
- 391980 to 1989
- 421970 to 1979
- 511960 to 1969
- 2011950 to 1959
- 811940 to 1949
- 311939 or earlier

City-data.com crime index for city in 2020 (higher means more crime):
| City: | 327.9 |
| U.S. average: | 219.5 |
Travel time to work (commute)
![Travel time to work (commute)]()
- 22Less than 5 minutes
- 155 to 9 minutes
- 7910 to 14 minutes
- 4415 to 19 minutes
- 2820 to 24 minutes
- 2125 to 29 minutes
- 3330 to 34 minutes
- 1135 to 39 minutes
- 140 to 44 minutes
- 1245 to 59 minutes
- 2460 to 89 minutes
- 1490 or more minutes

Means of transportation to work
![Means of transportation to work]()
- 54.0%161Drove a car alone
- 7.7%23Carpooled
- 15.4%46Bus
- 7.0%21Light rail, streetcar or trolley
- 4.0%12Ferryboat
- 0.7%2Bicycle
- 13.7%41Walked
- 1.0%3Other means
- 5.4%16Worked at home

Time leaving home to go to work
![Time leaving home to go to work]()
- 412:00 a.m. to 4:59 a.m.
- 165:00 a.m. to 5:29 a.m.
- 155:30 a.m. to 5:59 a.m.
- 276:00 a.m. to 6:29 a.m.
- 546:30 a.m. to 6:59 a.m.
- 457:00 a.m. to 7:29 a.m.
- 87:30 a.m. to 7:59 a.m.
- 588:00 a.m. to 8:29 a.m.
- 38:30 a.m. to 8:59 a.m.
- 79:00 a.m. to 9:59 a.m.
- 1510:00 a.m. to 10:59 a.m.
- 1411:00 a.m. to 11:59 a.m.
- 6012:00 p.m. to 3:59 p.m.
- 164:00 p.m. to 11:59 p.m.

Occupations of males:
- Percentage of males in service occupations:
Here: 57.6% city: 16.9%
- Percentage of males in sales and office occupations:
Here: 41.8% city: 15.6%
Occupations of females:
- Percentage of females in management occupations (except farmers):
Here: 1.7% city: 7.7%
- Percentage of females in education, training, and library occupations:
Here: 3.6% city: 9.1%
- Percentage of females in healthcare practitioners and technical occupations:
Here: 5.7% city: 9.6%
- Percentage of females in service occupations:
Here: 63.2% city: 22.3%
- Percentage of females in sales and office occupations:
Here: 8.4% city: 28.7%
- Percentage of females in construction, extraction, and maintenance occupations:
Here: 2.3% city: 0.5%
- Percentage of females in production occupations:
Here: 3.6% city: 2.7%
- Percentage of females in material moving occupations:
Here: 5.7% city: 2.4%
Percentage of people 16-64 in Armed Forces:
| Young Terrace: | 0.0% |
| Norfolk: | 15.8% |
Education in this neighborhood (subdivision or community):
- Percentage of people 3 years and older in K-12 schools:
Young Terrace: 35.2% Norfolk: 14.3%
- Percentage of people 3 years and older in undergraduate colleges:
Young Terrace: 4.5% Norfolk: 8.0%
- Percentage of people 3 years and older in grad. or professional schools:
Young Terrace: 2.8% Norfolk: 2.1%
- Percentage of students K-12 enrolled in private schools:
Young Terrace: 17.3% Norfolk: 16.2%
Percentage of population below poverty level:
| Young Terrace: | 64.2% |
| Norfolk: | 17.7% |
Median year owner moved in (as recorded in 2022):
Median year renter moved in (as recorded in 2022):
| Young Terrace: | 2005 |
| Norfolk: | 2013 |
Median year renter moved in (as recorded in 2022):
| Young Terrace: | 2016 |
| Norfolk: | 2020 |
Percentage of married-couple families with both working:
| Young Terrace: | 105.4% |
| Norfolk: | 65.5% |

- 65.5%Electricity
- 24.4%Utility gas
- 5.9%No fuel used
- 3.9%Other fuel
Highways in this neighborhood:
US Hwy 58 (State Rte 337, E Brambleton Ave)
Length: 0.19 miles
Direction: E-W
Address range: 494 to 682
Direction: E-W
Address range: 494 to 682
US Hwy 58 (US Hwy 460, Church St)
Length: 0.15 miles
Directions: N-S, SW-NE
Directions: N-S, SW-NE
Roads and streets:
E Olney Rd
Length: 0.38 miles
Directions: E-W, N-S, SE-NW, SW-NE
Address range: 546 to 685
Directions: E-W, N-S, SE-NW, SW-NE
Address range: 546 to 685
Nicholson St
Length: 0.31 miles
Directions: E-W, SE-NW
Address range: 235 to 699
Directions: E-W, SE-NW
Address range: 235 to 699
Lincoln St
Length: 0.17 miles
Directions: N-S, SW-NE
Address range: 700 to 898
Directions: N-S, SW-NE
Address range: 700 to 898
Whitaker Ln
Length: 0.10 miles
Direction: N-S
Address range: 800 to 899
Direction: N-S
Address range: 800 to 899
Smith St
Length: 0.06 miles
Directions: E-W, N-S, SE-NW
Address range: 816 to 854
Directions: E-W, N-S, SE-NW
Address range: 816 to 854
5th St
Length: 0.04 miles
Direction: SW-NE
Address range: 800 to 999
Direction: SW-NE
Address range: 800 to 999