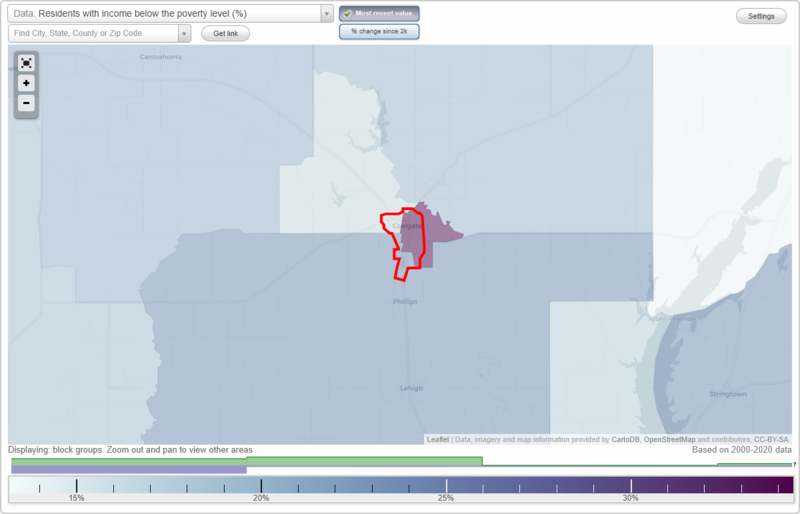
34.5% of Coalgate, OK residents had an income below the poverty level in 2022, which was 54.6% greater than the poverty level of 15.7% across the entire state of Oklahoma. 28.5% of high school graduates and 42.5% of non high school graduates live in poverty. The poverty rate was 37.4% among disabled residents. The renting rate among poor residents was 69.0%. For comparison, it was 32.0% among residents with income above the poverty level.
Poverty rates in Coalgate, OK
Residents with income below the poverty level in 2022:
Coalgate:
34.5%
Whole state:
15.7%
Residents with income below 50% of the poverty level in 2022:
Coalgate:
11.5%
Whole state:
7.4%
Poverty rate among disabled residents:
Coalgate:
37.4%
Oklahoma:
21.8%
Disability rate in this city among poor residents (it is 23.2% among residents who are not classified as poor):
Coalgate:
26.4%
Oklahoma:
24.5%
Renting rate in this city among poor and not poor residents:
Residents below poverty level:
69.0%
Residents above poverty level:
32.0%
Poverty by age in Coalgate, OK
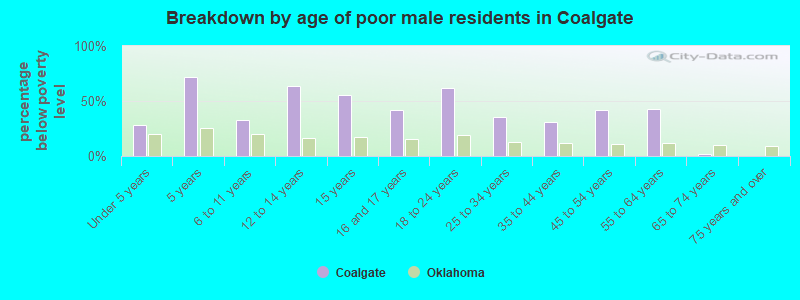
Breakdown by age of poor male residents in Coalgate,OK (percentage below poverty level)
28.3%Under 5 years
72.2%5 years
32.8%6 to 11 years
63.6%12 to 14 years
55.6%15 years
41.4%16 and 17 years
61.9%18 to 24 years
35.5%25 to 34 years
30.7%35 to 44 years
42.1%45 to 54 years
42.3%55 to 64 years
2.0%65 to 74 years
0.0%75 years and over
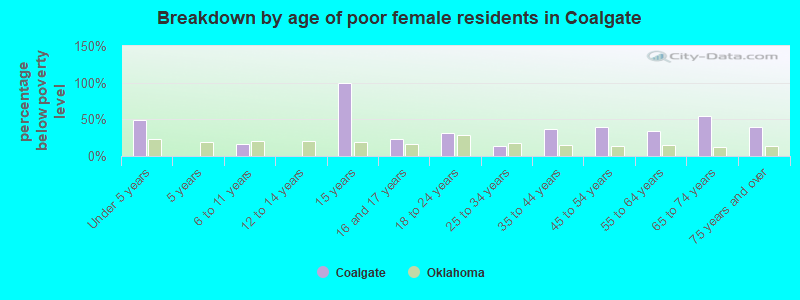
Breakdown by age of poor female residents in Coalgate,OK (percentage below poverty level)
49.0%Under 5 years
0.0%5 years
17.0%6 to 11 years
0.0%12 to 14 years
100.0%15 years
23.0%16 and 17 years
32.0%18 to 24 years
13.0%25 to 34 years
37.0%35 to 44 years
39.0%45 to 54 years
34.0%55 to 64 years
55.0%65 to 74 years
40.0%75 years and over
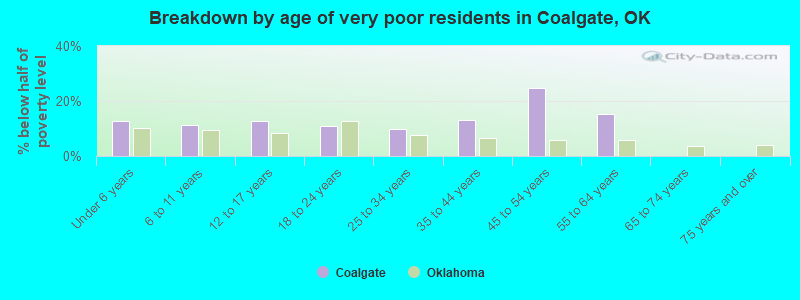
Breakdown by age of very poor residents in Coalgate,OK (% below half of poverty level)
12.7%Under 6 years
11.1%6 to 11 years
12.6%12 to 17 years
11.0%18 to 24 years
10.0%25 to 34 years
13.2%35 to 44 years
24.6%45 to 54 years
15.3%55 to 64 years
0.0%65 to 74 years
0.0%75 years and over
Poverty by race and place of birth in Coalgate, OK
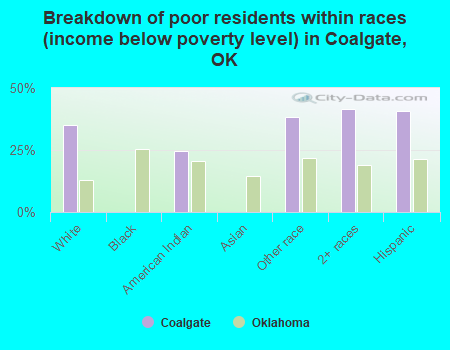
Breakdown of poor residents within races in Coalgate, OK (%)
35.3%White
0.0%Black
24.7%American Indian
0.0%Asian
38.1%Other race
41.6%2+ races
40.6%Hispanic
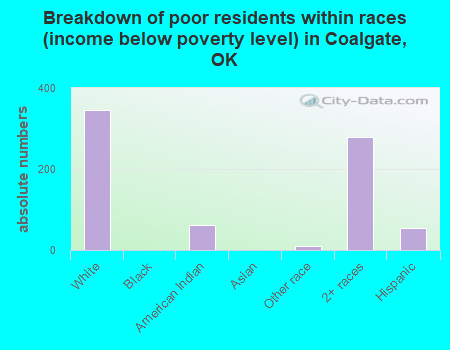
Breakdown of poor residents within races in Coalgate, OK (absolute numbers)
346White
0Black
61American Indian
0Asian
10Other race
2802+ races
54Hispanic
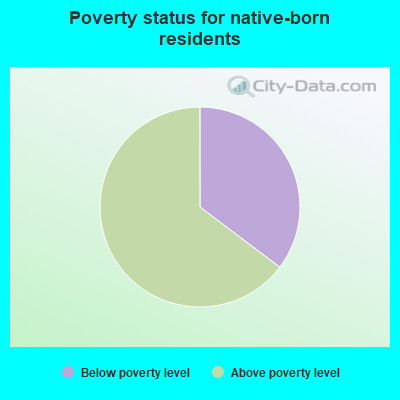
35.3%Below poverty level
64.7%Above poverty level
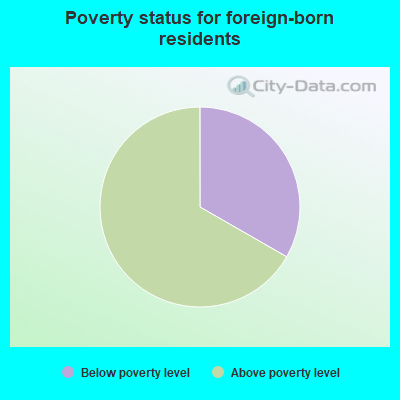
33.3%Below poverty level
66.7%Above poverty level
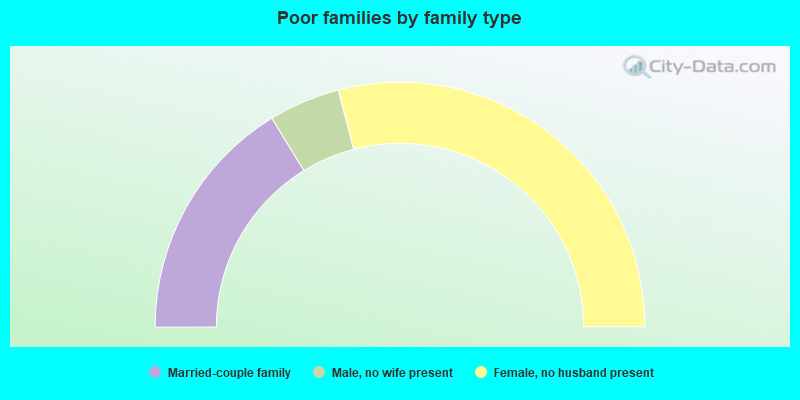
Poverty in families in Coalgate, OK
Children below poverty level:
Coalgate, Oklahoma:
37.9%
State:
19.5%
Poverty rate among high school graduates:
Coalgate:
28.5%
Oklahoma:
11.3%
Poverty rate among people who did not graduate high school:
Coalgate:
42.5%
Oklahoma:
28.7%
32.5%Married-couple family
9.4%Male, no wife present
58.1%Female, no husband present
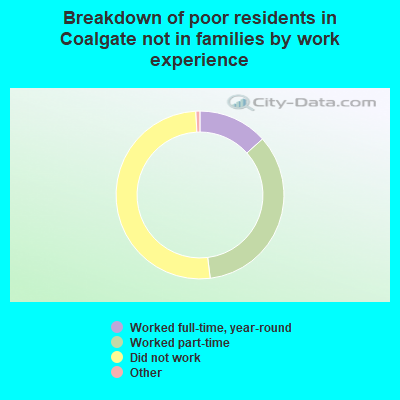
13.5%Worked full-time, year-round
35.0%Worked part-time
51.6%Did not work
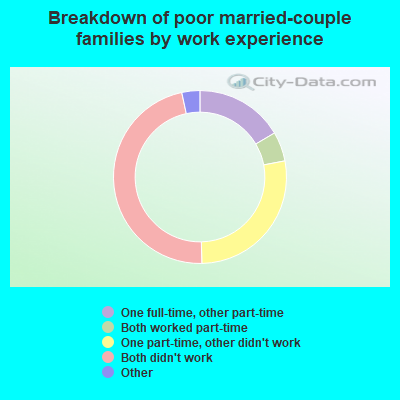
0.0%Both worked full-time
17.1%One full-time, other part-time
0.0%One full-time, other didn't work
5.7%Both worked part-time
28.6%One part-time, other didn't work
48.6%Both didn't work
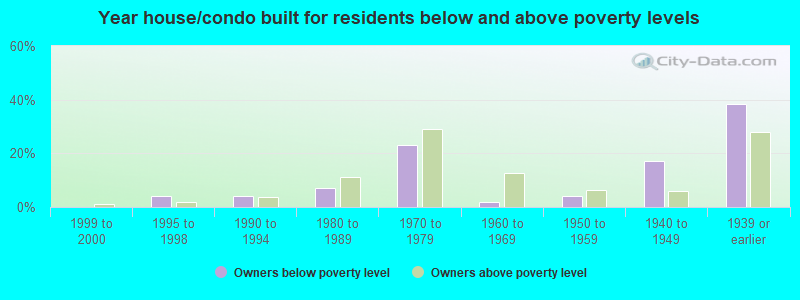
Other data
Owners below poverty level
0.0%1999 to 2000
4.0%1995 to 1998
4.0%1990 to 1994
7.1%1980 to 1989
23.2%1970 to 1979
2.0%1960 to 1969
4.0%1950 to 1959
17.2%1940 to 1949
38.4%1939 or earlier
Owners above poverty level
1.3%1999 to 2000
1.8%1995 to 1998
3.8%1990 to 1994
11.3%1980 to 1989
29.1%1970 to 1979
12.8%1960 to 1969
6.3%1950 to 1959
6.0%1940 to 1949
27.8%1939 or earlier
Discuss Coalgate, Oklahoma (OK) on our hugely popular Oklahoma forum.