Hanover, New York (NY) Poverty Rate Data
Information about poor and low-income residents

Recent posts about poverty in Hanover, New York on our local forum with over 2,400,000 registered users:
 | Exactly Where Money Is Wasted On MTA projects has been identified (67 replies) |
| Events in Syracuse? (1144 replies) |
| Functional vs. Beautiful City Design (147 replies) |
| JPMorgan Weighs Shifting Thousands of Jobs Out of New York Area (140 replies) |
| Whether you liked Giuliani or not (239 replies) |
| Central to Albany Buffalo Pittsburgh with great restaurants (63 replies) |
14.1% of Hanover, NY residents had an income below the poverty level in 2022, which was about the same as the poverty level of 14.3% across the entire state of New York. Taking into account residents not living in families, 17.0% of high school graduates and 35.0% of non high school graduates live in poverty. The poverty rate was 9.7% among disabled males and 18.4% among disabled females. The renting rate among poor residents was 48.3%. For comparison, it was 19.6% among residents with income above the poverty level.
Poverty rates in Hanover, NY
Residents with income below the poverty level in 2022:
Residents with income below 50% of the poverty level in 2022:
Poverty rate among disabled males:
Poverty rate among disabled females:
Renting rate in this town among poor and not poor residents:
| Hanover: | 14.1% |
| Whole state: | 14.3% |
| Hanover: | 3.5% |
| Whole state: | 7.4% |
Poverty rate among disabled males:
| Hanover: | 9.7% |
| New York: | 18.1% |
Disability rate in this town among poor males (it is 21.0% among male residents who are not classified as poor):
| Hanover: | 33.5% |
| New York: | 29.6% |
Poverty rate among disabled females:
| Hanover: | 18.4% |
| New York: | 23.0% |
Disability rate in this town among poor females (it is 19.4% among female residents who are not classified as poor):
| Hanover: | 27.3% |
| New York: | 31.0% |
Renting rate in this town among poor and not poor residents:
| Residents below poverty level: | 48.3% |
| Residents above poverty level: | 19.6% |
Poverty by age in Hanover, NY
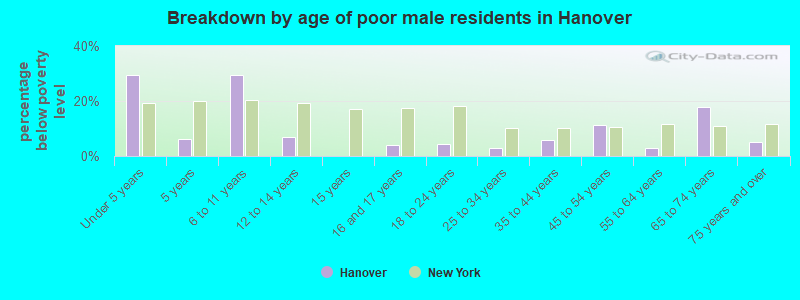
- Breakdown by age of poor male residents in Hanover,NY (percentage below poverty level)
- 29.4%Under 5 years
- 6.2%5 years
- 29.5%6 to 11 years
- 6.9%12 to 14 years
- 0.0%15 years
- 4.0%16 and 17 years
- 4.4%18 to 24 years
- 3.0%25 to 34 years
- 5.9%35 to 44 years
- 11.1%45 to 54 years
- 2.8%55 to 64 years
- 18.0%65 to 74 years
- 5.3%75 years and over
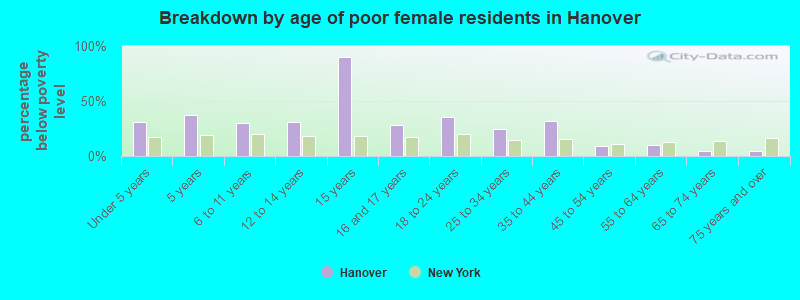
- Breakdown by age of poor female residents in Hanover,NY (percentage below poverty level)
- 30.9%Under 5 years
- 37.3%5 years
- 30.4%6 to 11 years
- 30.8%12 to 14 years
- 90.0%15 years
- 28.2%16 and 17 years
- 35.4%18 to 24 years
- 24.3%25 to 34 years
- 32.2%35 to 44 years
- 9.2%45 to 54 years
- 10.1%55 to 64 years
- 4.9%65 to 74 years
- 4.7%75 years and over
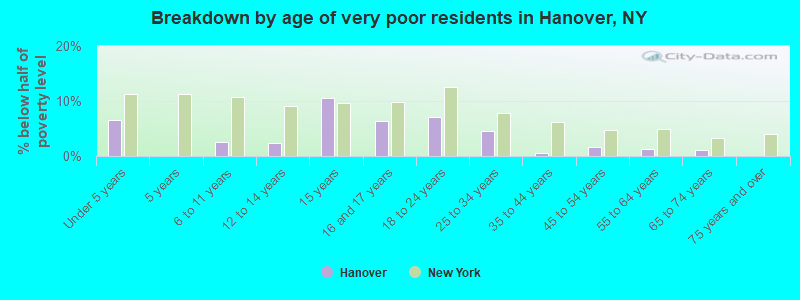
- Breakdown by age of very poor residents in Hanover,NY (% below half of poverty level)
- 6.6%Under 5 years
- 0.0%5 years
- 2.5%6 to 11 years
- 2.4%12 to 14 years
- 10.5%15 years
- 6.3%16 and 17 years
- 7.1%18 to 24 years
- 4.6%25 to 34 years
- 0.5%35 to 44 years
- 1.6%45 to 54 years
- 1.3%55 to 64 years
- 1.1%65 to 74 years
- 0.0%75 years and over
Poverty by race and place of birth in Hanover, NY
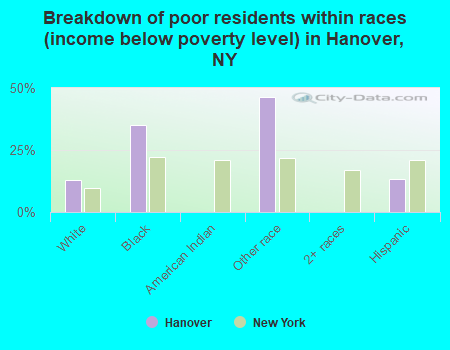
- Breakdown of poor residents within races in Hanover, NY (%)
- 12.8%White
- 35.2%Black
- 0.0%American Indian
- 46.2%Other race
- 0.0%2+ races
- 13.2%Hispanic
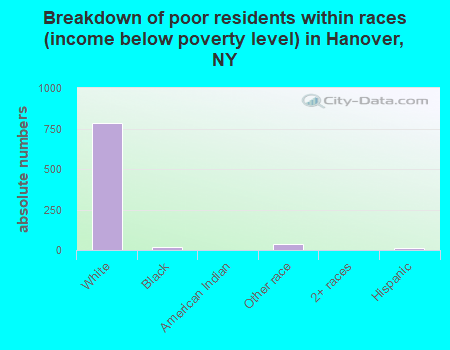
- Breakdown of poor residents within races in Hanover, NY (absolute numbers)
- 787White
- 16Black
- 0American Indian
- 39Other race
- 02+ races
- 12Hispanic
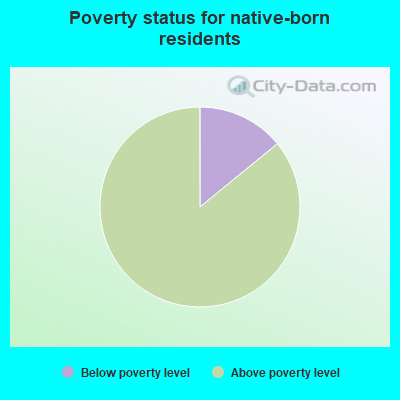
- 14.1%Below poverty level
- 85.9%Above poverty level
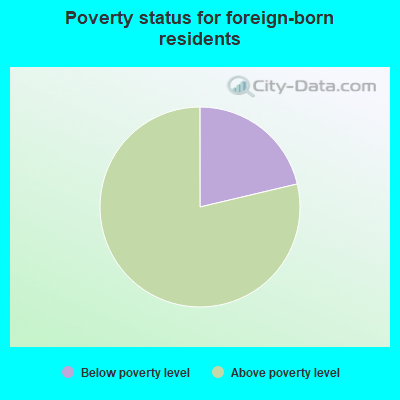
- 21.3%Below poverty level
- 78.7%Above poverty level
Poverty in families in Hanover, NY
Children below poverty level:
| Hanover, New York: | 26.1% |
| State: | 18.5% |
Poverty rate among high school graduates not in families:
| Hanover: | 17.0% |
| New York: | 18.3% |
Poverty rate among people who did not graduate high school not in families:
| Hanover: | 35.0% |
| New York: | 44.0% |
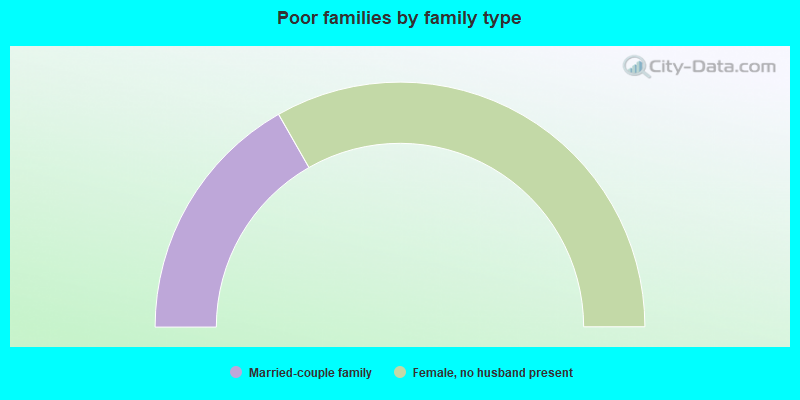
- 33.5%Married-couple family
- 0.0%Male, no wife present
- 66.5%Female, no husband present
Other data
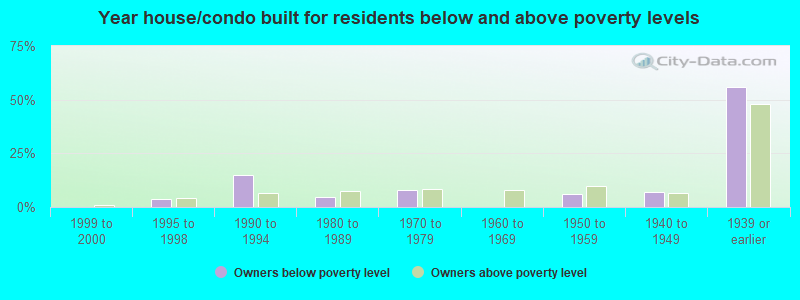
- Owners below poverty level
- 0.0%1999 to 2000
- 3.6%1995 to 1998
- 14.9%1990 to 1994
- 4.8%1980 to 1989
- 7.7%1970 to 1979
- 0.0%1960 to 1969
- 6.0%1950 to 1959
- 7.1%1940 to 1949
- 56.0%1939 or earlier
- Owners above poverty level
- 0.8%1999 to 2000
- 4.4%1995 to 1998
- 6.6%1990 to 1994
- 7.2%1980 to 1989
- 8.5%1970 to 1979
- 7.9%1960 to 1969
- 9.8%1950 to 1959
- 6.7%1940 to 1949
- 48.1%1939 or earlier