Laporte, Pennsylvania (PA) Poverty Rate Data
Data:
Residents with income below the poverty level (%)
Residents with income below the poverty level (% change since 2000)
Residents with income below the poverty level (%) - White
Residents with income below the poverty level (% change since 2000) - White
Residents with income below the poverty level (%) - Black or African American
Residents with income below the poverty level (% change since 2000) - Black or African American
Residents with income below the poverty level (%) - Asian
Residents with income below the poverty level (% change since 2000) - Asian
Residents with income below the poverty level (%) - Hispanic or Latino
Residents with income below the poverty level (% change since 2000) - Hispanic or Latino
Residents with income below the poverty level (%) - American Indian and Alaska Native
Residents with income below the poverty level (% change since 2000) - American Indian and Alaska Native
Residents with income below the poverty level (%) - Multirace
Residents with income below the poverty level (% change since 2000) - Multirace
Residents with income below the poverty level (%) - Other
Residents with income below the poverty level (% change since 2000) - Other
Residents with income below 50% of the poverty level (%)
Poor families by family type - Married-couple family (%)
Poor families by family type - Married-couple family (% change since 2000)
Poor families by family type - Male, no wife present (%)
Poor families by family type - Male, no wife present (% change since 2000)
Poor families by family type - Female, no husband present (%)
Poor families by family type - Female, no husband present (% change since 2000)
Poverty status for native-born residents (%)
Poverty status for native-born residents (% change since 2000)
Poverty status for foreign-born residents (%)
Poverty status for foreign-born residents (% change since 2000)
Children below poverty level (%)
Poverty among high school graduates not in families (%)
Poverty among people who did not graduate high school not in families (%)
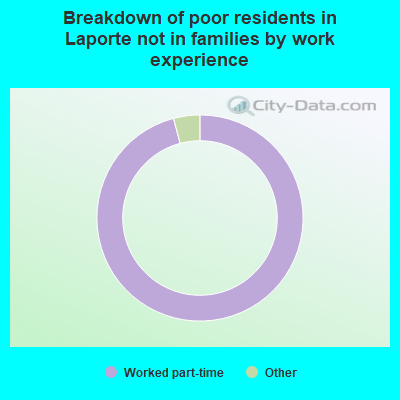
Breakdown of poor residents not in families by work experience - Worked full-time, year-round (%)
Breakdown of poor residents not in families by work experience - Worked part-time (%)
Breakdown of poor residents not in families by work experience - Did not work (%)
Breakdown of poor married-couple families by work experience - Both worked full-time (%)
Breakdown of poor married-couple families by work experience - One full-time, other part-time (%)
Breakdown of poor married-couple families by work experience - One full-time, other didn't work (%)
Breakdown of poor married-couple families by work experience - Both worked part-time (%)
Breakdown of poor married-couple families by work experience - One part-time, other didn't work (%)
Breakdown of poor married-couple families by work experience - Both didn't work (%)
Renting rate among poor residents (%)
Renting rate among not poor residents (%)
0.7% of Laporte, PA residents had an income below the poverty level in 2022, which was 1507.0% less than the poverty level of 11.8% across the entire state of Pennsylvania.
Poverty rates in Laporte, PA Residents with income below the poverty level in 2022:
Laporte:
0.7%Whole state:
11.8%
Poverty in families in Laporte, PA Poverty rate among high school graduates not in families: Laporte:
16.2%Pennsylvania:
18.9%
0.0% Worked full-time, year-round100.0% Worked part-time0.0% Did not work
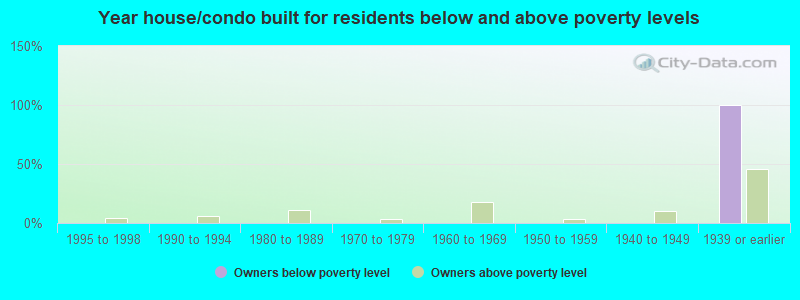
Other data
Owners below poverty level 0.0% 1999 to 20000.0% 1995 to 19980.0% 1990 to 19940.0% 1980 to 19890.0% 1970 to 19790.0% 1960 to 19690.0% 1950 to 19590.0% 1940 to 1949100.0% 1939 or earlierOwners above poverty level 0.0% 1999 to 20004.2% 1995 to 19985.6% 1990 to 199411.1% 1980 to 19892.8% 1970 to 197918.1% 1960 to 19692.8% 1950 to 19599.7% 1940 to 194945.8% 1939 or earlier