Lynchburg, Tennessee (TN) Poverty Rate Data
Information about poor and low-income residents

Recent posts about poverty in Lynchburg, Tennessee on our local forum with over 2,400,000 registered users:
 | Time to move,considering NE Tenn (55 replies) |
| Nashville Trip/Stadium Series Travel Thread (22 replies) |
| Visiting tn for the first time next summer what do y’all recommend (5 replies) |
| Algood Liquor Vote (30 replies) |
| Month long road trip -(Dec-Jan) . (12 replies) |
| Hi relocating to possibly Liberty Tennessee, McEwen area or Lynchburg. (16 replies) |
9.9% of Lynchburg, TN residents had an income below the poverty level in 2022, which was 33.8% less than the poverty level of 13.3% across the entire state of Tennessee. 9.1% of high school graduates and 11.8% of non high school graduates live in poverty. The poverty rate was 19.7% among disabled residents. The renting rate among poor residents was 35.1%. For comparison, it was 8.7% among residents with income above the poverty level.
Poverty rates in Lynchburg, TN
Residents with income below the poverty level in 2022:
Residents with income below 50% of the poverty level in 2022:
Poverty rate among disabled residents:
Renting rate in this city among poor and not poor residents:
| Lynchburg: | 9.9% |
| Whole state: | 13.3% |
| Lynchburg: | 4.1% |
| Whole state: | 6.2% |
Poverty rate among disabled residents:
| Lynchburg: | 19.7% |
| Tennessee: | 21.2% |
Disability rate in this city among poor residents (it is 14.0% among residents who are not classified as poor):
| Lynchburg: | 31.2% |
| Tennessee: | 24.0% |
Renting rate in this city among poor and not poor residents:
| Residents below poverty level: | 35.1% |
| Residents above poverty level: | 8.7% |
Poverty by age in Lynchburg, TN
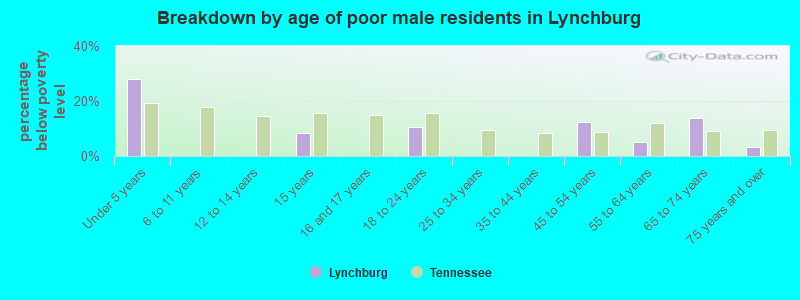
- Breakdown by age of poor male residents in Lynchburg,TN (percentage below poverty level)
- 28.1%Under 5 years
- 0.0%6 to 11 years
- 0.0%12 to 14 years
- 8.4%15 years
- 0.0%16 and 17 years
- 10.4%18 to 24 years
- 0.0%25 to 34 years
- 0.0%35 to 44 years
- 12.5%45 to 54 years
- 5.1%55 to 64 years
- 14.0%65 to 74 years
- 3.4%75 years and over
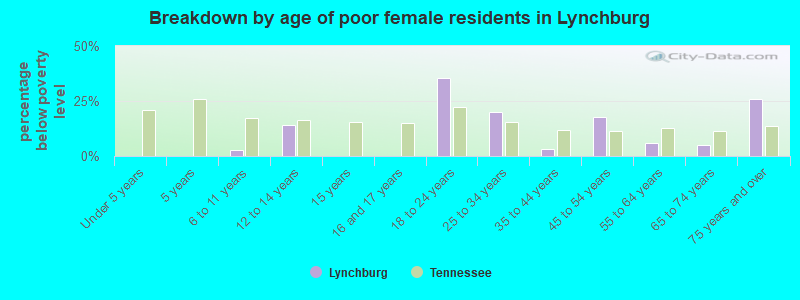
- Breakdown by age of poor female residents in Lynchburg,TN (percentage below poverty level)
- 0.0%Under 5 years
- 0.0%5 years
- 2.6%6 to 11 years
- 14.1%12 to 14 years
- 0.0%15 years
- 0.0%16 and 17 years
- 35.3%18 to 24 years
- 20.1%25 to 34 years
- 3.1%35 to 44 years
- 17.6%45 to 54 years
- 6.0%55 to 64 years
- 4.9%65 to 74 years
- 26.0%75 years and over
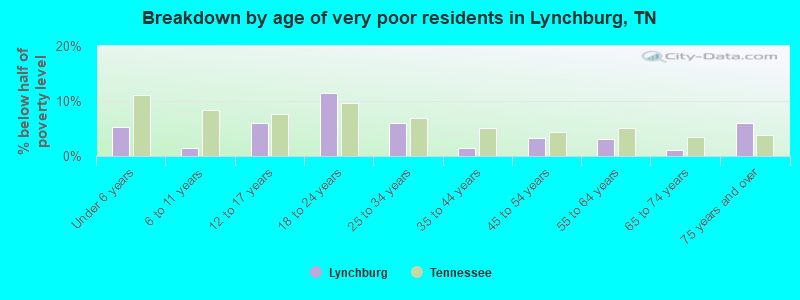
- Breakdown by age of very poor residents in Lynchburg,TN (% below half of poverty level)
- 5.3%Under 6 years
- 1.4%6 to 11 years
- 6.0%12 to 17 years
- 11.4%18 to 24 years
- 5.9%25 to 34 years
- 1.5%35 to 44 years
- 3.3%45 to 54 years
- 3.1%55 to 64 years
- 1.0%65 to 74 years
- 6.0%75 years and over
Poverty by race and place of birth in Lynchburg, TN
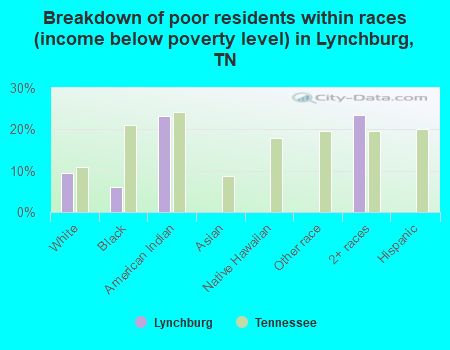
- Breakdown of poor residents within races in Lynchburg, TN (%)
- 9.5%White
- 5.9%Black
- 23.3%American Indian
- 0.0%Asian
- 0.0%Native Hawaiian
- 0.0%Other race
- 23.4%2+ races
- 0.0%Hispanic
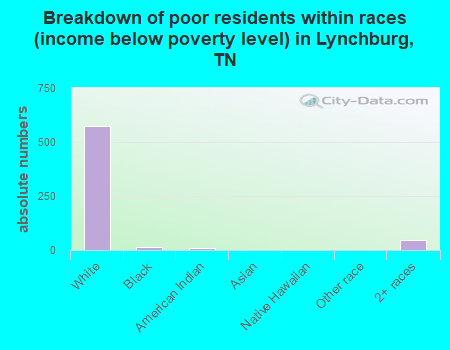
- Breakdown of poor residents within races in Lynchburg, TN (absolute numbers)
- 575White
- 13Black
- 9American Indian
- 0Asian
- 0Native Hawaiian
- 0Other race
- 482+ races
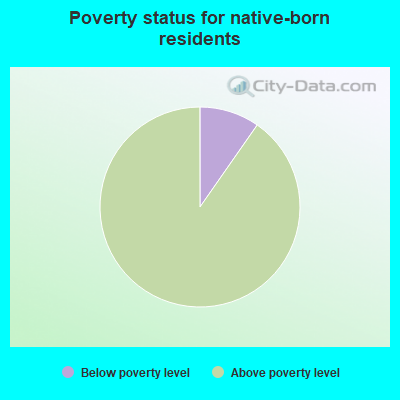
- 9.7%Below poverty level
- 90.3%Above poverty level
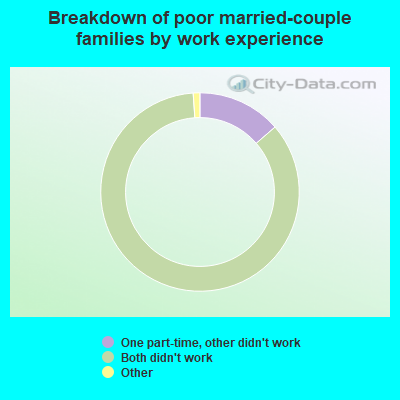
Poverty in families in Lynchburg, TN
Children below poverty level:
| Lynchburg, Tennessee: | 6.0% |
| State: | 17.3% |
Poverty rate among high school graduates:
| Lynchburg: | 9.1% |
| Tennessee: | 9.5% |
Poverty rate among people who did not graduate high school:
| Lynchburg: | 11.8% |
| Tennessee: | 27.9% |
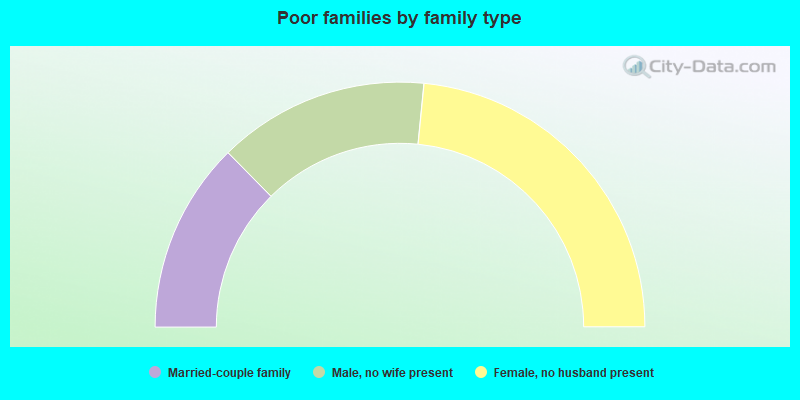
- 25.2%Married-couple family
- 27.9%Male, no wife present
- 46.8%Female, no husband present
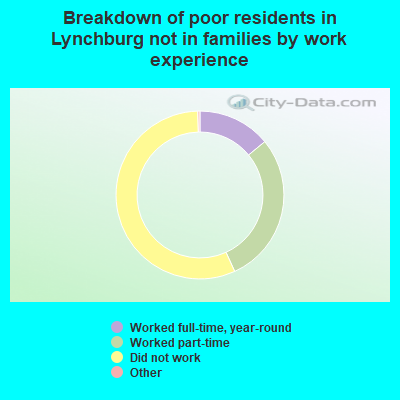
- 14.1%Worked full-time, year-round
- 29.3%Worked part-time
- 56.6%Did not work
- 0.0%Both worked full-time
- 0.0%One full-time, other part-time
- 0.0%One full-time, other didn't work
- 0.0%Both worked part-time
- 13.8%One part-time, other didn't work
- 86.2%Both didn't work
Other data
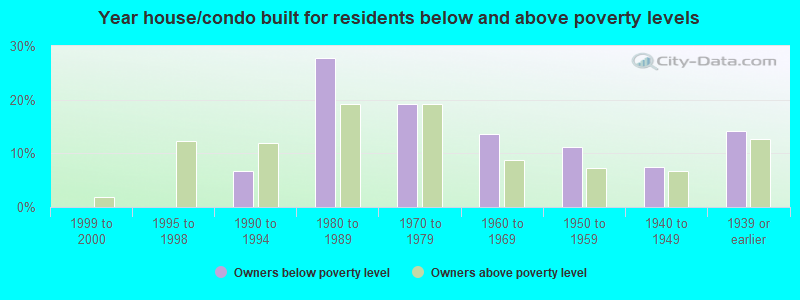
- Owners below poverty level
- 0.0%1999 to 2000
- 0.0%1995 to 1998
- 6.8%1990 to 1994
- 27.8%1980 to 1989
- 19.1%1970 to 1979
- 13.6%1960 to 1969
- 11.1%1950 to 1959
- 7.4%1940 to 1949
- 14.2%1939 or earlier
- Owners above poverty level
- 2.0%1999 to 2000
- 12.3%1995 to 1998
- 11.8%1990 to 1994
- 19.3%1980 to 1989
- 19.2%1970 to 1979
- 8.8%1960 to 1969
- 7.2%1950 to 1959
- 6.8%1940 to 1949
- 12.7%1939 or earlier