Marilla, New York (NY) Poverty Rate Data
Information about poor and low-income residents

Recent posts about poverty in Marilla, New York on our local forum with over 2,400,000 registered users:
 | Buffalo-Boom/Bust II (617 replies) |
| Erie County property tax bill higher then what was expected (28 replies) |
| Colden has a higher median household income than orchard park??? (1 reply) |
| Richest zip codes 2015 (29 replies) |
| Poloncarz proposes High-Speed internet Access (4 replies) |
| Should I move back................ (22 replies) |
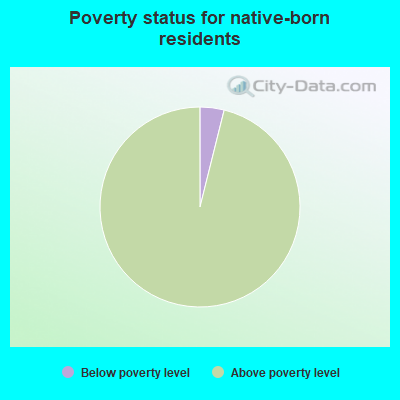
4.0% of Marilla, NY residents had an income below the poverty level in 2022, which was 255.8% less than the poverty level of 14.3% across the entire state of New York. Taking into account residents not living in families, 11.1% of high school graduates and 22.7% of non high school graduates live in poverty. The poverty rate was 8.1% among disabled males and 7.1% among disabled females. The renting rate among poor residents was 27.8%. For comparison, it was 6.8% among residents with income above the poverty level.
Poverty rates in Marilla, NY
Residents with income below the poverty level in 2022:
Residents with income below 50% of the poverty level in 2022:
Poverty rate among disabled males:
Poverty rate among disabled females:
Renting rate in this town among poor and not poor residents:
| Marilla: | 4.0% |
| Whole state: | 14.3% |
| Marilla: | 1.0% |
| Whole state: | 7.4% |
Poverty rate among disabled males:
| Marilla: | 8.1% |
| New York: | 18.1% |
Disability rate in this town among poor males (it is 15.9% among male residents who are not classified as poor):
| Marilla: | 35.3% |
| New York: | 29.6% |
Poverty rate among disabled females:
| Marilla: | 7.1% |
| New York: | 23.0% |
Disability rate in this town among poor females (it is 14.1% among female residents who are not classified as poor):
| Marilla: | 28.6% |
| New York: | 31.0% |
Renting rate in this town among poor and not poor residents:
| Residents below poverty level: | 27.8% |
| Residents above poverty level: | 6.8% |
Poverty by age in Marilla, NY
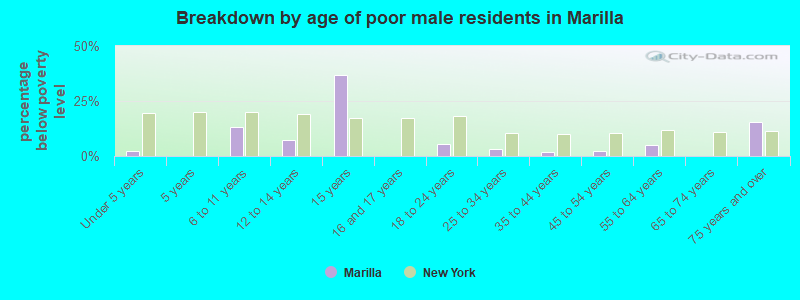
- Breakdown by age of poor male residents in Marilla,NY (percentage below poverty level)
- 2.1%Under 5 years
- 0.0%5 years
- 13.3%6 to 11 years
- 7.5%12 to 14 years
- 36.8%15 years
- 0.0%16 and 17 years
- 5.3%18 to 24 years
- 3.2%25 to 34 years
- 1.6%35 to 44 years
- 2.5%45 to 54 years
- 5.0%55 to 64 years
- 0.0%65 to 74 years
- 15.3%75 years and over
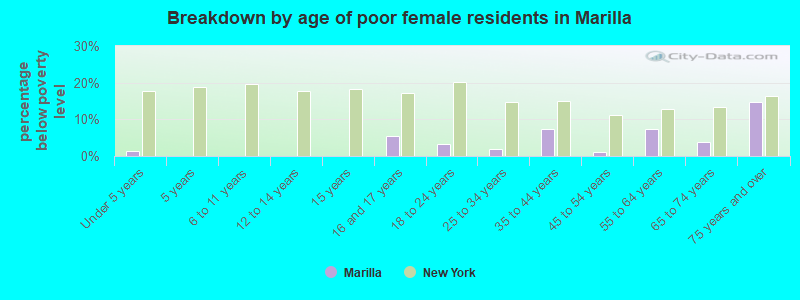
- Breakdown by age of poor female residents in Marilla,NY (percentage below poverty level)
- 1.2%Under 5 years
- 0.0%5 years
- 0.0%6 to 11 years
- 0.0%12 to 14 years
- 0.0%15 years
- 5.3%16 and 17 years
- 3.4%18 to 24 years
- 1.9%25 to 34 years
- 7.2%35 to 44 years
- 1.1%45 to 54 years
- 7.5%55 to 64 years
- 3.9%65 to 74 years
- 14.6%75 years and over
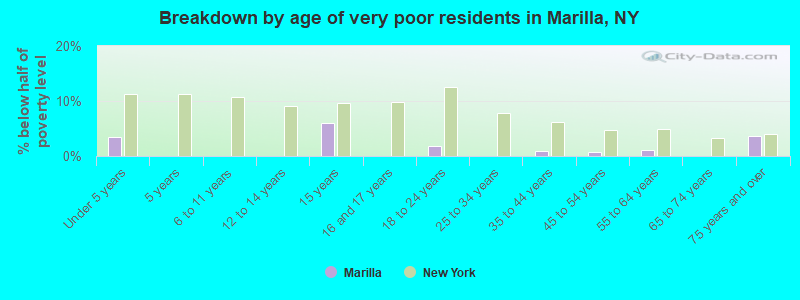
- Breakdown by age of very poor residents in Marilla,NY (% below half of poverty level)
- 3.4%Under 5 years
- 0.0%5 years
- 0.0%6 to 11 years
- 0.0%12 to 14 years
- 6.0%15 years
- 0.0%16 and 17 years
- 1.8%18 to 24 years
- 0.0%25 to 34 years
- 0.8%35 to 44 years
- 0.8%45 to 54 years
- 1.0%55 to 64 years
- 0.0%65 to 74 years
- 3.6%75 years and over
Poverty by race and place of birth in Marilla, NY
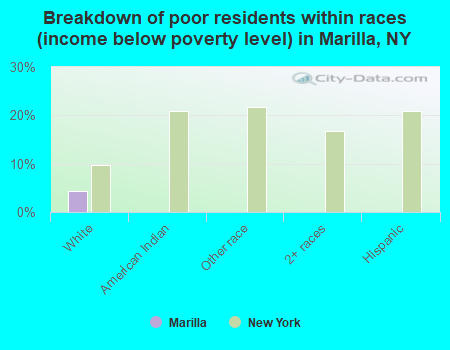
- Breakdown of poor residents within races in Marilla, NY (%)
- 4.4%White
- 0.0%American Indian
- 0.0%Other race
- 0.0%2+ races
- 0.0%Hispanic
- Breakdown of poor residents within races in Marilla, NY (absolute numbers)
- 223White
- 3.9%Below poverty level
- 96.1%Above poverty level
Poverty in families in Marilla, NY
Children below poverty level:
| Marilla, New York: | 4.2% |
| State: | 18.5% |
Poverty rate among high school graduates not in families:
| Marilla: | 11.1% |
| New York: | 18.3% |
Poverty rate among people who did not graduate high school not in families:
| Marilla: | 22.7% |
| New York: | 44.0% |
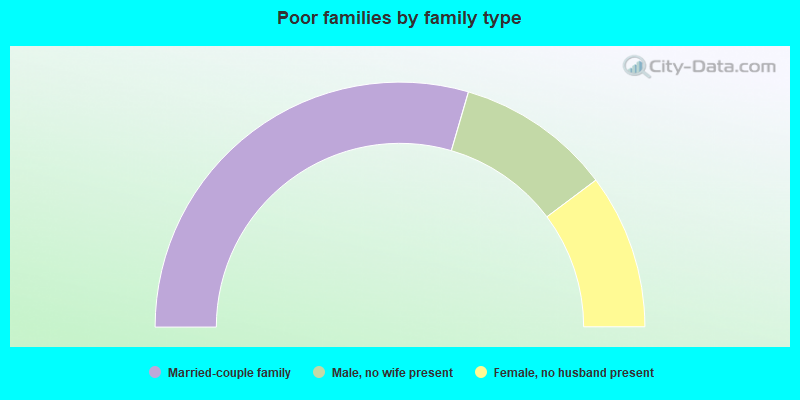
- 59.1%Married-couple family
- 20.5%Male, no wife present
- 20.5%Female, no husband present
Other data
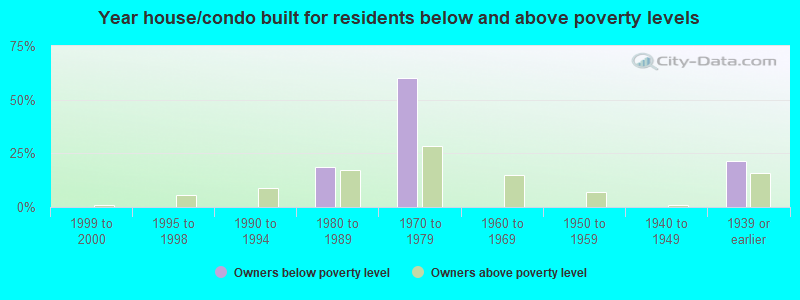
- Owners below poverty level
- 0.0%1999 to 2000
- 0.0%1995 to 1998
- 0.0%1990 to 1994
- 18.5%1980 to 1989
- 60.0%1970 to 1979
- 0.0%1960 to 1969
- 0.0%1950 to 1959
- 0.0%1940 to 1949
- 21.5%1939 or earlier
- Owners above poverty level
- 0.8%1999 to 2000
- 5.7%1995 to 1998
- 8.7%1990 to 1994
- 17.5%1980 to 1989
- 28.3%1970 to 1979
- 14.8%1960 to 1969
- 7.1%1950 to 1959
- 1.0%1940 to 1949
- 16.0%1939 or earlier