Stratham, New Hampshire (NH) Poverty Rate Data
Information about poor and low-income residents

Recent posts about poverty in Stratham, New Hampshire on our local forum with over 2,400,000 registered users:
 | NH Drug Testing Bill for Healthcare Workers (51 replies) |
| Move to NH - Suggested Areas & Towns? (108 replies) |
| Moving to southeast NH help!!! (48 replies) |
| Best safe towns for commute to Portsmouth NH (34 replies) |
| Moving to southeast NH, looking for suggestions (22 replies) |
| Moving to Peterborough..from Kauai (42 replies) |
1.4% of Stratham, NH residents had an income below the poverty level in 2022, which was 434.1% less than the poverty level of 7.2% across the entire state of New Hampshire. Taking into account residents not living in families, 3.4% of high school graduates and 17.3% of non high school graduates live in poverty. The poverty rate was 0.0% among disabled males and 0.0% among disabled females.
Poverty rates in Stratham, NH
Residents with income below the poverty level in 2022:
Residents with income below 50% of the poverty level in 2022:
Poverty rate among disabled males:
Poverty rate among disabled females:
| Stratham: | 1.4% |
| Whole state: | 7.2% |
| Stratham: | 0.3% |
| Whole state: | 3.5% |
Poverty rate among disabled males:
| Stratham: | 0.0% |
| New Hampshire: | 9.6% |
Poverty rate among disabled females:
| Stratham: | 0.0% |
| New Hampshire: | 14.1% |
Poverty by age in Stratham, NH
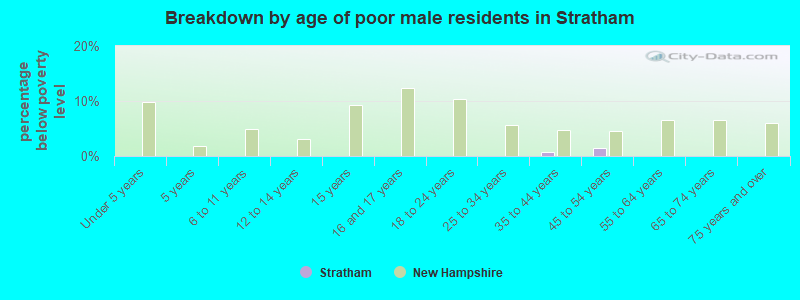
- Breakdown by age of poor male residents in Stratham,NH (percentage below poverty level)
- 0.0%Under 5 years
- 0.0%5 years
- 0.0%6 to 11 years
- 0.0%12 to 14 years
- 0.0%15 years
- 0.0%16 and 17 years
- 0.0%18 to 24 years
- 0.0%25 to 34 years
- 0.8%35 to 44 years
- 1.5%45 to 54 years
- 0.0%55 to 64 years
- 0.0%65 to 74 years
- 0.0%75 years and over
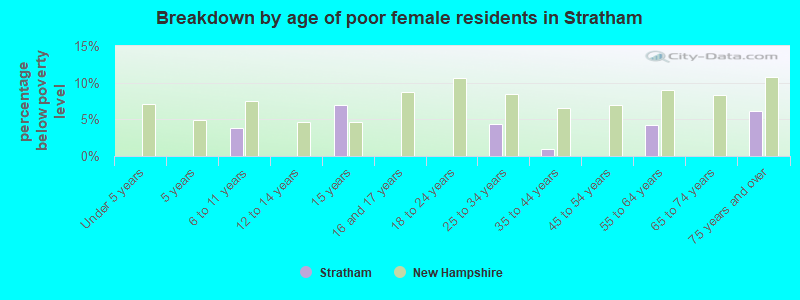
- Breakdown by age of poor female residents in Stratham,NH (percentage below poverty level)
- 0.0%Under 5 years
- 0.0%5 years
- 3.8%6 to 11 years
- 0.0%12 to 14 years
- 6.9%15 years
- 0.0%16 and 17 years
- 0.0%18 to 24 years
- 4.4%25 to 34 years
- 1.0%35 to 44 years
- 0.0%45 to 54 years
- 4.2%55 to 64 years
- 0.0%65 to 74 years
- 6.1%75 years and over
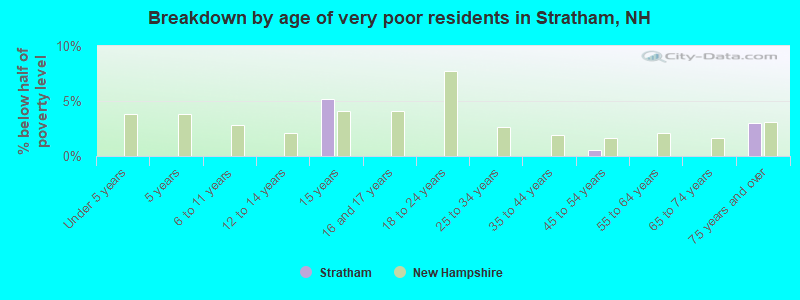
- Breakdown by age of very poor residents in Stratham,NH (% below half of poverty level)
- 0.0%Under 5 years
- 0.0%5 years
- 0.0%6 to 11 years
- 0.0%12 to 14 years
- 5.2%15 years
- 0.0%16 and 17 years
- 0.0%18 to 24 years
- 0.0%25 to 34 years
- 0.0%35 to 44 years
- 0.5%45 to 54 years
- 0.0%55 to 64 years
- 0.0%65 to 74 years
- 3.0%75 years and over
Poverty by race and place of birth in Stratham, NH
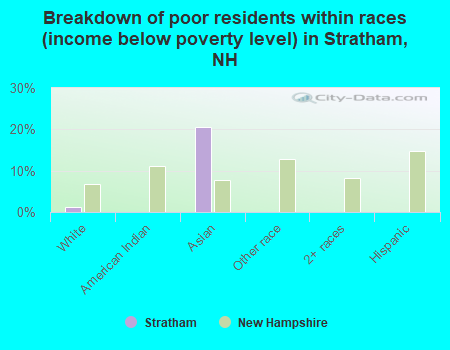
- Breakdown of poor residents within races in Stratham, NH (%)
- 1.2%White
- 0.0%American Indian
- 20.5%Asian
- 0.0%Other race
- 0.0%2+ races
- 0.0%Hispanic
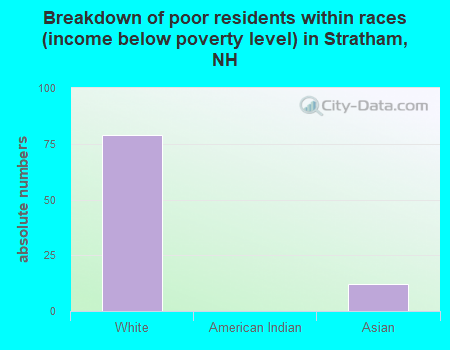
- Breakdown of poor residents within races in Stratham, NH (absolute numbers)
- 79White
- 0American Indian
- 12Asian
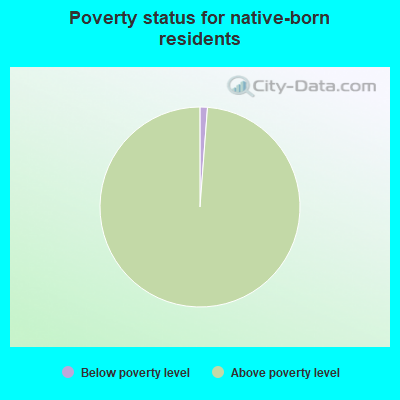
- 1.2%Below poverty level
- 98.8%Above poverty level
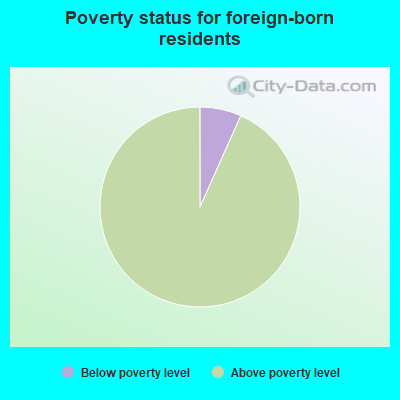
- 6.7%Below poverty level
- 93.3%Above poverty level
Poverty in families in Stratham, NH
Children below poverty level:
| Stratham, New Hampshire: | 0.9% |
| State: | 6.3% |
Poverty rate among high school graduates not in families:
| Stratham: | 3.4% |
| New Hampshire: | 13.3% |
Poverty rate among people who did not graduate high school not in families:
| Stratham: | 17.3% |
| New Hampshire: | 32.2% |
Other data
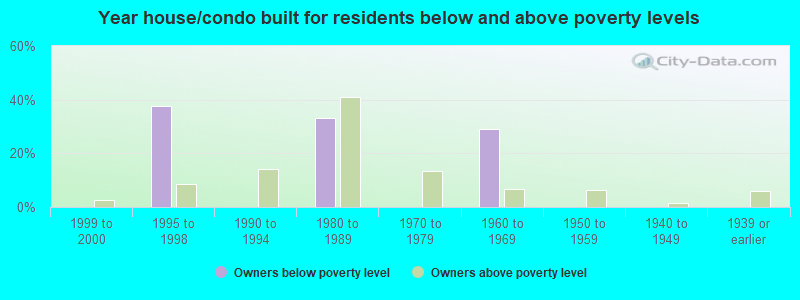
- Owners below poverty level
- 0.0%1999 to 2000
- 37.5%1995 to 1998
- 0.0%1990 to 1994
- 33.3%1980 to 1989
- 0.0%1970 to 1979
- 29.2%1960 to 1969
- 0.0%1950 to 1959
- 0.0%1940 to 1949
- 0.0%1939 or earlier
- Owners above poverty level
- 2.8%1999 to 2000
- 8.4%1995 to 1998
- 14.2%1990 to 1994
- 40.8%1980 to 1989
- 13.3%1970 to 1979
- 6.6%1960 to 1969
- 6.4%1950 to 1959
- 1.4%1940 to 1949
- 6.0%1939 or earlier