Races in Abbeville, Louisiana (LA) Detailed Stats
Data:
Races - White alone (%)
Races - White alone (% change since 2000)
Races - Black alone (%)
Races - Black alone (% change since 2000)
Races - American Indian alone (%)
Races - American Indian alone (% change since 2000)
Races - Asian alone (%)
Races - Asian alone (% change since 2000)
Races - Hispanic (%)
Races - Hispanic (% change since 2000)
Races - Native Hawaiian and Other Pacific Islander alone (%)
Races - Native Hawaiian and Other Pacific Islander alone (% change since 2000)
Races - Two or more races(%)
Races - Two or more races(% change since 2000)
Races - Other race alone (%)
Races - Other race alone (% change since 2000)
Racial diversity
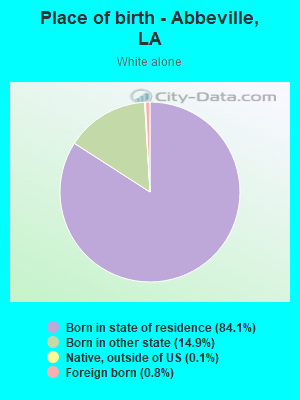
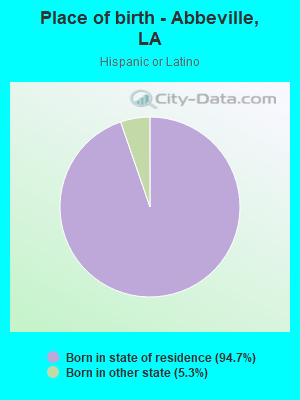
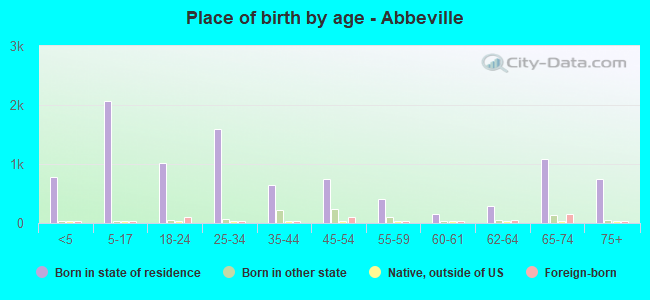
Place of birth - Born in state of residence (%)
Place of birth - Born in state of residence (%) - White
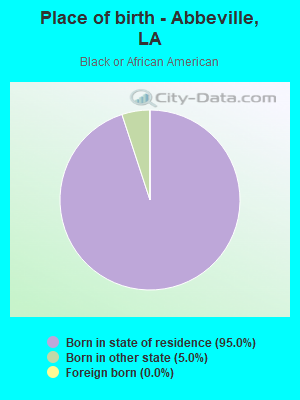
Place of birth - Born in state of residence (%) - Black or African American
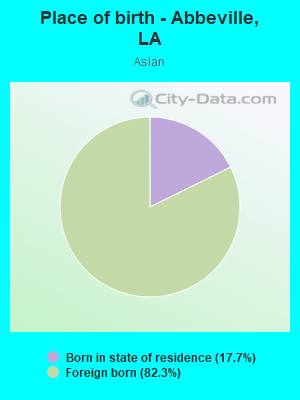
Place of birth - Born in state of residence (%) - Asian
Place of birth - Born in state of residence (%) - Hispanic or Latino
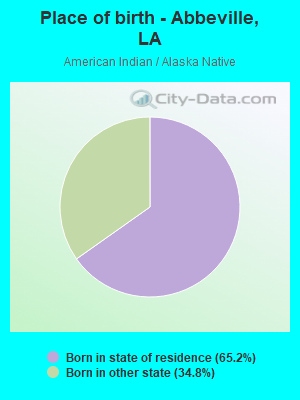
Place of birth - Born in state of residence (%) - American Indian and Alaska Native
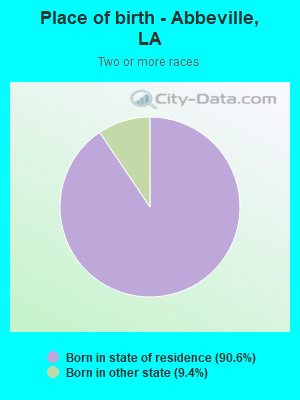
Place of birth - Born in state of residence (%) - Multirace
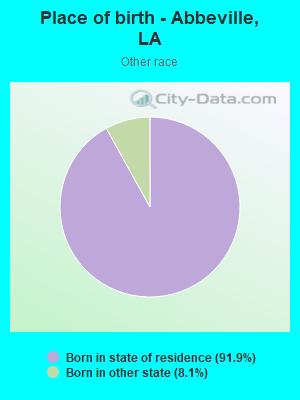
Place of birth - Born in state of residence (%) - Other Race
Place of birth - Born in other state (%)
Place of birth - Born in other state (%) - White
Place of birth - Born in other state (%) - Black or African American
Place of birth - Born in other state (%) - Asian
Place of birth - Born in other state (%) - Hispanic or Latino
Place of birth - Born in other state (%) - American Indian and Alaska Native
Place of birth - Born in other state (%) - Multirace
Place of birth - Born in other state (%) - Other Race
Place of birth - Native, outside of US (%)
Place of birth - Native, outside of US (%) - White
Place of birth - Native, outside of US (%) - Black or African American
Place of birth - Native, outside of US (%) - Asian
Place of birth - Native, outside of US (%) - Hispanic or Latino
Place of birth - Native, outside of US (%) - American Indian and Alaska Native
Place of birth - Native, outside of US (%) - Multirace
Place of birth - Native, outside of US (%) - Other Race
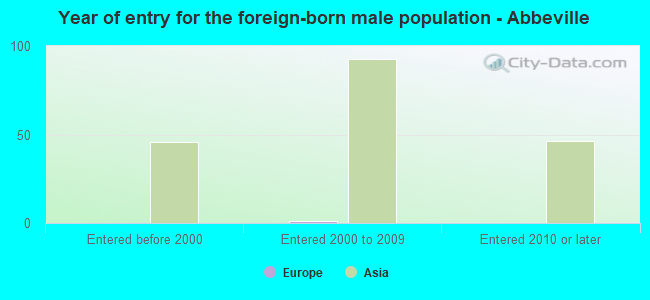
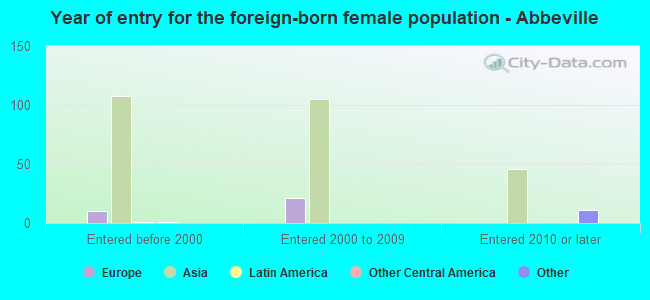
Place of birth - Foreign born (%)
Place of birth - Foreign born (%) - White
Place of birth - Foreign born (%) - Black or African American
Place of birth - Foreign born (%) - Asian
Place of birth - Foreign born (%) - Hispanic or Latino
Place of birth - Foreign born (%) - American Indian and Alaska Native
Place of birth - Foreign born (%) - Multirace
Place of birth - Foreign born (%) - Other Race
Residents speaking English at home (%)
Residents speaking English at home - Born in the United States (%)
Residents speaking English at home - Native, born elsewhere (%)
Residents speaking English at home - Foreign born (%)
Residents speaking Spanish at home (%)
Residents speaking Spanish at home - Born in the United States (%)
Residents speaking Spanish at home - Native, born elsewhere (%)
Residents speaking Spanish at home - Foreign born (%)
Residents speaking other language at home (%)
Residents speaking other language at home - Born in the United States (%)
Residents speaking other language at home - Native, born elsewhere (%)
Residents speaking other language at home - Foreign born (%)
Marital status - Never married (%)
Marital status - Now married (%)
Marital status - Separated (%)
Marital status - Widowed (%)
Marital status - Divorced (%)
Ancestries Reported - Arab (%)
Ancestries Reported - Czech (%)
Ancestries Reported - Danish (%)
Ancestries Reported - Dutch (%)
Ancestries Reported - English (%)
Ancestries Reported - French (%)
Ancestries Reported - French Canadian (%)
Ancestries Reported - German (%)
Ancestries Reported - Greek (%)
Ancestries Reported - Hungarian (%)
Ancestries Reported - Irish (%)
Ancestries Reported - Italian (%)
Ancestries Reported - Lithuanian (%)
Ancestries Reported - Norwegian (%)
Ancestries Reported - Polish (%)
Ancestries Reported - Portuguese (%)
Ancestries Reported - Russian (%)
Ancestries Reported - Scotch-Irish (%)
Ancestries Reported - Scottish (%)
Ancestries Reported - Slovak (%)
Ancestries Reported - Subsaharan African (%)
Ancestries Reported - Swedish (%)
Ancestries Reported - Swiss (%)
Ancestries Reported - Ukrainian (%)
Ancestries Reported - United States (%)
Ancestries Reported - Welsh (%)
Ancestries Reported - West Indian (%)
Ancestries Reported - Other (%)
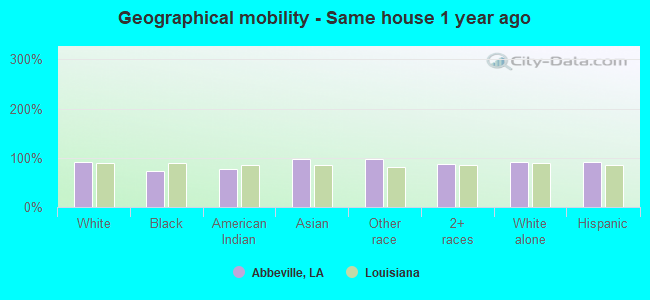
Geographical mobility - Same house 1 year ago (%)
Geographical mobility - Same house 1 year ago (%) - White
Geographical mobility - Same house 1 year ago (%) - Black or African American
Geographical mobility - Same house 1 year ago (%) - Asian
Geographical mobility - Same house 1 year ago (%) - Hispanic or Latino
Geographical mobility - Same house 1 year ago (%) - American Indian and Alaska Native
Geographical mobility - Same house 1 year ago (%) - Multirace
Geographical mobility - Same house 1 year ago (%) - Other Race
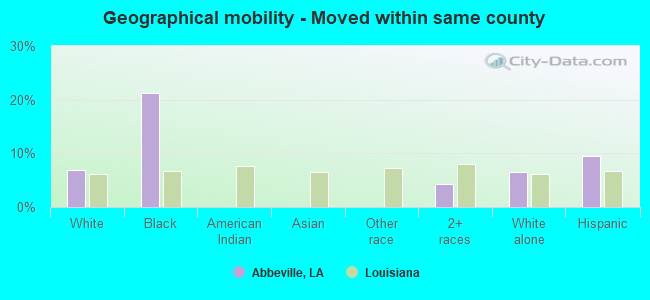
Geographical mobility - Moved within same county (%)
Geographical mobility - Moved within same county (%) - White
Geographical mobility - Moved within same county (%) - Black or African American
Geographical mobility - Moved within same county (%) - Asian
Geographical mobility - Moved within same county (%) - Hispanic or Latino
Geographical mobility - Moved within same county (%) - American Indian and Alaska Native
Geographical mobility - Moved within same county (%) - Multirace
Geographical mobility - Moved within same county (%) - Other Race
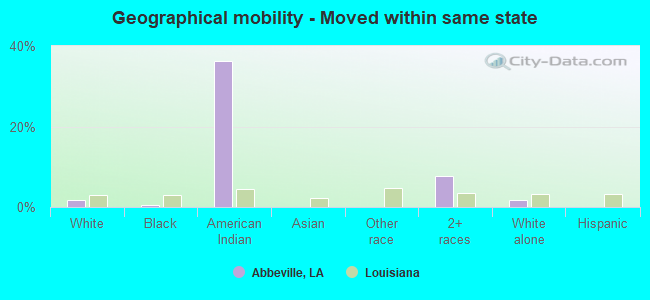
Geographical mobility - Moved from different county within same state (%)
Geographical mobility - Moved from different county within same state (%) - White
Geographical mobility - Moved from different county within same state (%) - Black or African American
Geographical mobility - Moved from different county within same state (%) - Asian
Geographical mobility - Moved from different county within same state (%) - Hispanic or Latino
Geographical mobility - Moved from different county within same state (%) - American Indian and Alaska Native
Geographical mobility - Moved from different county within same state (%) - Multirace
Geographical mobility - Moved from different county within same state (%) - Other Race
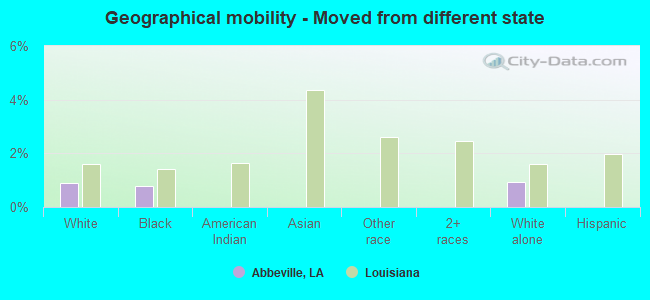
Geographical mobility - Moved from different state (%)
Geographical mobility - Moved from different state (%) - White
Geographical mobility - Moved from different state (%) - Black or African American
Geographical mobility - Moved from different state (%) - Asian
Geographical mobility - Moved from different state (%) - Hispanic or Latino
Geographical mobility - Moved from different state (%) - American Indian and Alaska Native
Geographical mobility - Moved from different state (%) - Multirace
Geographical mobility - Moved from different state (%) - Other Race
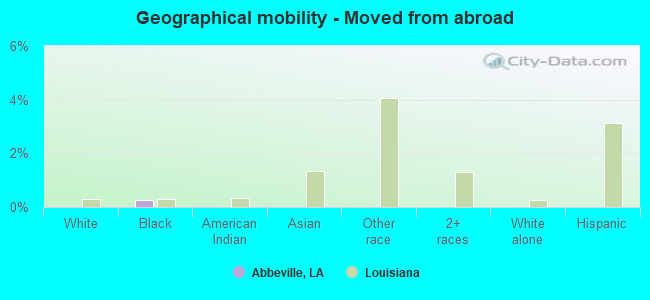
Geographical mobility - Moved from abroad (%)
Geographical mobility - Moved from abroad (%) - White
Geographical mobility - Moved from abroad (%) - Black or African American
Geographical mobility - Moved from abroad (%) - Asian
Geographical mobility - Moved from abroad (%) - Hispanic or Latino
Geographical mobility - Moved from abroad (%) - American Indian and Alaska Native
Geographical mobility - Moved from abroad (%) - Multirace
Geographical mobility - Moved from abroad (%) - Other Race
Place of birth for the foreign-born population - Ireland (%)
Place of birth for the foreign-born population - Denmark (%)
Place of birth for the foreign-born population - Norway (%)
Place of birth for the foreign-born population - Sweden (%)
Place of birth for the foreign-born population - United Kingdom (%)
Place of birth for the foreign-born population - England (%)
Place of birth for the foreign-born population - Scotland (%)
Place of birth for the foreign-born population - Other Northern Europe (%)
Place of birth for the foreign-born population - Austria (%)
Place of birth for the foreign-born population - Belgium (%)
Place of birth for the foreign-born population - France (%)
Place of birth for the foreign-born population - Germany (%)
Place of birth for the foreign-born population - Netherlands (%)
Place of birth for the foreign-born population - Switzerland (%)
Place of birth for the foreign-born population - Other Western Europe (%)
Place of birth for the foreign-born population - Greece (%)
Place of birth for the foreign-born population - Italy (%)
Place of birth for the foreign-born population - Portugal (%)
Place of birth for the foreign-born population - Spain (%)
Place of birth for the foreign-born population - Other Southern Europe (%)
Place of birth for the foreign-born population - Albania (%)
Place of birth for the foreign-born population - Belarus (%)
Place of birth for the foreign-born population - Bosnia and Herzegovina (%)
Place of birth for the foreign-born population - Bulgaria (%)
Place of birth for the foreign-born population - Croatia (%)
Place of birth for the foreign-born population - Czechoslovakia (%)
Place of birth for the foreign-born population - Hungary (%)
Place of birth for the foreign-born population - Latvia (%)
Place of birth for the foreign-born population - Lithuania (%)
Place of birth for the foreign-born population - North Macedonia (Macedonia) (%)
Place of birth for the foreign-born population - Moldova (%)
Place of birth for the foreign-born population - Poland (%)
Place of birth for the foreign-born population - Romania (%)
Place of birth for the foreign-born population - Russia (%)
Place of birth for the foreign-born population - Serbia (%)
Place of birth for the foreign-born population - Ukraine (%)
Place of birth for the foreign-born population - Other Eastern Europe (%)
Place of birth for the foreign-born population - China (%)
Place of birth for the foreign-born population - Hong Kong (%)
Place of birth for the foreign-born population - Taiwan (%)
Place of birth for the foreign-born population - Japan (%)
Place of birth for the foreign-born population - Korea (%)
Place of birth for the foreign-born population - Other Eastern Asia (%)
Place of birth for the foreign-born population - Afghanistan (%)
Place of birth for the foreign-born population - Bangladesh (%)
Place of birth for the foreign-born population - India (%)
Place of birth for the foreign-born population - Iran (%)
Place of birth for the foreign-born population - Kazakhstan (%)
Place of birth for the foreign-born population - Nepal (%)
Place of birth for the foreign-born population - Pakistan (%)
Place of birth for the foreign-born population - Sri Lanka (%)
Place of birth for the foreign-born population - Uzbekistan (%)
Place of birth for the foreign-born population - Other South Central Asia (%)
Place of birth for the foreign-born population - Burma (%)
Place of birth for the foreign-born population - Cambodia (%)
Place of birth for the foreign-born population - Indonesia (%)
Place of birth for the foreign-born population - Laos (%)
Place of birth for the foreign-born population - Malaysia (%)
Place of birth for the foreign-born population - Philippines (%)
Place of birth for the foreign-born population - Singapore (%)
Place of birth for the foreign-born population - Thailand (%)
Place of birth for the foreign-born population - Vietnam (%)
Place of birth for the foreign-born population - Other South Eastern Asia (%)
Place of birth for the foreign-born population - Armenia (%)
Place of birth for the foreign-born population - Iraq (%)
Place of birth for the foreign-born population - Israel (%)
Place of birth for the foreign-born population - Jordan (%)
Place of birth for the foreign-born population - Kuwait (%)
Place of birth for the foreign-born population - Lebanon (%)
Place of birth for the foreign-born population - Saudi Arabia (%)
Place of birth for the foreign-born population - Syria (%)
Place of birth for the foreign-born population - Turkey (%)
Place of birth for the foreign-born population - Yemen (%)
Place of birth for the foreign-born population - Other Western Asia (%)
Place of birth for the foreign-born population - Eritrea (%)
Place of birth for the foreign-born population - Ethiopia (%)
Place of birth for the foreign-born population - Kenya (%)
Place of birth for the foreign-born population - Somalia (%)
Place of birth for the foreign-born population - Uganda (%)
Place of birth for the foreign-born population - Zimbabwe (%)
Place of birth for the foreign-born population - Other Eastern Africa (%)
Place of birth for the foreign-born population - Cameroon (%)
Place of birth for the foreign-born population - Congo (%)
Place of birth for the foreign-born population - Democratic Republic of Congo (Zaire) (%)
Place of birth for the foreign-born population - Other Middle Africa (%)
Place of birth for the foreign-born population - Egypt (%)
Place of birth for the foreign-born population - Morocco (%)
Place of birth for the foreign-born population - Sudan (%)
Place of birth for the foreign-born population - Other Northern Africa (%)
Place of birth for the foreign-born population - South Africa (%)
Place of birth for the foreign-born population - Other Southern Africa (%)
Place of birth for the foreign-born population - Cabo Verde (%)
Place of birth for the foreign-born population - Ghana (%)
Place of birth for the foreign-born population - Liberia (%)
Place of birth for the foreign-born population - Nigeria (%)
Place of birth for the foreign-born population - Senegal (%)
Place of birth for the foreign-born population - Sierra Leone (%)
Place of birth for the foreign-born population - Other Western Africa (%)
Place of birth for the foreign-born population - Australia (%)
Place of birth for the foreign-born population - New Zealand (%)
Place of birth for the foreign-born population - Fiji (%)
Place of birth for the foreign-born population - Micronesia (%)
Place of birth for the foreign-born population - Bahamas (%)
Place of birth for the foreign-born population - Barbados (%)
Place of birth for the foreign-born population - Cuba (%)
Place of birth for the foreign-born population - Dominica (%)
Place of birth for the foreign-born population - Dominican Republic (%)
Place of birth for the foreign-born population - Grenada (%)
Place of birth for the foreign-born population - Haiti (%)
Place of birth for the foreign-born population - Jamaica (%)
Place of birth for the foreign-born population - St. Vincent and the Grenadines (%)
Place of birth for the foreign-born population - Trinidad and Tobago (%)
Place of birth for the foreign-born population - West Indies (%)
Place of birth for the foreign-born population - Other Caribbean (%)
Place of birth for the foreign-born population - Belize (%)
Place of birth for the foreign-born population - Costa Rica (%)
Place of birth for the foreign-born population - El Salvador (%)
Place of birth for the foreign-born population - Guatemala (%)
Place of birth for the foreign-born population - Honduras (%)
Place of birth for the foreign-born population - Mexico (%)
Place of birth for the foreign-born population - Nicaragua (%)
Place of birth for the foreign-born population - Panama (%)
Place of birth for the foreign-born population - Other Central America (%)
Place of birth for the foreign-born population - Argentina (%)
Place of birth for the foreign-born population - Bolivia (%)
Place of birth for the foreign-born population - Brazil (%)
Place of birth for the foreign-born population - Chile (%)
Place of birth for the foreign-born population - Colombia (%)
Place of birth for the foreign-born population - Ecuador (%)
Place of birth for the foreign-born population - Guyana (%)
Place of birth for the foreign-born population - Peru (%)
Place of birth for the foreign-born population - Uruguay (%)
Place of birth for the foreign-born population - Venezuela (%)
Place of birth for the foreign-born population - Other South America (%)
Place of birth for the foreign-born population - Canada (%)
Place of birth for the foreign-born population - Other Northern America (%)
Place of birth for the foreign-born population - Other (%)
Latest news about races in Abbeville, LA collected exclusively by city-data.com from local newspapers, TV, and radio stations
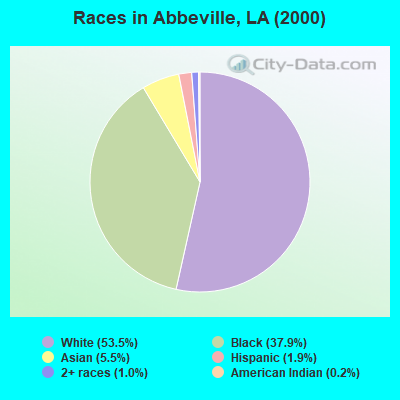
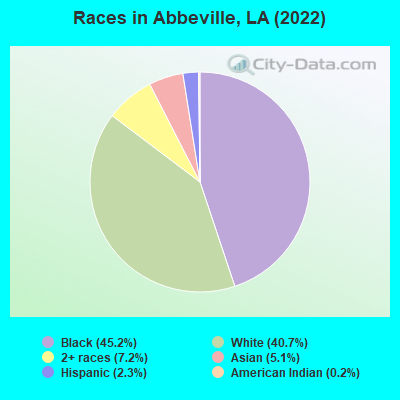
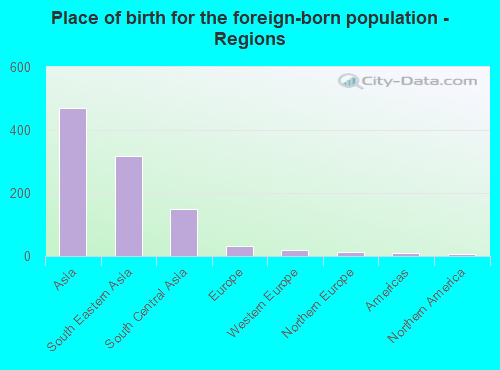
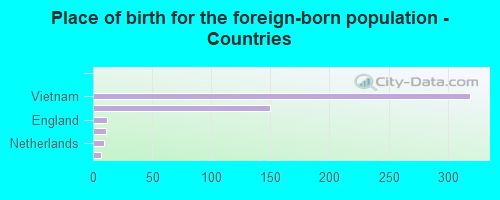
According to 2022 data, the most numerous races in Abbeville, LA are White alone (4,517 residents), Black alone (5,017 residents), and Hispanic (252 residents). 89.1% of Abbeville residents speak English at home. 4.6% of Abbeville, LA residents are foreign-born (4.1% born in Asia), which is 7.0% greater than the foreign-born rate of 4.3% across the entire state of Louisiana.
Race distribution in Abbeville
2000 2022
2,794,391 62.5% White alone 1,443,390 32.3% Black alone 107,738 2.4% Hispanic 54,256 1.2% Asian alone 39,260 0.9% Two or more races 24,129 0.5% American Indian alone 4,736 0.1% Other race alone 1,076 0.02% Native Hawaiian and Other
2,603,221 56.7% White alone 1,420,055 30.9% Black alone 262,213 5.7% Hispanic 183,270 4.0% Two or more races 81,169 1.8% Asian alone 19,991 0.4% American Indian alone 18,043 0.4% Other race alone 2,279 0.05% Native Hawaiian and Other
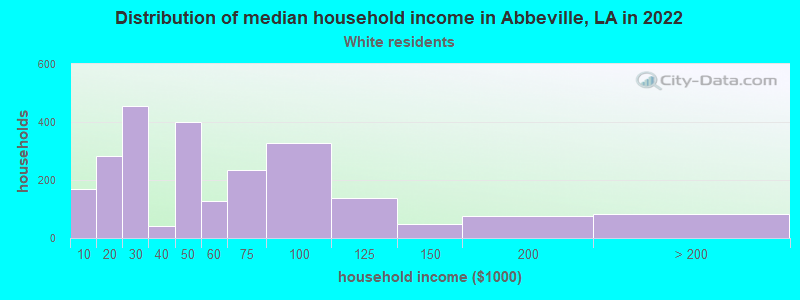
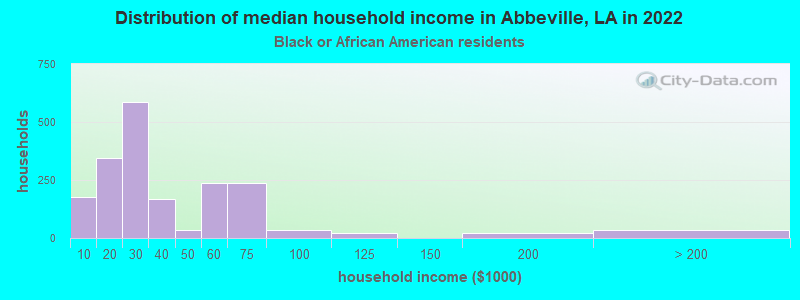
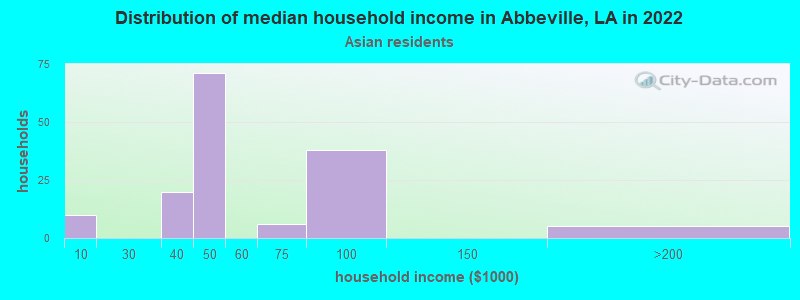
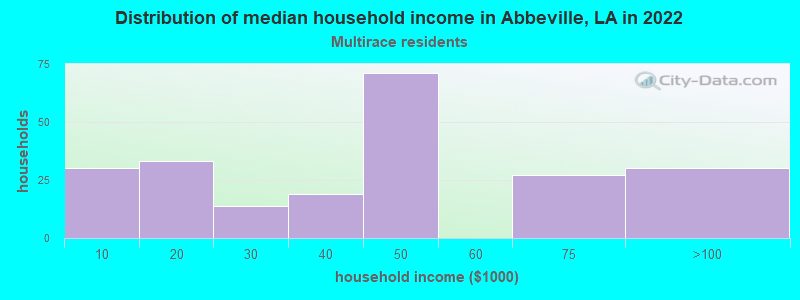
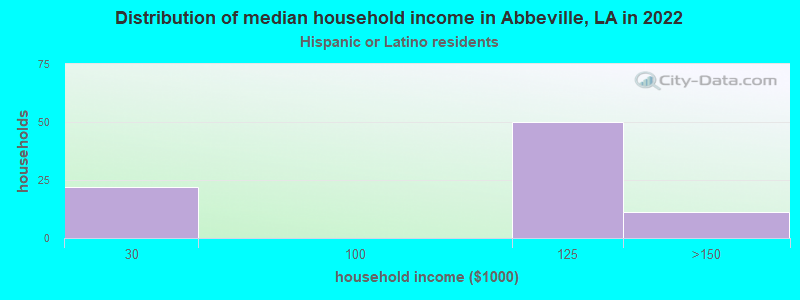
Income and house value in Abbeville Median household income in 2022 $44,251 White non-Hispanic householders$23,334 Black householders$38,425 Asian householders$47,222 Two or more races householders$111,474 Hispanic or Latino race householdersMedian 2022 house value $125,343 White Non-Hispanic householders$91,748 Black or African American householders $147,347 Asian householders$37,327 Two or more races householders$96,856 Hispanic or Latino householders
Median age by race in Abbeville
51.1 Median age for White residents49.8 51.7 29.1 Median age for Black or African American residents30.1 28.6 68.8 Median age for American Indian / Alaska Native residents-739,906,102.5 -781,341,107.1 51.8 Median age for Asian residents27.3 54.0 -821,138,210.6 Median age for Native Hawaiian / Pacific Islander residents-868,167,201.7 -599,999,999.4 20.0 Median age for Other race residents18.5 -731,762,064.4 14.5 Median age for Two or more races residents12.2 15.1 50.9 Median age for White alone residents49.2 51.8 30.9 Median age for Hispanic or Latino residents18.6 42.9
Owner/renter occupied households by race in Abbeville
House owners and renters - White residents 1,546 66.3% Owner occupied784 33.7% Renter occupiedHouse owners and renters - Black or African American residents 742 38.7% Owner occupied1,175 61.3% Renter occupiedHouse owners and renters - American Indian / Alaska Native residents 8 100.0% Owner occupiedHouse owners and renters - Asian residents 159 96.8% Owner occupied5 3.2% Renter occupiedHouse owners and renters - Other race residents 12 100.0% Renter occupiedHouse owners and renters - Two or more races residents 66 30.2% Owner occupied152 69.8% Renter occupiedHouse owners and renters - White alone residents 1,483 64.6% Owner occupied814 35.4% Renter occupiedHouse owners and renters - Hispanic or Latino residents 84 89.1% Owner occupied10 10.9% Renter occupied
Language usage in Abbeville
English speakers - Total 89.1% of residents of Abbeville speak English at home.
0.6% of residents speak Spanish at home 58 95.1% Speak English very well3 4.9% Speak English less than very well10.5% of residents speak other language at home 701 64.7% Speak English very well382 35.3% Speak English less than very well
English speakers - Born in the United States 99.0% of residents of Abbeville speak English at home.
0.3% of residents speak Spanish at home 3 100.0% Speak English less than very well0.6% of residents speak other language at home 6 100.0% Speak English very well
All residents speak only English at home
English speakers - Foreign-born 3.3% of residents of Abbeville speak English at home.
100.6% of residents speak other language at home 209 42.2% Speak English very well286 57.8% Speak English less than very well
White (Caucasian) - Speak only English Native:
89.4% (3,935)Foreign-born:
62.9% (16)
White (Caucasian) - Speak another language Native:
9.6% (425)Foreign-born:
46.8% (12)
Black or African American - Speak another language Native:
0.8% (35)Foreign-born:
100.0% (1)
Asian - Speak another language Native:
88.6% (95)Foreign-born:
100.0% (462)
White alone - Speak only English Native:
89.9% (3,894)Foreign-born:
47.7% (17)
White alone - Speak another language Native:
9.8% (425)Foreign-born:
52.4% (19)
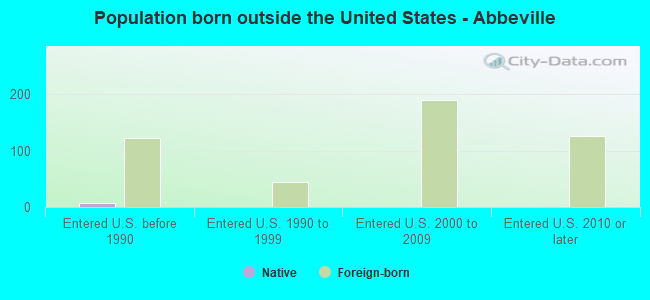
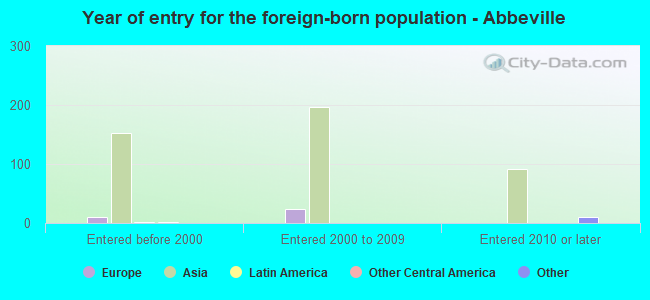
Foreign-born residents in Abbeville 511 residents are foreign born (4.1% Asia ).
This city:
4.6%Louisiana:
4.2%
Marital status for residents in Abbeville Marital status - White (Caucasian) population 15 years and over
Males 34.0% Never married41.9% Now married1.5% Separated3.4% Widowed19.1% DivorcedFemales 30.1% Never married33.3% Now married0.8% Separated17.2% Widowed18.5% DivorcedWomen who gave birth in the past 12 months Now married:
100.0% (144)Unmarried:
0.0% (0)
Women who did not give birth in the past 12 months Now married:
36.4% (330)Unmarried:
63.6% (578)
Marital status - Black or African American population 15 years and over
Males 40.8% Never married41.0% Now married12.3% Separated0.8% Widowed5.2% DivorcedFemales 58.3% Never married14.9% Now married5.3% Separated8.4% Widowed13.1% DivorcedWomen who gave birth in the past 12 months Now married:
28.7% (66)Unmarried:
71.3% (165)
Women who did not give birth in the past 12 months Now married:
14.2% (189)Unmarried:
85.8% (1,145)
Marital status - American Indian / Alaska Native population 15 years and over
Males 0.0% Never married100.0% Now married0.0% Separated0.0% Widowed0.0% DivorcedFemales 0.0% Never married0.0% Now married0.0% Separated100.0% Widowed0.0% DivorcedMarital status - Asian population 15 years and over
Males 56.0% Never married44.0% Now married0.0% Separated0.0% Widowed0.0% DivorcedFemales 13.6% Never married60.6% Now married0.0% Separated20.1% Widowed5.7% DivorcedWomen who did not give birth in the past 12 months Now married:
27.4% (33)Unmarried:
72.6% (88)
Marital status - Other race population 15 years and over
Males 76.0% Never married24.0% Now married0.0% Separated0.0% Widowed0.0% DivorcedFemales 0.0% Never married73.3% Now married0.0% Separated0.0% Widowed26.7% DivorcedWomen who did not give birth in the past 12 months Now married:
100.0% (12)Unmarried:
0.0% (0)
Marital status - Two or more races population 15 years and over
Males 51.9% Never married0.0% Now married0.0% Separated0.0% Widowed48.1% DivorcedFemales 73.1% Never married6.6% Now married9.3% Separated11.0% Widowed0.0% DivorcedWomen who did not give birth in the past 12 months Now married:
12.9% (24)Unmarried:
87.1% (160)
Marital status - White alone, not Hispanic / Latino population 15 years and over
Males 34.9% Never married43.0% Now married1.6% Separated3.5% Widowed16.9% DivorcedFemales 30.5% Never married33.5% Now married0.8% Separated17.4% Widowed17.7% DivorcedWomen who gave birth in the past 12 months Now married:
100.0% (146)Unmarried:
0.0% (0)
Women who did not give birth in the past 12 months Now married:
36.9% (329)Unmarried:
63.1% (562)
Marital status - Hispanic or Latino population 15 years and over
Males 54.9% Never married17.3% Now married0.0% Separated0.0% Widowed27.7% DivorcedFemales 0.0% Never married37.5% Now married0.0% Separated0.0% Widowed62.5% DivorcedWomen who did not give birth in the past 12 months Now married:
40.9% (18)Unmarried:
59.1% (26)
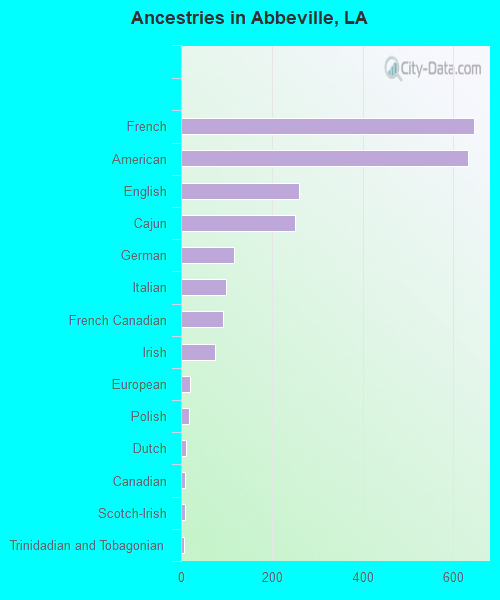
Ancestries in Abbeville
646 9.6% French632 9.4% American259 3.8% English250 3.7% Cajun116 1.7% German99 1.5% Italian92 1.4% French Canadian75 1.1% Irish20 0.3% European17 0.3% Polish10 0.1% Dutch9 0.1% Canadian8 0.1% Scotch-Irish7 0.1% Trinidadian and Tobagonian
Children Nativity (place of birth) in Abbeville
Children under 6 years - Living with two parents Both parents native 313 100.0% NativeChildren under 6 years - Living with one parent Native parent 516 100.0% NativeChildren 6 to 17 years - Living with two parents Both parents native 559 100.0% NativeBoth parents foreign-born 39 71.1% Native16 28.9% Foreign-bornChildren 6 to 17 years - Living with one parent Native parent 1,241 100.0% NativeForeign-born parent 33 50.6% Native33 49.4% Foreign-born
Grandparents responsible for own grandchildren in Abbeville
Grandparents (30 to 59 years) White / Caucasian 23 43.5% Responsible for grandchildren30 56.5% Not responsible for grandchildrenBlack or African American 55 80.5% Responsible for grandchildren13 19.5% Not responsible for grandchildrenWhite alone, not Hispanic / Latino 23 42.9% Responsible for grandchildren31 57.1% Not responsible for grandchildrenGrandparents (60 years and over) White / Caucasian 45 76.4% Responsible for grandchildren14 23.6% Not responsible for grandchildrenBlack or African American 44 100.0% Not responsible for grandchildrenWhite alone, not Hispanic / Latino 46 76.4% Responsible for grandchildren14 23.6% Not responsible for grandchildren