Races in Ada, Oklahoma (OK) Detailed Stats
Data:
Races - White alone (%)
Races - White alone (% change since 2000)
Races - Black alone (%)
Races - Black alone (% change since 2000)
Races - American Indian alone (%)
Races - American Indian alone (% change since 2000)
Races - Asian alone (%)
Races - Asian alone (% change since 2000)
Races - Hispanic (%)
Races - Hispanic (% change since 2000)
Races - Native Hawaiian and Other Pacific Islander alone (%)
Races - Native Hawaiian and Other Pacific Islander alone (% change since 2000)
Races - Two or more races(%)
Races - Two or more races(% change since 2000)
Races - Other race alone (%)
Races - Other race alone (% change since 2000)
Racial diversity
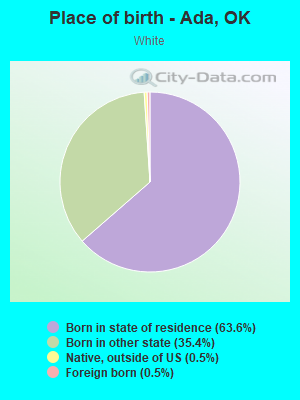
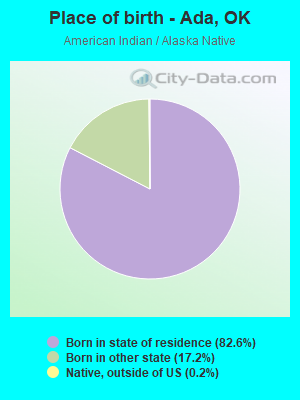
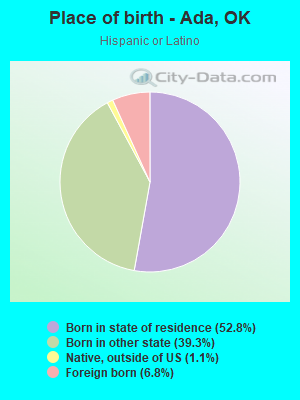
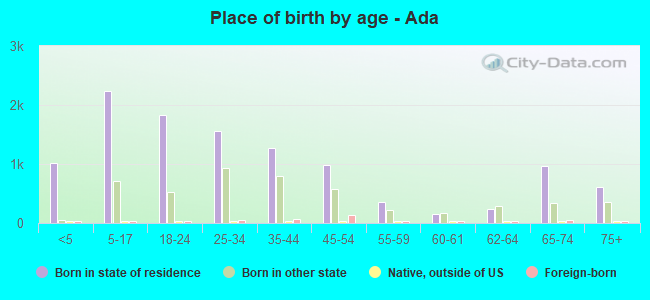
Place of birth - Born in state of residence (%)
Place of birth - Born in state of residence (%) - White
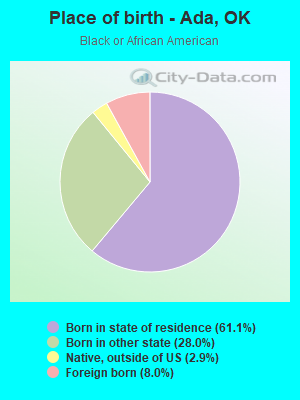
Place of birth - Born in state of residence (%) - Black or African American
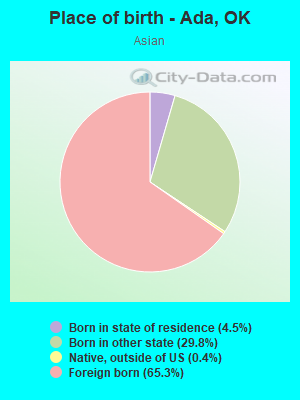
Place of birth - Born in state of residence (%) - Asian
Place of birth - Born in state of residence (%) - Hispanic or Latino
Place of birth - Born in state of residence (%) - American Indian and Alaska Native
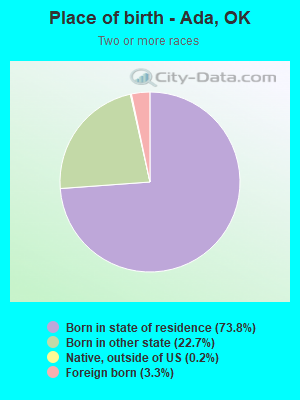
Place of birth - Born in state of residence (%) - Multirace
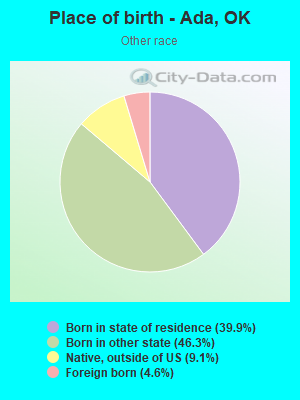
Place of birth - Born in state of residence (%) - Other Race
Place of birth - Born in other state (%)
Place of birth - Born in other state (%) - White
Place of birth - Born in other state (%) - Black or African American
Place of birth - Born in other state (%) - Asian
Place of birth - Born in other state (%) - Hispanic or Latino
Place of birth - Born in other state (%) - American Indian and Alaska Native
Place of birth - Born in other state (%) - Multirace
Place of birth - Born in other state (%) - Other Race
Place of birth - Native, outside of US (%)
Place of birth - Native, outside of US (%) - White
Place of birth - Native, outside of US (%) - Black or African American
Place of birth - Native, outside of US (%) - Asian
Place of birth - Native, outside of US (%) - Hispanic or Latino
Place of birth - Native, outside of US (%) - American Indian and Alaska Native
Place of birth - Native, outside of US (%) - Multirace
Place of birth - Native, outside of US (%) - Other Race
Place of birth - Foreign born (%)
Place of birth - Foreign born (%) - White
Place of birth - Foreign born (%) - Black or African American
Place of birth - Foreign born (%) - Asian
Place of birth - Foreign born (%) - Hispanic or Latino
Place of birth - Foreign born (%) - American Indian and Alaska Native
Place of birth - Foreign born (%) - Multirace
Place of birth - Foreign born (%) - Other Race
Residents speaking English at home (%)
Residents speaking English at home - Born in the United States (%)
Residents speaking English at home - Native, born elsewhere (%)
Residents speaking English at home - Foreign born (%)
Residents speaking Spanish at home (%)
Residents speaking Spanish at home - Born in the United States (%)
Residents speaking Spanish at home - Native, born elsewhere (%)
Residents speaking Spanish at home - Foreign born (%)
Residents speaking other language at home (%)
Residents speaking other language at home - Born in the United States (%)
Residents speaking other language at home - Native, born elsewhere (%)
Residents speaking other language at home - Foreign born (%)
Marital status - Never married (%)
Marital status - Now married (%)
Marital status - Separated (%)
Marital status - Widowed (%)
Marital status - Divorced (%)
Ancestries Reported - Arab (%)
Ancestries Reported - Czech (%)
Ancestries Reported - Danish (%)
Ancestries Reported - Dutch (%)
Ancestries Reported - English (%)
Ancestries Reported - French (%)
Ancestries Reported - French Canadian (%)
Ancestries Reported - German (%)
Ancestries Reported - Greek (%)
Ancestries Reported - Hungarian (%)
Ancestries Reported - Irish (%)
Ancestries Reported - Italian (%)
Ancestries Reported - Lithuanian (%)
Ancestries Reported - Norwegian (%)
Ancestries Reported - Polish (%)
Ancestries Reported - Portuguese (%)
Ancestries Reported - Russian (%)
Ancestries Reported - Scotch-Irish (%)
Ancestries Reported - Scottish (%)
Ancestries Reported - Slovak (%)
Ancestries Reported - Subsaharan African (%)
Ancestries Reported - Swedish (%)
Ancestries Reported - Swiss (%)
Ancestries Reported - Ukrainian (%)
Ancestries Reported - United States (%)
Ancestries Reported - Welsh (%)
Ancestries Reported - West Indian (%)
Ancestries Reported - Other (%)
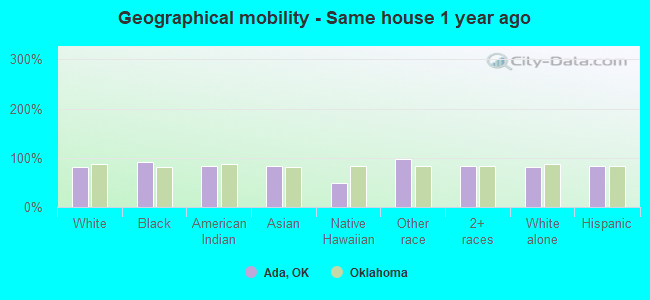
Geographical mobility - Same house 1 year ago (%)
Geographical mobility - Same house 1 year ago (%) - White
Geographical mobility - Same house 1 year ago (%) - Black or African American
Geographical mobility - Same house 1 year ago (%) - Asian
Geographical mobility - Same house 1 year ago (%) - Hispanic or Latino
Geographical mobility - Same house 1 year ago (%) - American Indian and Alaska Native
Geographical mobility - Same house 1 year ago (%) - Multirace
Geographical mobility - Same house 1 year ago (%) - Other Race
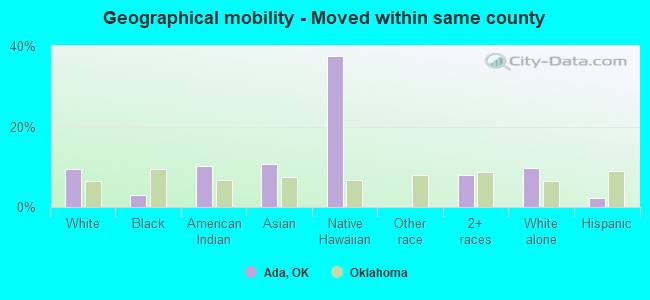
Geographical mobility - Moved within same county (%)
Geographical mobility - Moved within same county (%) - White
Geographical mobility - Moved within same county (%) - Black or African American
Geographical mobility - Moved within same county (%) - Asian
Geographical mobility - Moved within same county (%) - Hispanic or Latino
Geographical mobility - Moved within same county (%) - American Indian and Alaska Native
Geographical mobility - Moved within same county (%) - Multirace
Geographical mobility - Moved within same county (%) - Other Race
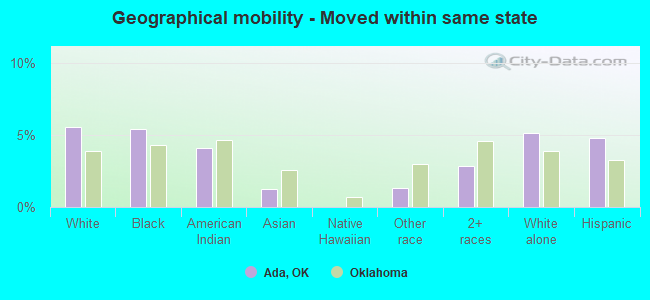
Geographical mobility - Moved from different county within same state (%)
Geographical mobility - Moved from different county within same state (%) - White
Geographical mobility - Moved from different county within same state (%) - Black or African American
Geographical mobility - Moved from different county within same state (%) - Asian
Geographical mobility - Moved from different county within same state (%) - Hispanic or Latino
Geographical mobility - Moved from different county within same state (%) - American Indian and Alaska Native
Geographical mobility - Moved from different county within same state (%) - Multirace
Geographical mobility - Moved from different county within same state (%) - Other Race
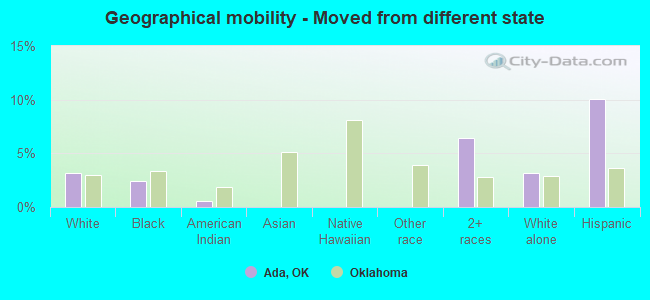
Geographical mobility - Moved from different state (%)
Geographical mobility - Moved from different state (%) - White
Geographical mobility - Moved from different state (%) - Black or African American
Geographical mobility - Moved from different state (%) - Asian
Geographical mobility - Moved from different state (%) - Hispanic or Latino
Geographical mobility - Moved from different state (%) - American Indian and Alaska Native
Geographical mobility - Moved from different state (%) - Multirace
Geographical mobility - Moved from different state (%) - Other Race
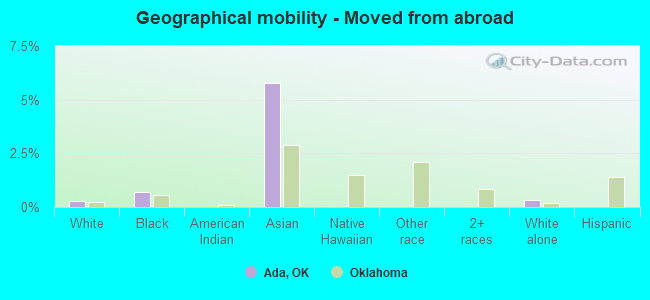
Geographical mobility - Moved from abroad (%)
Geographical mobility - Moved from abroad (%) - White
Geographical mobility - Moved from abroad (%) - Black or African American
Geographical mobility - Moved from abroad (%) - Asian
Geographical mobility - Moved from abroad (%) - Hispanic or Latino
Geographical mobility - Moved from abroad (%) - American Indian and Alaska Native
Geographical mobility - Moved from abroad (%) - Multirace
Geographical mobility - Moved from abroad (%) - Other Race
Place of birth for the foreign-born population - Ireland (%)
Place of birth for the foreign-born population - Denmark (%)
Place of birth for the foreign-born population - Norway (%)
Place of birth for the foreign-born population - Sweden (%)
Place of birth for the foreign-born population - United Kingdom (%)
Place of birth for the foreign-born population - England (%)
Place of birth for the foreign-born population - Scotland (%)
Place of birth for the foreign-born population - Other Northern Europe (%)
Place of birth for the foreign-born population - Austria (%)
Place of birth for the foreign-born population - Belgium (%)
Place of birth for the foreign-born population - France (%)
Place of birth for the foreign-born population - Germany (%)
Place of birth for the foreign-born population - Netherlands (%)
Place of birth for the foreign-born population - Switzerland (%)
Place of birth for the foreign-born population - Other Western Europe (%)
Place of birth for the foreign-born population - Greece (%)
Place of birth for the foreign-born population - Italy (%)
Place of birth for the foreign-born population - Portugal (%)
Place of birth for the foreign-born population - Spain (%)
Place of birth for the foreign-born population - Other Southern Europe (%)
Place of birth for the foreign-born population - Albania (%)
Place of birth for the foreign-born population - Belarus (%)
Place of birth for the foreign-born population - Bosnia and Herzegovina (%)
Place of birth for the foreign-born population - Bulgaria (%)
Place of birth for the foreign-born population - Croatia (%)
Place of birth for the foreign-born population - Czechoslovakia (%)
Place of birth for the foreign-born population - Hungary (%)
Place of birth for the foreign-born population - Latvia (%)
Place of birth for the foreign-born population - Lithuania (%)
Place of birth for the foreign-born population - North Macedonia (Macedonia) (%)
Place of birth for the foreign-born population - Moldova (%)
Place of birth for the foreign-born population - Poland (%)
Place of birth for the foreign-born population - Romania (%)
Place of birth for the foreign-born population - Russia (%)
Place of birth for the foreign-born population - Serbia (%)
Place of birth for the foreign-born population - Ukraine (%)
Place of birth for the foreign-born population - Other Eastern Europe (%)
Place of birth for the foreign-born population - China (%)
Place of birth for the foreign-born population - Hong Kong (%)
Place of birth for the foreign-born population - Taiwan (%)
Place of birth for the foreign-born population - Japan (%)
Place of birth for the foreign-born population - Korea (%)
Place of birth for the foreign-born population - Other Eastern Asia (%)
Place of birth for the foreign-born population - Afghanistan (%)
Place of birth for the foreign-born population - Bangladesh (%)
Place of birth for the foreign-born population - India (%)
Place of birth for the foreign-born population - Iran (%)
Place of birth for the foreign-born population - Kazakhstan (%)
Place of birth for the foreign-born population - Nepal (%)
Place of birth for the foreign-born population - Pakistan (%)
Place of birth for the foreign-born population - Sri Lanka (%)
Place of birth for the foreign-born population - Uzbekistan (%)
Place of birth for the foreign-born population - Other South Central Asia (%)
Place of birth for the foreign-born population - Burma (%)
Place of birth for the foreign-born population - Cambodia (%)
Place of birth for the foreign-born population - Indonesia (%)
Place of birth for the foreign-born population - Laos (%)
Place of birth for the foreign-born population - Malaysia (%)
Place of birth for the foreign-born population - Philippines (%)
Place of birth for the foreign-born population - Singapore (%)
Place of birth for the foreign-born population - Thailand (%)
Place of birth for the foreign-born population - Vietnam (%)
Place of birth for the foreign-born population - Other South Eastern Asia (%)
Place of birth for the foreign-born population - Armenia (%)
Place of birth for the foreign-born population - Iraq (%)
Place of birth for the foreign-born population - Israel (%)
Place of birth for the foreign-born population - Jordan (%)
Place of birth for the foreign-born population - Kuwait (%)
Place of birth for the foreign-born population - Lebanon (%)
Place of birth for the foreign-born population - Saudi Arabia (%)
Place of birth for the foreign-born population - Syria (%)
Place of birth for the foreign-born population - Turkey (%)
Place of birth for the foreign-born population - Yemen (%)
Place of birth for the foreign-born population - Other Western Asia (%)
Place of birth for the foreign-born population - Eritrea (%)
Place of birth for the foreign-born population - Ethiopia (%)
Place of birth for the foreign-born population - Kenya (%)
Place of birth for the foreign-born population - Somalia (%)
Place of birth for the foreign-born population - Uganda (%)
Place of birth for the foreign-born population - Zimbabwe (%)
Place of birth for the foreign-born population - Other Eastern Africa (%)
Place of birth for the foreign-born population - Cameroon (%)
Place of birth for the foreign-born population - Congo (%)
Place of birth for the foreign-born population - Democratic Republic of Congo (Zaire) (%)
Place of birth for the foreign-born population - Other Middle Africa (%)
Place of birth for the foreign-born population - Egypt (%)
Place of birth for the foreign-born population - Morocco (%)
Place of birth for the foreign-born population - Sudan (%)
Place of birth for the foreign-born population - Other Northern Africa (%)
Place of birth for the foreign-born population - South Africa (%)
Place of birth for the foreign-born population - Other Southern Africa (%)
Place of birth for the foreign-born population - Cabo Verde (%)
Place of birth for the foreign-born population - Ghana (%)
Place of birth for the foreign-born population - Liberia (%)
Place of birth for the foreign-born population - Nigeria (%)
Place of birth for the foreign-born population - Senegal (%)
Place of birth for the foreign-born population - Sierra Leone (%)
Place of birth for the foreign-born population - Other Western Africa (%)
Place of birth for the foreign-born population - Australia (%)
Place of birth for the foreign-born population - New Zealand (%)
Place of birth for the foreign-born population - Fiji (%)
Place of birth for the foreign-born population - Micronesia (%)
Place of birth for the foreign-born population - Bahamas (%)
Place of birth for the foreign-born population - Barbados (%)
Place of birth for the foreign-born population - Cuba (%)
Place of birth for the foreign-born population - Dominica (%)
Place of birth for the foreign-born population - Dominican Republic (%)
Place of birth for the foreign-born population - Grenada (%)
Place of birth for the foreign-born population - Haiti (%)
Place of birth for the foreign-born population - Jamaica (%)
Place of birth for the foreign-born population - St. Vincent and the Grenadines (%)
Place of birth for the foreign-born population - Trinidad and Tobago (%)
Place of birth for the foreign-born population - West Indies (%)
Place of birth for the foreign-born population - Other Caribbean (%)
Place of birth for the foreign-born population - Belize (%)
Place of birth for the foreign-born population - Costa Rica (%)
Place of birth for the foreign-born population - El Salvador (%)
Place of birth for the foreign-born population - Guatemala (%)
Place of birth for the foreign-born population - Honduras (%)
Place of birth for the foreign-born population - Mexico (%)
Place of birth for the foreign-born population - Nicaragua (%)
Place of birth for the foreign-born population - Panama (%)
Place of birth for the foreign-born population - Other Central America (%)
Place of birth for the foreign-born population - Argentina (%)
Place of birth for the foreign-born population - Bolivia (%)
Place of birth for the foreign-born population - Brazil (%)
Place of birth for the foreign-born population - Chile (%)
Place of birth for the foreign-born population - Colombia (%)
Place of birth for the foreign-born population - Ecuador (%)
Place of birth for the foreign-born population - Guyana (%)
Place of birth for the foreign-born population - Peru (%)
Place of birth for the foreign-born population - Uruguay (%)
Place of birth for the foreign-born population - Venezuela (%)
Place of birth for the foreign-born population - Other South America (%)
Place of birth for the foreign-born population - Canada (%)
Place of birth for the foreign-born population - Other Northern America (%)
Place of birth for the foreign-born population - Other (%)
Latest news about races in Ada, OK collected exclusively by city-data.com from local newspapers, TV, and radio stations
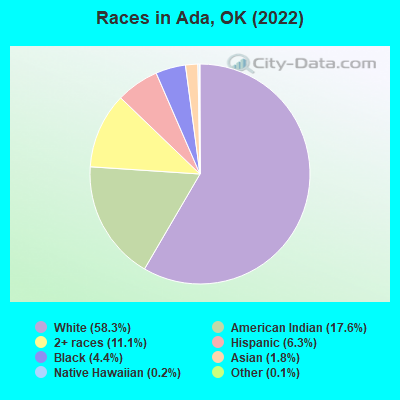
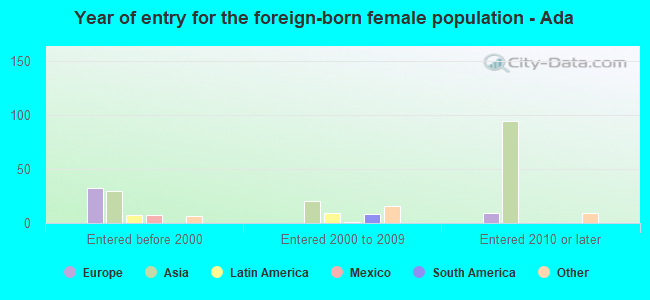
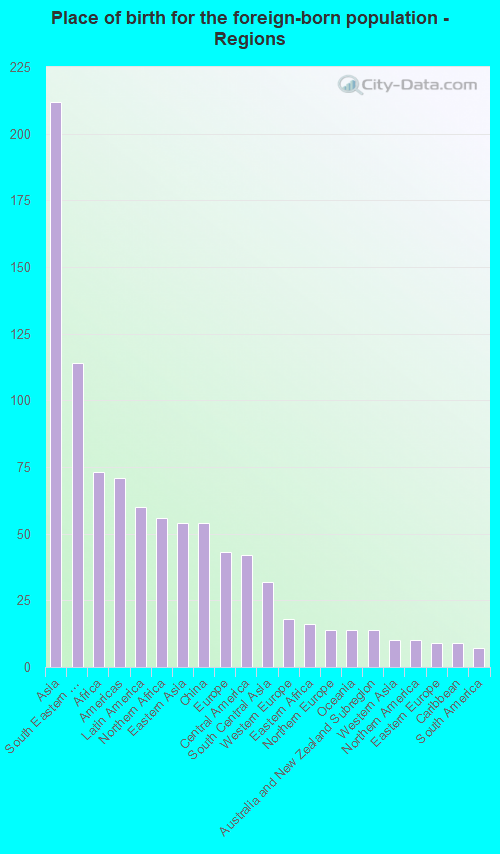
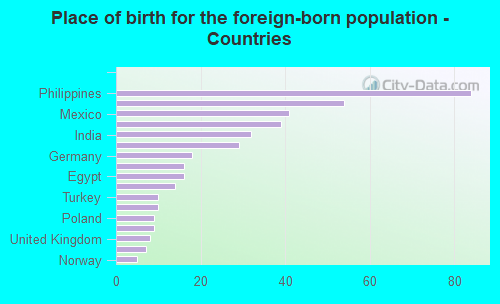
According to 2022 data, the most numerous races in Ada, OK are White alone (9,762 residents), Hispanic (1,061 residents), and Two or more races (1,857 residents). 94.6% of Ada residents speak English at home. 2.5% of Ada, OK residents are foreign-born (1.3% born in Asia, 0.4% born in Africa, 0.4% born in Latin America, 0.3% born in Europe), which is 141.5% less than the foreign-born rate of 6.0% across the entire state of Oklahoma.
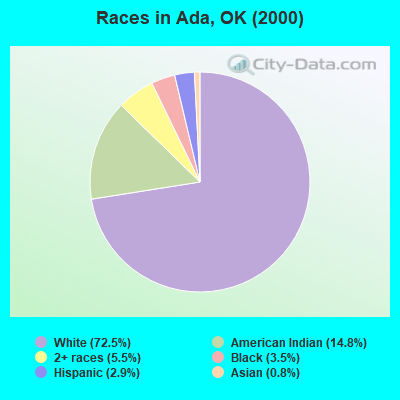
Race distribution in Ada
2000 2022
2,556,368 74.1% White alone 266,158 7.7% American Indian alone 257,981 7.5% Black alone 179,304 5.2% Hispanic 140,249 4.1% Two or more races 46,172 1.3% Asian alone 2,322 0.07% Other race alone 2,100 0.06% Native Hawaiian and Other
2,517,403 62.6% White alone 486,692 12.1% Hispanic 364,453 9.1% Two or more races 273,650 6.8% American Indian alone 268,543 6.7% Black alone 92,672 2.3% Asian alone 10,786 0.3% Other race alone 5,601 0.1% Native Hawaiian and Other
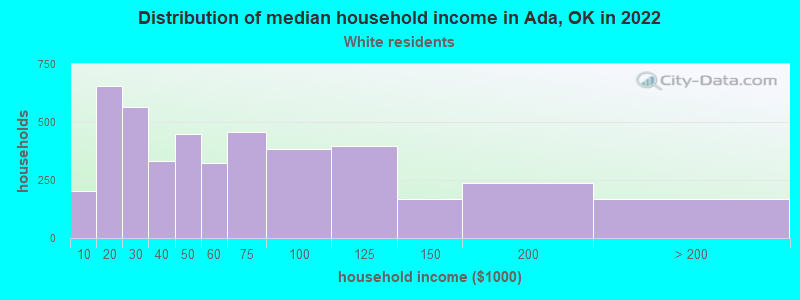
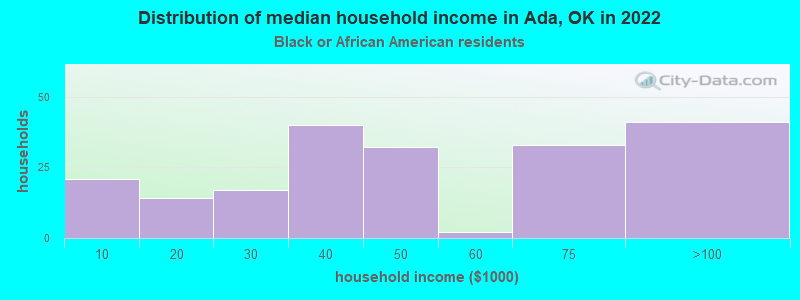
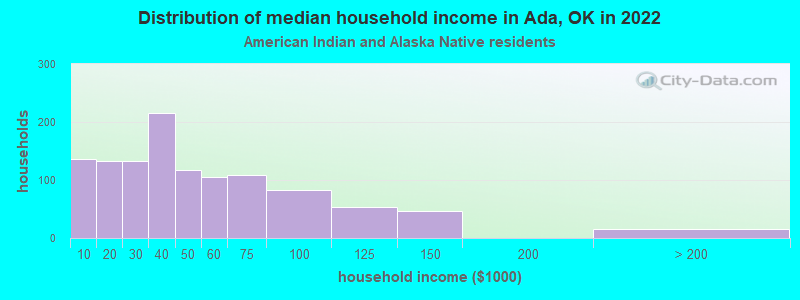
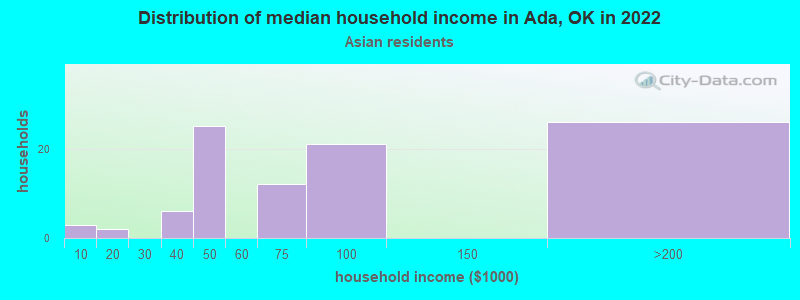
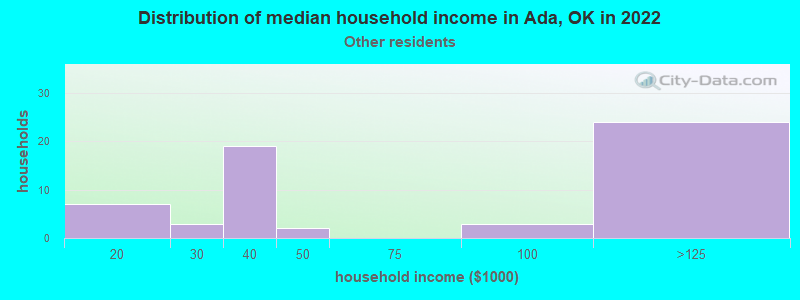
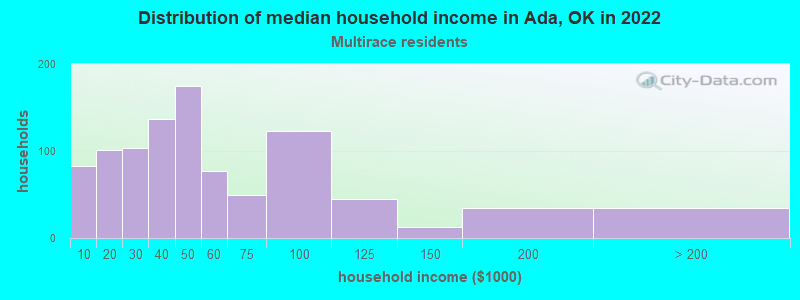
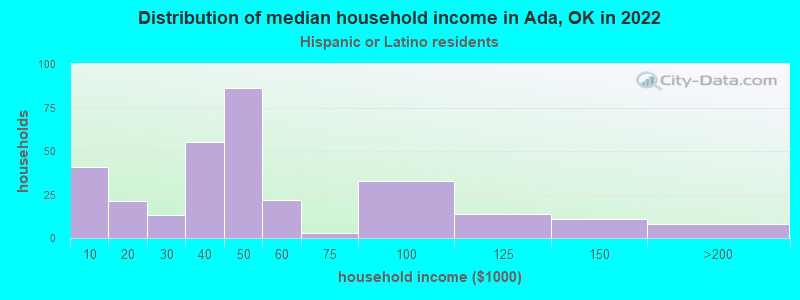
Income and house value in Ada Median household income in 2022 $48,940 White non-Hispanic householders$40,132 Black householders$36,066 American Indian and Alaska Native householders$72,356 Asian householders$40,642 Two or more races householders$41,201 Hispanic or Latino race householdersMedian 2022 house value $156,203 White Non-Hispanic householders$88,608 Black or African American householders$111,393 American Indian or Alaska Native householders $335,445 Asian householders$123,798 Some other race householders$111,393 Two or more races householders$161,520 Hispanic or Latino householders
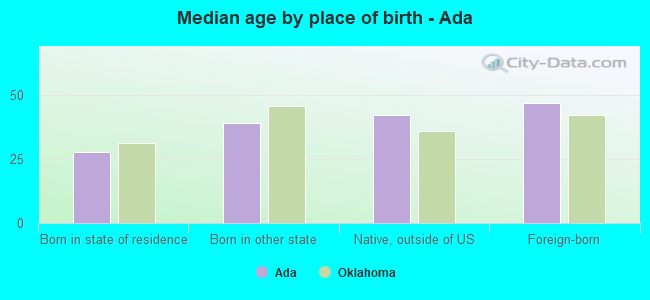
Median age by race in Ada
37.7 Median age for White residents34.6 40.0 29.2 Median age for Black or African American residents22.7 38.3 28.1 Median age for American Indian / Alaska Native residents27.8 29.1 31.6 Median age for Asian residents33.3 31.4 22.5 Median age for Native Hawaiian / Pacific Islander residents-675,324,674.6 -767,251,461.2 28.5 Median age for Other race residents28.7 23.3 23.3 Median age for Two or more races residents22.5 24.9 37.6 Median age for White alone residents34.6 39.7 21.7 Median age for Hispanic or Latino residents21.4 21.9
Owner/renter occupied households by race in Ada
House owners and renters - White residents 2,088 48.3% Owner occupied2,233 51.7% Renter occupiedHouse owners and renters - Black or African American residents 74 37.2% Owner occupied124 62.8% Renter occupiedHouse owners and renters - American Indian / Alaska Native residents 345 30.3% Owner occupied792 69.7% Renter occupiedHouse owners and renters - Asian residents 58 62.6% Owner occupied34 37.4% Renter occupiedHouse owners and renters - Native Hawaiian / Pacific Islander residents 10 100.0% Renter occupiedHouse owners and renters - Other race residents 19 30.7% Owner occupied43 69.3% Renter occupiedHouse owners and renters - Two or more races residents 349 35.3% Owner occupied641 64.7% Renter occupiedHouse owners and renters - White alone residents 2,111 48.0% Owner occupied2,286 52.0% Renter occupiedHouse owners and renters - Hispanic or Latino residents 108 35.4% Owner occupied197 64.6% Renter occupied
Language usage in Ada
English speakers - Total 94.6% of residents of Ada speak English at home.
2.1% of residents speak Spanish at home 256 76.4% Speak English very well79 23.6% Speak English less than very well3.1% of residents speak other language at home 382 78.9% Speak English very well102 21.1% Speak English less than very well
English speakers - Born in the United States 93.3% of residents of Ada speak English at home.
2.7% of residents speak Spanish at home 78 59.1% Speak English very well54 40.9% Speak English less than very well4.1% of residents speak other language at home 195 97.0% Speak English very well6 3.0% Speak English less than very well
English speakers - Native, born elsewhere 96.1% of residents of Ada speak English at home.
English speakers - Foreign-born 27.2% of residents of Ada speak English at home.
15.9% of residents speak Spanish at home 54 81.8% Speak English very well12 18.2% Speak English less than very well54.8% of residents speak other language at home 135 59.2% Speak English very well93 40.8% Speak English less than very well
White (Caucasian) - Speak only English Native:
100.0% (9,236)Foreign-born:
100.0% (49)
White (Caucasian) - Speak another language Native:
0.5% (45)Foreign-born:
31.0% (15)
Black or African American - Speak only English Native:
93.0% (618)Foreign-born:
6.4% (4)
Black or African American - Speak another language Native:
6.6% (44)Foreign-born:
98.3% (60)
Asian - Speak only English Native:
38.8% (34)Foreign-born:
10.8% (21)
Asian - Speak another language Native:
61.2% (53)Foreign-born:
89.5% (176)
Other race - Speak another language Native:
42.2% (61)Foreign-born:
100.0% (7)
Two or more races - Speak only English Native:
87.0% (2,042)Foreign-born:
49.3% (46)
Two or more races - Speak another language Native:
12.2% (286)Foreign-born:
32.2% (30)
White alone - Speak only English Native:
99.4% (9,189)Foreign-born:
93.7% (55)
White alone - Speak another language Native:
0.6% (55)Foreign-born:
9.4% (5)
Hispanic or Latino - Speak only English Native:
72.4% (637)Foreign-born:
12.6% (9)
Hispanic or Latino - Speak another language Native:
28.2% (248)Foreign-born:
88.0% (64)
Foreign-born residents in Ada 416 residents are foreign born (1.3% Asia , 0.4% Africa , 0.4% Latin America , 0.3% Europe ).
This city:
2.5%Oklahoma:
6.1%
Marital status for residents in Ada Marital status - White (Caucasian) population 15 years and over
Males 37.0% Never married44.7% Now married1.8% Separated1.9% Widowed14.6% DivorcedFemales 31.1% Never married31.4% Now married4.5% Separated15.1% Widowed17.9% DivorcedWomen who gave birth in the past 12 months Now married:
58.5% (69)Unmarried:
41.5% (49)
Women who did not give birth in the past 12 months Now married:
36.1% (842)Unmarried:
63.9% (1,493)
Marital status - Black or African American population 15 years and over
Males 57.7% Never married29.2% Now married1.8% Separated1.1% Widowed10.3% DivorcedFemales 46.6% Never married38.4% Now married0.0% Separated7.2% Widowed7.9% DivorcedWomen who did not give birth in the past 12 months Now married:
44.1% (91)Unmarried:
55.9% (115)
Marital status - American Indian / Alaska Native population 15 years and over
Males 48.4% Never married26.2% Now married4.1% Separated1.3% Widowed20.1% DivorcedFemales 47.0% Never married26.0% Now married1.4% Separated8.9% Widowed16.7% DivorcedWomen who gave birth in the past 12 months Now married:
42.4% (14)Unmarried:
57.6% (19)
Women who did not give birth in the past 12 months Now married:
20.0% (180)Unmarried:
80.0% (716)
Marital status - Asian population 15 years and over
Males 54.4% Never married36.9% Now married0.0% Separated0.0% Widowed8.7% DivorcedFemales 34.6% Never married65.4% Now married0.0% Separated0.0% Widowed0.0% DivorcedWomen who did not give birth in the past 12 months Now married:
57.1% (60)Unmarried:
42.9% (45)
Marital status - Native Hawaiian / Pacific Islander population 15 years and over
Males 100.0% Never married0.0% Now married0.0% Separated0.0% Widowed0.0% DivorcedFemales 100.0% Never married0.0% Now married0.0% Separated0.0% Widowed0.0% DivorcedWomen who did not give birth in the past 12 months Now married:
0.0% (0)Unmarried:
100.0% (14)
Marital status - Other race population 15 years and over
Males 34.3% Never married30.0% Now married5.7% Separated30.0% Widowed0.0% DivorcedFemales 45.5% Never married36.4% Now married0.0% Separated13.6% Widowed4.5% DivorcedWomen who gave birth in the past 12 months Now married:
100.0% (7)Unmarried:
0.0% (0)
Women who did not give birth in the past 12 months Now married:
33.3% (12)Unmarried:
66.7% (23)
Marital status - Two or more races population 15 years and over
Males 49.9% Never married41.4% Now married2.0% Separated1.3% Widowed5.5% DivorcedFemales 43.0% Never married35.7% Now married1.7% Separated5.0% Widowed14.5% DivorcedWomen who gave birth in the past 12 months Now married:
100.0% (23)Unmarried:
0.0% (0)
Women who did not give birth in the past 12 months Now married:
35.8% (283)Unmarried:
64.2% (507)
Marital status - White alone, not Hispanic / Latino population 15 years and over
Males 36.7% Never married45.3% Now married1.6% Separated2.0% Widowed14.6% DivorcedFemales 30.9% Never married31.7% Now married4.5% Separated15.1% Widowed17.8% DivorcedWomen who gave birth in the past 12 months Now married:
61.0% (72)Unmarried:
39.0% (46)
Women who did not give birth in the past 12 months Now married:
36.3% (863)Unmarried:
63.7% (1,516)
Marital status - Hispanic or Latino population 15 years and over
Males 51.3% Never married42.4% Now married3.9% Separated0.0% Widowed2.4% DivorcedFemales 58.6% Never married24.8% Now married0.0% Separated9.0% Widowed7.6% DivorcedWomen who gave birth in the past 12 months Now married:
54.5% (7)Unmarried:
45.5% (5)
Women who did not give birth in the past 12 months Now married:
21.3% (46)Unmarried:
78.7% (170)
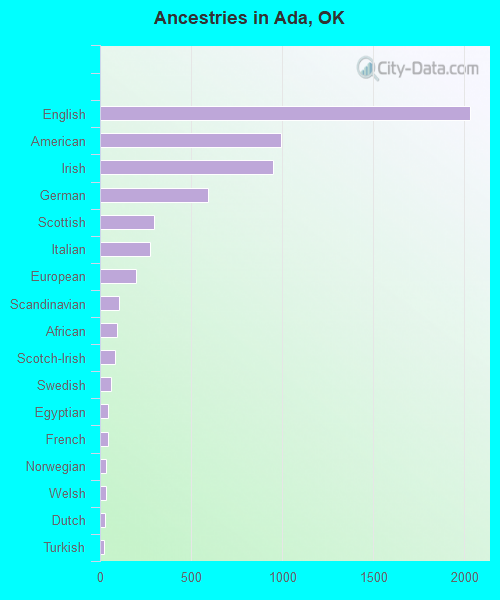
Ancestries in Ada
2,034 19.0% English993 9.3% American952 8.9% Irish592 5.5% German298 2.8% Scottish273 2.5% Italian195 1.8% European102 1.0% Scandinavian92 0.9% African81 0.8% Scotch-Irish63 0.6% Swedish45 0.4% Egyptian42 0.4% French32 0.3% Norwegian32 0.3% Welsh27 0.3% Dutch20 0.2% Turkish18 0.2% Danish16 0.1% Portuguese12 0.1% Czechoslovakian11 0.1% Polish10 0.09% Slavic8 0.07% Australian5 0.05% Hungarian5 0.05% British West Indian3 0.03% Austrian3 0.03% Kenyan2 0.02% Eastern European
Children Nativity (place of birth) in Ada
Children under 6 years - Living with two parents Both parents native 490 100.0% NativeBoth parents foreign-born 28 100.0% NativeOne native, one foreign-born parent 67 100.0% NativeChildren under 6 years - Living with one parent Native parent 644 100.0% NativeChildren 6 to 17 years - Living with two parents Both parents native 1,180 100.0% Native1 0.0% Foreign-bornBoth parents foreign-born 98 82.9% Native20 17.1% Foreign-bornOne native, one foreign-born parent 71 100.0% NativeChildren 6 to 17 years - Living with one parent Native parent 1,229 100.0% Native
Grandparents responsible for own grandchildren in Ada
Grandparents (30 to 59 years) White / Caucasian 24 72.1% Responsible for grandchildren9 27.9% Not responsible for grandchildrenAmerican Indian / Alaska Native 26 100.0% Responsible for grandchildrenTwo or more races 19 100.0% Not responsible for grandchildrenWhite alone, not Hispanic / Latino 25 70.9% Responsible for grandchildren10 29.1% Not responsible for grandchildrenGrandparents (60 years and over) White / Caucasian 49 44.7% Responsible for grandchildren61 55.3% Not responsible for grandchildrenWhite alone, not Hispanic / Latino 49 46.6% Responsible for grandchildren56 53.4% Not responsible for grandchildren