Races in Adrian, Michigan (MI) Detailed Stats
Data:
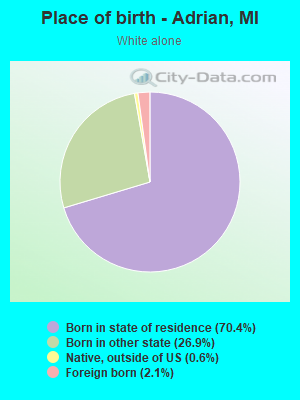
Races - White alone (%)
Races - White alone (% change since 2000)
Races - Black alone (%)
Races - Black alone (% change since 2000)
Races - American Indian alone (%)
Races - American Indian alone (% change since 2000)
Races - Asian alone (%)
Races - Asian alone (% change since 2000)
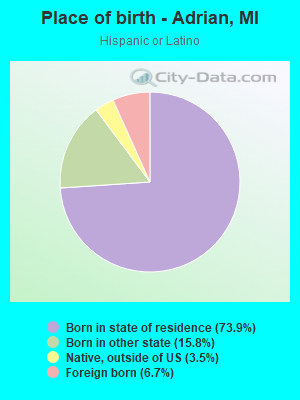
Races - Hispanic (%)
Races - Hispanic (% change since 2000)
Races - Native Hawaiian and Other Pacific Islander alone (%)
Races - Native Hawaiian and Other Pacific Islander alone (% change since 2000)
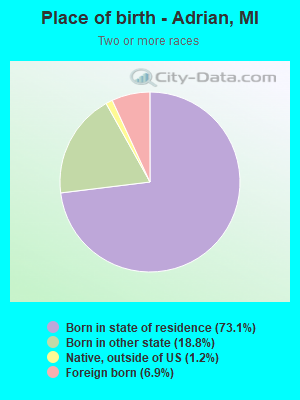
Races - Two or more races(%)
Races - Two or more races(% change since 2000)
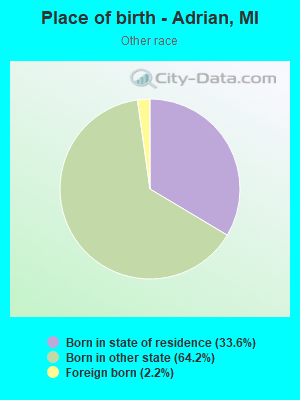
Races - Other race alone (%)
Races - Other race alone (% change since 2000)
Racial diversity
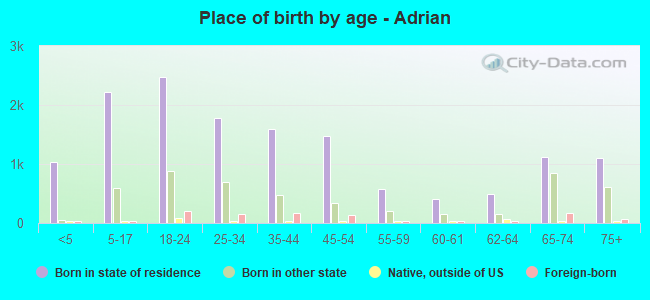
Place of birth - Born in state of residence (%)
Place of birth - Born in state of residence (%) - White
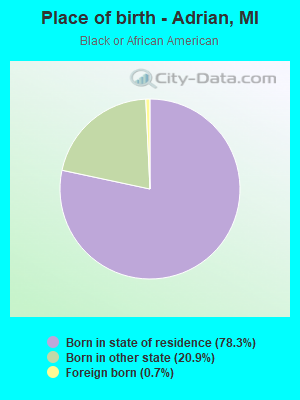
Place of birth - Born in state of residence (%) - Black or African American
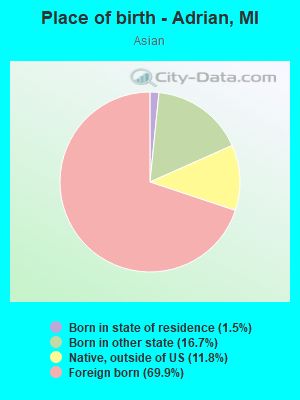
Place of birth - Born in state of residence (%) - Asian
Place of birth - Born in state of residence (%) - Hispanic or Latino
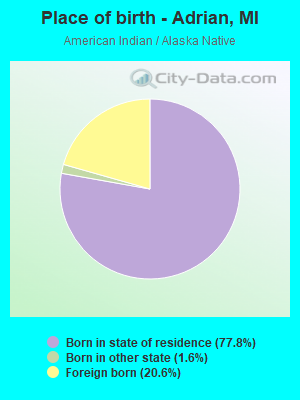
Place of birth - Born in state of residence (%) - American Indian and Alaska Native
Place of birth - Born in state of residence (%) - Multirace
Place of birth - Born in state of residence (%) - Other Race
Place of birth - Born in other state (%)
Place of birth - Born in other state (%) - White
Place of birth - Born in other state (%) - Black or African American
Place of birth - Born in other state (%) - Asian
Place of birth - Born in other state (%) - Hispanic or Latino
Place of birth - Born in other state (%) - American Indian and Alaska Native
Place of birth - Born in other state (%) - Multirace
Place of birth - Born in other state (%) - Other Race
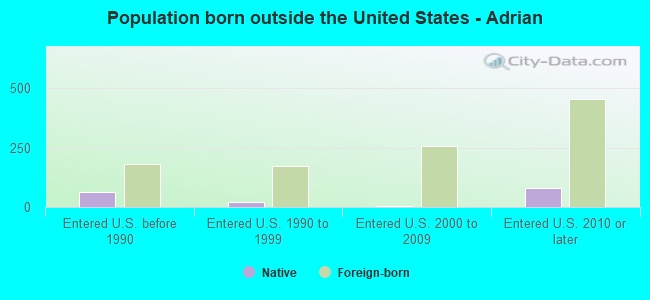
Place of birth - Native, outside of US (%)
Place of birth - Native, outside of US (%) - White
Place of birth - Native, outside of US (%) - Black or African American
Place of birth - Native, outside of US (%) - Asian
Place of birth - Native, outside of US (%) - Hispanic or Latino
Place of birth - Native, outside of US (%) - American Indian and Alaska Native
Place of birth - Native, outside of US (%) - Multirace
Place of birth - Native, outside of US (%) - Other Race
Place of birth - Foreign born (%)
Place of birth - Foreign born (%) - White
Place of birth - Foreign born (%) - Black or African American
Place of birth - Foreign born (%) - Asian
Place of birth - Foreign born (%) - Hispanic or Latino
Place of birth - Foreign born (%) - American Indian and Alaska Native
Place of birth - Foreign born (%) - Multirace
Place of birth - Foreign born (%) - Other Race
Residents speaking English at home (%)
Residents speaking English at home - Born in the United States (%)
Residents speaking English at home - Native, born elsewhere (%)
Residents speaking English at home - Foreign born (%)
Residents speaking Spanish at home (%)
Residents speaking Spanish at home - Born in the United States (%)
Residents speaking Spanish at home - Native, born elsewhere (%)
Residents speaking Spanish at home - Foreign born (%)
Residents speaking other language at home (%)
Residents speaking other language at home - Born in the United States (%)
Residents speaking other language at home - Native, born elsewhere (%)
Residents speaking other language at home - Foreign born (%)
Marital status - Never married (%)
Marital status - Now married (%)
Marital status - Separated (%)
Marital status - Widowed (%)
Marital status - Divorced (%)
Ancestries Reported - Arab (%)
Ancestries Reported - Czech (%)
Ancestries Reported - Danish (%)
Ancestries Reported - Dutch (%)
Ancestries Reported - English (%)
Ancestries Reported - French (%)
Ancestries Reported - French Canadian (%)
Ancestries Reported - German (%)
Ancestries Reported - Greek (%)
Ancestries Reported - Hungarian (%)
Ancestries Reported - Irish (%)
Ancestries Reported - Italian (%)
Ancestries Reported - Lithuanian (%)
Ancestries Reported - Norwegian (%)
Ancestries Reported - Polish (%)
Ancestries Reported - Portuguese (%)
Ancestries Reported - Russian (%)
Ancestries Reported - Scotch-Irish (%)
Ancestries Reported - Scottish (%)
Ancestries Reported - Slovak (%)
Ancestries Reported - Subsaharan African (%)
Ancestries Reported - Swedish (%)
Ancestries Reported - Swiss (%)
Ancestries Reported - Ukrainian (%)
Ancestries Reported - United States (%)
Ancestries Reported - Welsh (%)
Ancestries Reported - West Indian (%)
Ancestries Reported - Other (%)
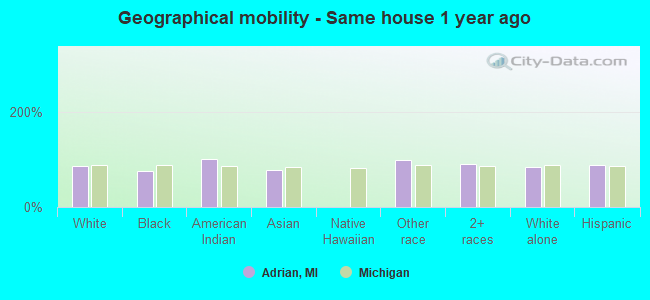
Geographical mobility - Same house 1 year ago (%)
Geographical mobility - Same house 1 year ago (%) - White
Geographical mobility - Same house 1 year ago (%) - Black or African American
Geographical mobility - Same house 1 year ago (%) - Asian
Geographical mobility - Same house 1 year ago (%) - Hispanic or Latino
Geographical mobility - Same house 1 year ago (%) - American Indian and Alaska Native
Geographical mobility - Same house 1 year ago (%) - Multirace
Geographical mobility - Same house 1 year ago (%) - Other Race
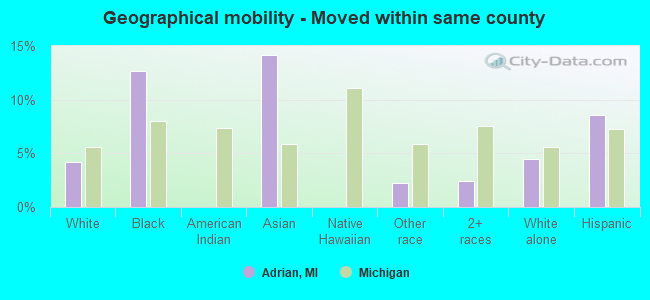
Geographical mobility - Moved within same county (%)
Geographical mobility - Moved within same county (%) - White
Geographical mobility - Moved within same county (%) - Black or African American
Geographical mobility - Moved within same county (%) - Asian
Geographical mobility - Moved within same county (%) - Hispanic or Latino
Geographical mobility - Moved within same county (%) - American Indian and Alaska Native
Geographical mobility - Moved within same county (%) - Multirace
Geographical mobility - Moved within same county (%) - Other Race
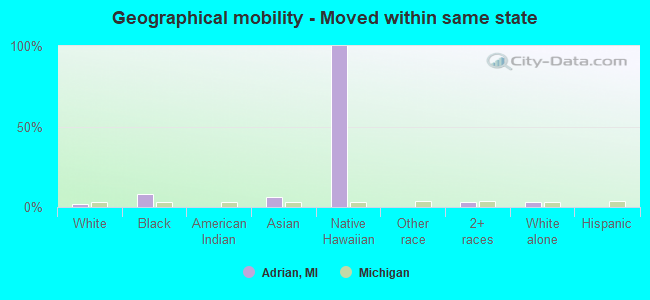
Geographical mobility - Moved from different county within same state (%)
Geographical mobility - Moved from different county within same state (%) - White
Geographical mobility - Moved from different county within same state (%) - Black or African American
Geographical mobility - Moved from different county within same state (%) - Asian
Geographical mobility - Moved from different county within same state (%) - Hispanic or Latino
Geographical mobility - Moved from different county within same state (%) - American Indian and Alaska Native
Geographical mobility - Moved from different county within same state (%) - Multirace
Geographical mobility - Moved from different county within same state (%) - Other Race
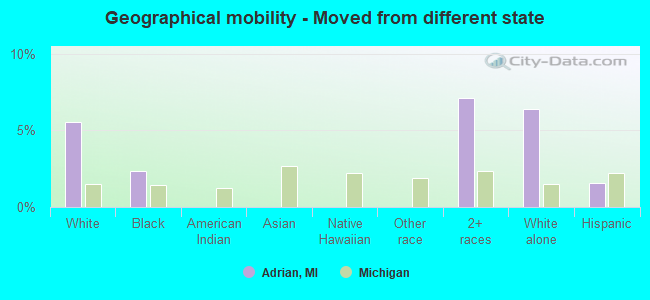
Geographical mobility - Moved from different state (%)
Geographical mobility - Moved from different state (%) - White
Geographical mobility - Moved from different state (%) - Black or African American
Geographical mobility - Moved from different state (%) - Asian
Geographical mobility - Moved from different state (%) - Hispanic or Latino
Geographical mobility - Moved from different state (%) - American Indian and Alaska Native
Geographical mobility - Moved from different state (%) - Multirace
Geographical mobility - Moved from different state (%) - Other Race
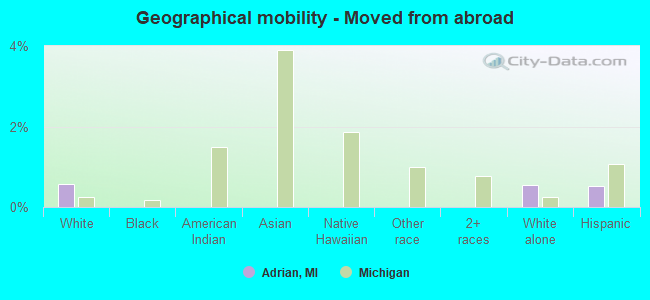
Geographical mobility - Moved from abroad (%)
Geographical mobility - Moved from abroad (%) - White
Geographical mobility - Moved from abroad (%) - Black or African American
Geographical mobility - Moved from abroad (%) - Asian
Geographical mobility - Moved from abroad (%) - Hispanic or Latino
Geographical mobility - Moved from abroad (%) - American Indian and Alaska Native
Geographical mobility - Moved from abroad (%) - Multirace
Geographical mobility - Moved from abroad (%) - Other Race
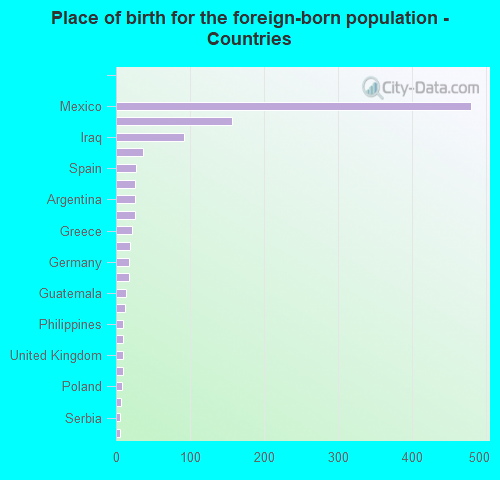
Place of birth for the foreign-born population - Ireland (%)
Place of birth for the foreign-born population - Denmark (%)
Place of birth for the foreign-born population - Norway (%)
Place of birth for the foreign-born population - Sweden (%)
Place of birth for the foreign-born population - United Kingdom (%)
Place of birth for the foreign-born population - England (%)
Place of birth for the foreign-born population - Scotland (%)
Place of birth for the foreign-born population - Other Northern Europe (%)
Place of birth for the foreign-born population - Austria (%)
Place of birth for the foreign-born population - Belgium (%)
Place of birth for the foreign-born population - France (%)
Place of birth for the foreign-born population - Germany (%)
Place of birth for the foreign-born population - Netherlands (%)
Place of birth for the foreign-born population - Switzerland (%)
Place of birth for the foreign-born population - Other Western Europe (%)
Place of birth for the foreign-born population - Greece (%)
Place of birth for the foreign-born population - Italy (%)
Place of birth for the foreign-born population - Portugal (%)
Place of birth for the foreign-born population - Spain (%)
Place of birth for the foreign-born population - Other Southern Europe (%)
Place of birth for the foreign-born population - Albania (%)
Place of birth for the foreign-born population - Belarus (%)
Place of birth for the foreign-born population - Bosnia and Herzegovina (%)
Place of birth for the foreign-born population - Bulgaria (%)
Place of birth for the foreign-born population - Croatia (%)
Place of birth for the foreign-born population - Czechoslovakia (%)
Place of birth for the foreign-born population - Hungary (%)
Place of birth for the foreign-born population - Latvia (%)
Place of birth for the foreign-born population - Lithuania (%)
Place of birth for the foreign-born population - North Macedonia (Macedonia) (%)
Place of birth for the foreign-born population - Moldova (%)
Place of birth for the foreign-born population - Poland (%)
Place of birth for the foreign-born population - Romania (%)
Place of birth for the foreign-born population - Russia (%)
Place of birth for the foreign-born population - Serbia (%)
Place of birth for the foreign-born population - Ukraine (%)
Place of birth for the foreign-born population - Other Eastern Europe (%)
Place of birth for the foreign-born population - China (%)
Place of birth for the foreign-born population - Hong Kong (%)
Place of birth for the foreign-born population - Taiwan (%)
Place of birth for the foreign-born population - Japan (%)
Place of birth for the foreign-born population - Korea (%)
Place of birth for the foreign-born population - Other Eastern Asia (%)
Place of birth for the foreign-born population - Afghanistan (%)
Place of birth for the foreign-born population - Bangladesh (%)
Place of birth for the foreign-born population - India (%)
Place of birth for the foreign-born population - Iran (%)
Place of birth for the foreign-born population - Kazakhstan (%)
Place of birth for the foreign-born population - Nepal (%)
Place of birth for the foreign-born population - Pakistan (%)
Place of birth for the foreign-born population - Sri Lanka (%)
Place of birth for the foreign-born population - Uzbekistan (%)
Place of birth for the foreign-born population - Other South Central Asia (%)
Place of birth for the foreign-born population - Burma (%)
Place of birth for the foreign-born population - Cambodia (%)
Place of birth for the foreign-born population - Indonesia (%)
Place of birth for the foreign-born population - Laos (%)
Place of birth for the foreign-born population - Malaysia (%)
Place of birth for the foreign-born population - Philippines (%)
Place of birth for the foreign-born population - Singapore (%)
Place of birth for the foreign-born population - Thailand (%)
Place of birth for the foreign-born population - Vietnam (%)
Place of birth for the foreign-born population - Other South Eastern Asia (%)
Place of birth for the foreign-born population - Armenia (%)
Place of birth for the foreign-born population - Iraq (%)
Place of birth for the foreign-born population - Israel (%)
Place of birth for the foreign-born population - Jordan (%)
Place of birth for the foreign-born population - Kuwait (%)
Place of birth for the foreign-born population - Lebanon (%)
Place of birth for the foreign-born population - Saudi Arabia (%)
Place of birth for the foreign-born population - Syria (%)
Place of birth for the foreign-born population - Turkey (%)
Place of birth for the foreign-born population - Yemen (%)
Place of birth for the foreign-born population - Other Western Asia (%)
Place of birth for the foreign-born population - Eritrea (%)
Place of birth for the foreign-born population - Ethiopia (%)
Place of birth for the foreign-born population - Kenya (%)
Place of birth for the foreign-born population - Somalia (%)
Place of birth for the foreign-born population - Uganda (%)
Place of birth for the foreign-born population - Zimbabwe (%)
Place of birth for the foreign-born population - Other Eastern Africa (%)
Place of birth for the foreign-born population - Cameroon (%)
Place of birth for the foreign-born population - Congo (%)
Place of birth for the foreign-born population - Democratic Republic of Congo (Zaire) (%)
Place of birth for the foreign-born population - Other Middle Africa (%)
Place of birth for the foreign-born population - Egypt (%)
Place of birth for the foreign-born population - Morocco (%)
Place of birth for the foreign-born population - Sudan (%)
Place of birth for the foreign-born population - Other Northern Africa (%)
Place of birth for the foreign-born population - South Africa (%)
Place of birth for the foreign-born population - Other Southern Africa (%)
Place of birth for the foreign-born population - Cabo Verde (%)
Place of birth for the foreign-born population - Ghana (%)
Place of birth for the foreign-born population - Liberia (%)
Place of birth for the foreign-born population - Nigeria (%)
Place of birth for the foreign-born population - Senegal (%)
Place of birth for the foreign-born population - Sierra Leone (%)
Place of birth for the foreign-born population - Other Western Africa (%)
Place of birth for the foreign-born population - Australia (%)
Place of birth for the foreign-born population - New Zealand (%)
Place of birth for the foreign-born population - Fiji (%)
Place of birth for the foreign-born population - Micronesia (%)
Place of birth for the foreign-born population - Bahamas (%)
Place of birth for the foreign-born population - Barbados (%)
Place of birth for the foreign-born population - Cuba (%)
Place of birth for the foreign-born population - Dominica (%)
Place of birth for the foreign-born population - Dominican Republic (%)
Place of birth for the foreign-born population - Grenada (%)
Place of birth for the foreign-born population - Haiti (%)
Place of birth for the foreign-born population - Jamaica (%)
Place of birth for the foreign-born population - St. Vincent and the Grenadines (%)
Place of birth for the foreign-born population - Trinidad and Tobago (%)
Place of birth for the foreign-born population - West Indies (%)
Place of birth for the foreign-born population - Other Caribbean (%)
Place of birth for the foreign-born population - Belize (%)
Place of birth for the foreign-born population - Costa Rica (%)
Place of birth for the foreign-born population - El Salvador (%)
Place of birth for the foreign-born population - Guatemala (%)
Place of birth for the foreign-born population - Honduras (%)
Place of birth for the foreign-born population - Mexico (%)
Place of birth for the foreign-born population - Nicaragua (%)
Place of birth for the foreign-born population - Panama (%)
Place of birth for the foreign-born population - Other Central America (%)
Place of birth for the foreign-born population - Argentina (%)
Place of birth for the foreign-born population - Bolivia (%)
Place of birth for the foreign-born population - Brazil (%)
Place of birth for the foreign-born population - Chile (%)
Place of birth for the foreign-born population - Colombia (%)
Place of birth for the foreign-born population - Ecuador (%)
Place of birth for the foreign-born population - Guyana (%)
Place of birth for the foreign-born population - Peru (%)
Place of birth for the foreign-born population - Uruguay (%)
Place of birth for the foreign-born population - Venezuela (%)
Place of birth for the foreign-born population - Other South America (%)
Place of birth for the foreign-born population - Canada (%)
Place of birth for the foreign-born population - Other Northern America (%)
Place of birth for the foreign-born population - Other (%)
Latest news about races in Adrian, MI collected exclusively by city-data.com from local newspapers, TV, and radio stations
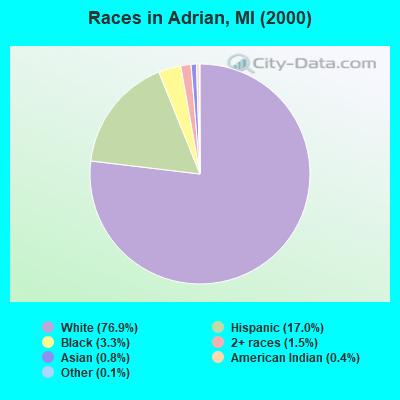
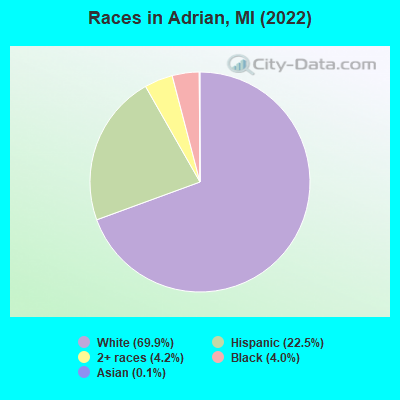
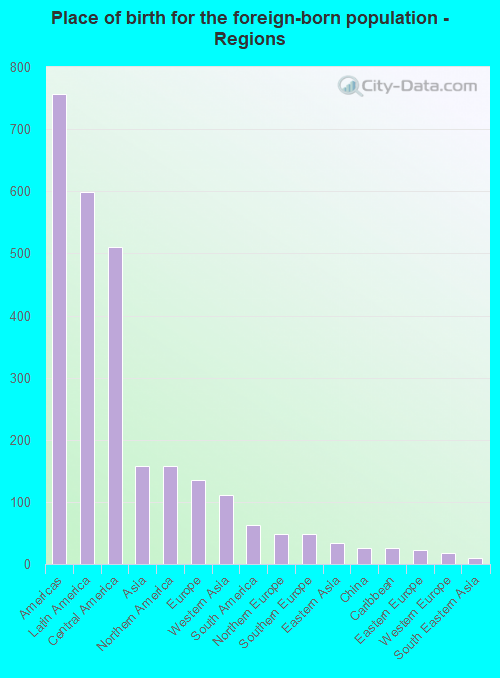
According to 2022 data, the most numerous races in Adrian, MI are White alone (14,298 residents), Black alone (827 residents), and Hispanic (4,607 residents). 88.5% of Adrian residents speak English at home. 5.1% of Adrian, MI residents are foreign-born (2.9% born in Latin America, 0.8% born in Asia, 0.8% born in North America, 0.7% born in Europe), which is 16.9% less than the foreign-born rate of 6.0% across the entire state of Michigan.
Race distribution in Adrian
2000 2022
7,806,691 78.6% White alone 1,402,047 14.1% Black alone 323,877 3.3% Hispanic 175,311 1.8% Asian alone 163,487 1.6% Two or more races 53,421 0.5% American Indian alone 11,465 0.1% Other race alone 2,145 0.02% Native Hawaiian and Other
7,289,051 72.6% White alone 1,310,464 13.1% Black alone 572,405 5.7% Hispanic 450,031 4.5% Two or more races 335,732 3.3% Asian alone 45,217 0.5% Other race alone 29,011 0.3% American Indian alone 2,207 0.02% Native Hawaiian and Other
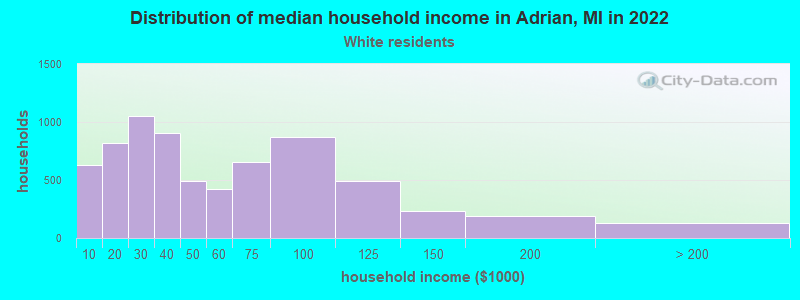
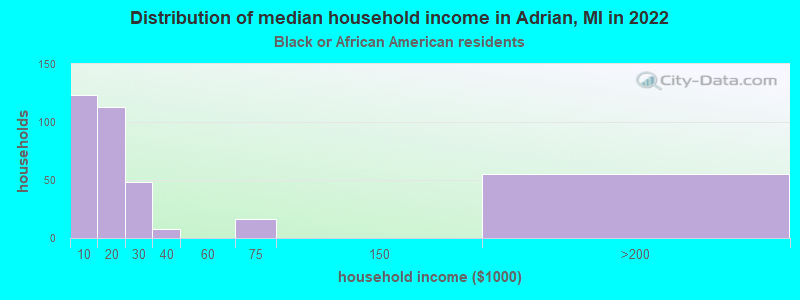
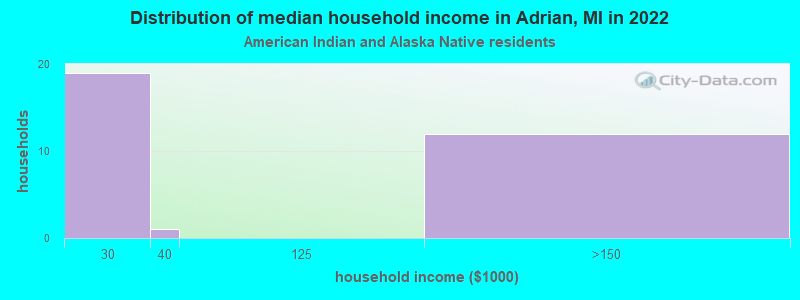
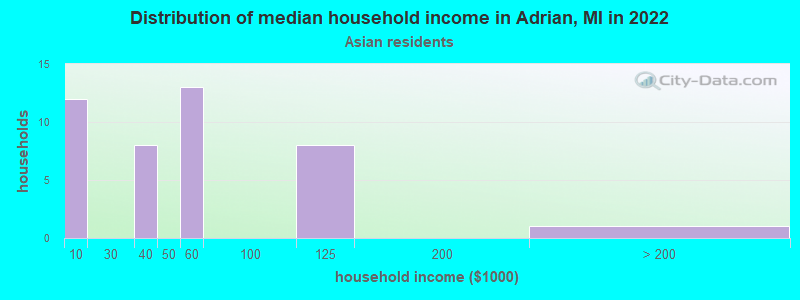
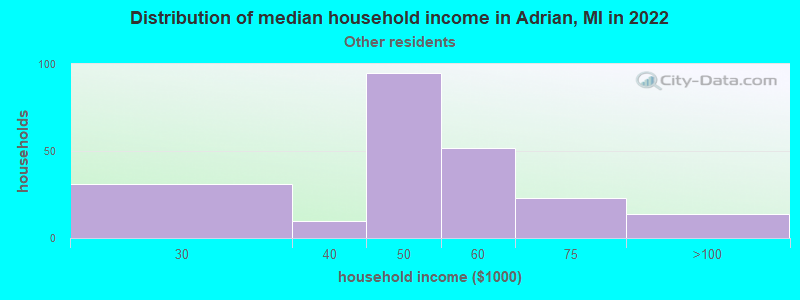
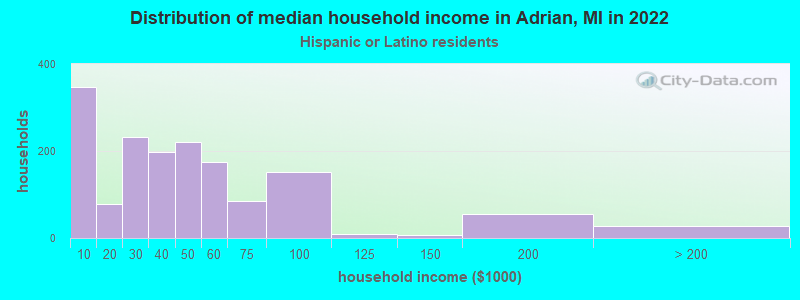
Income and house value in Adrian Median household income in 2022 $46,066 White non-Hispanic householders$15,824 Black householders$47,775 Some other race householders$44,461 Two or more races householders$54,711 Hispanic or Latino race householdersMedian 2022 house value $128,772 White Non-Hispanic householders$112,694 Black or African American householders $385,722 Asian householders$125,348 Some other race householders$132,792 Two or more races householders$124,455 Hispanic or Latino householders
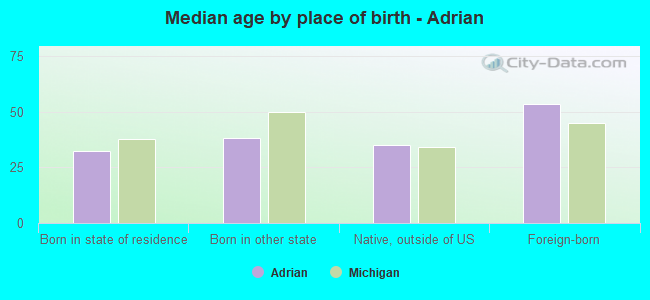
Median age by race in Adrian
36.3 Median age for White residents33.8 38.9 29.1 Median age for Black or African American residents31.9 13.3 56.3 Median age for American Indian / Alaska Native residents-659,707,723.8 -297,734,627.5 44.4 Median age for Asian residents55.2 42.7 -670,531,400.3 Median age for Native Hawaiian / Pacific Islander residents-666,666,666.0 -666,666,666.0 36.6 Median age for Other race residents40.4 30.3 23.6 Median age for Two or more races residents25.9 21.2 38.9 Median age for White alone residents34.8 44.4 27.7 Median age for Hispanic or Latino residents29.2 33.9
Owner/renter occupied households by race in Adrian
House owners and renters - White residents 3,714 53.8% Owner occupied3,195 46.2% Renter occupiedHouse owners and renters - Black or African American residents 55 16.1% Owner occupied287 83.9% Renter occupiedHouse owners and renters - American Indian / Alaska Native residents 9 27.3% Owner occupied24 72.7% Renter occupiedHouse owners and renters - Asian residents 19 44.8% Owner occupied23 55.2% Renter occupiedHouse owners and renters - Native Hawaiian / Pacific Islander residents 12 100.0% Renter occupiedHouse owners and renters - Other race residents 106 76.6% Owner occupied32 23.4% Renter occupiedHouse owners and renters - Two or more races residents 339 79.5% Owner occupied87 20.5% Renter occupiedHouse owners and renters - White alone residents 3,311 54.7% Owner occupied2,739 45.3% Renter occupiedHouse owners and renters - Hispanic or Latino residents 936 63.0% Owner occupied549 37.0% Renter occupied
Language usage in Adrian
English speakers - Total 88.5% of residents of Adrian speak English at home.
9.8% of residents speak Spanish at home 1,025 53.8% Speak English very well879 46.2% Speak English less than very well2.0% of residents speak other language at home 245 63.6% Speak English very well140 36.4% Speak English less than very well
English speakers - Born in the United States 86.6% of residents of Adrian speak English at home.
13.6% of residents speak Spanish at home 367 52.4% Speak English very well334 47.6% Speak English less than very well1.3% of residents speak other language at home 9 13.8% Speak English very well56 86.2% Speak English less than very well
English speakers - Native, born elsewhere 56.2% of residents of Adrian speak English at home.
45.1% of residents speak Spanish at home 5 6.8% Speak English very well68 93.2% Speak English less than very well2.5% of residents speak other language at home 4 100.0% Speak English very well
English speakers - Foreign-born 23.0% of residents of Adrian speak English at home.
56.9% of residents speak Spanish at home 166 27.8% Speak English very well432 72.2% Speak English less than very well20.6% of residents speak other language at home 135 62.2% Speak English very well82 37.8% Speak English less than very well
White (Caucasian) - Speak only English Native:
94.9% (14,754)Foreign-born:
65.1% (252)
White (Caucasian) - Speak another language Native:
4.7% (724)Foreign-born:
100.0% (386)
Black or African American - Speak only English Native:
100.0% (742)Foreign-born:
93.1% (5)
American Indian / Alaska Native - Speak another language Native:
73.6% (37)Foreign-born:
100.0% (13)
Asian - Speak only English Native:
96.8% (20)Foreign-born:
6.1% (3)
Other race - Speak only English Native:
26.4% (161)Foreign-born:
10.8% (2)
Other race - Speak another language Native:
69.8% (427)Foreign-born:
88.3% (13)
Two or more races - Speak only English Native:
88.1% (1,555)Foreign-born:
4.0% (9)
Two or more races - Speak another language Native:
11.8% (208)Foreign-born:
97.9% (227)
White alone - Speak only English Native:
98.6% (13,142)Foreign-born:
76.7% (234)
White alone - Speak another language Native:
1.3% (175)Foreign-born:
64.4% (197)
Hispanic or Latino - Speak only English Native:
68.0% (2,530)Foreign-born:
7.4% (44)
Hispanic or Latino - Speak another language Native:
32.0% (1,190)Foreign-born:
92.6% (551)
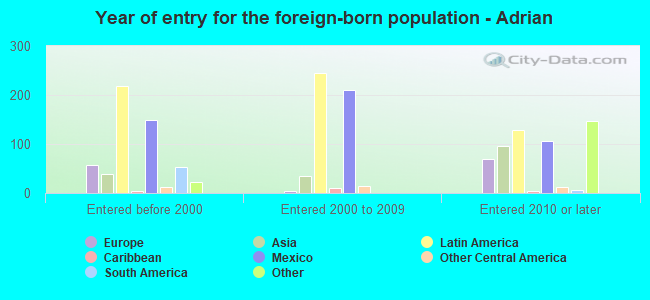
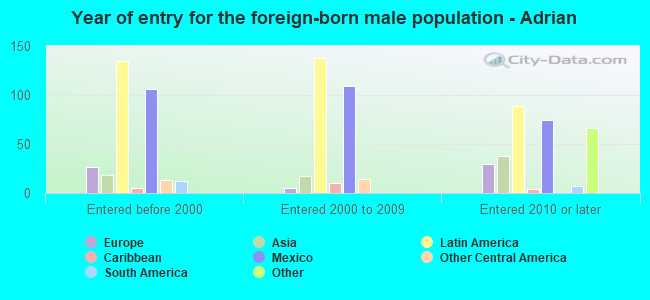
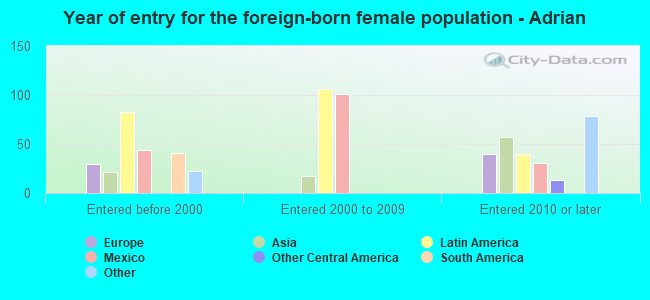
Foreign-born residents in Adrian 1,050 residents are foreign born (2.9% Latin America , 0.8% Asia , 0.8% North America , 0.7% Europe ).
This city:
5.1%Michigan:
6.9%
Marital status for residents in Adrian Marital status - White (Caucasian) population 15 years and over
Males 48.9% Never married33.5% Now married0.6% Separated3.0% Widowed14.1% DivorcedFemales 39.2% Never married32.2% Now married2.5% Separated9.8% Widowed16.3% DivorcedWomen who gave birth in the past 12 months Now married:
36.3% (99)Unmarried:
63.7% (174)
Women who did not give birth in the past 12 months Now married:
30.3% (1,103)Unmarried:
69.7% (2,537)
Marital status - Black or African American population 15 years and over
Males 66.0% Never married16.8% Now married10.1% Separated3.1% Widowed4.0% DivorcedFemales 82.1% Never married8.3% Now married0.0% Separated5.6% Widowed4.0% DivorcedWomen who did not give birth in the past 12 months Now married:
10.7% (18)Unmarried:
89.3% (151)
Marital status - American Indian / Alaska Native population 15 years and over
Males 0.0% Never married75.0% Now married0.0% Separated0.0% Widowed25.0% DivorcedFemales 0.0% Never married100.0% Now married0.0% Separated0.0% Widowed0.0% DivorcedMarital status - Asian population 15 years and over
Males 39.3% Never married60.7% Now married0.0% Separated0.0% Widowed0.0% DivorcedFemales 28.2% Never married33.3% Now married0.0% Separated25.6% Widowed12.8% DivorcedWomen who did not give birth in the past 12 months Now married:
52.2% (12)Unmarried:
47.8% (11)
Marital status - Other race population 15 years and over
Males 28.9% Never married65.7% Now married0.4% Separated0.0% Widowed5.0% DivorcedFemales 13.2% Never married75.1% Now married0.0% Separated0.0% Widowed11.7% DivorcedWomen who did not give birth in the past 12 months Now married:
0.0% (0)Unmarried:
100.0% (63)
Marital status - Two or more races population 15 years and over
Males 62.3% Never married26.1% Now married9.1% Separated0.2% Widowed2.3% DivorcedFemales 40.4% Never married34.7% Now married5.2% Separated7.9% Widowed11.8% DivorcedWomen who gave birth in the past 12 months Now married:
0.0% (0)Unmarried:
100.0% (23)
Women who did not give birth in the past 12 months Now married:
42.8% (155)Unmarried:
57.2% (207)
Marital status - White alone, not Hispanic / Latino population 15 years and over
Males 48.4% Never married33.6% Now married0.7% Separated3.1% Widowed14.1% DivorcedFemales 37.6% Never married31.9% Now married2.6% Separated10.8% Widowed17.2% DivorcedWomen who gave birth in the past 12 months Now married:
11.0% (17)Unmarried:
89.0% (138)
Women who did not give birth in the past 12 months Now married:
33.0% (992)Unmarried:
67.0% (2,016)
Marital status - Hispanic or Latino population 15 years and over
Males 51.4% Never married37.0% Now married0.1% Separated1.3% Widowed10.2% DivorcedFemales 39.2% Never married43.2% Now married3.1% Separated3.1% Widowed11.5% DivorcedWomen who gave birth in the past 12 months Now married:
60.0% (88)Unmarried:
40.0% (58)
Women who did not give birth in the past 12 months Now married:
24.8% (226)Unmarried:
75.2% (685)
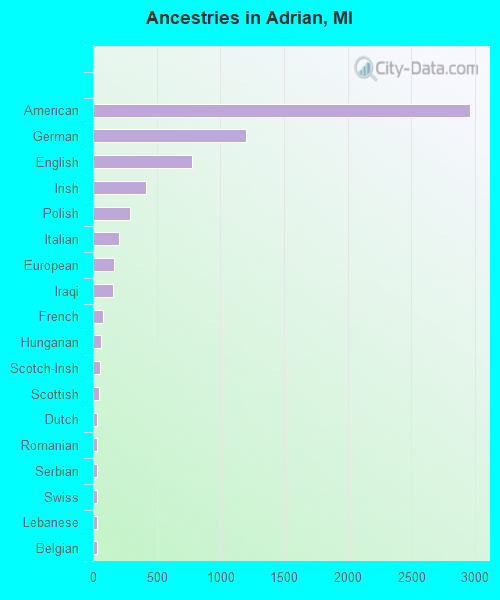
Ancestries in Adrian
2,963 27.8% American1,200 11.3% German780 7.3% English420 3.9% Irish292 2.7% Polish205 1.9% Italian164 1.5% European158 1.5% Iraqi75 0.7% French60 0.6% Hungarian57 0.5% Scotch-Irish50 0.5% Scottish33 0.3% Dutch32 0.3% Romanian32 0.3% Serbian31 0.3% Swiss30 0.3% Lebanese29 0.3% Belgian24 0.2% Canadian23 0.2% British21 0.2% Greek20 0.2% Czech20 0.2% Northern European17 0.2% Eastern European16 0.2% Norwegian15 0.1% Danish15 0.1% French Canadian13 0.1% Pennsylvania German11 0.1% Russian11 0.1% Swedish3 0.03% Macedonian1 0.01% African
Children Nativity (place of birth) in Adrian
Children under 6 years - Living with two parents Both parents native 330 100.0% NativeBoth parents foreign-born 22 100.0% NativeOne native, one foreign-born parent 44 100.0% NativeChildren under 6 years - Living with one parent Native parent 795 100.0% NativeChildren 6 to 17 years - Living with two parents Both parents native 849 100.0% NativeBoth parents foreign-born 148 78.8% Native40 21.2% Foreign-bornOne native, one foreign-born parent 131 100.0% NativeChildren 6 to 17 years - Living with one parent Native parent 1,167 100.0% NativeForeign-born parent 39 49.3% Native40 50.7% Foreign-born
Grandparents responsible for own grandchildren in Adrian
Grandparents (30 to 59 years) White / Caucasian 91 59.1% Responsible for grandchildren63 40.9% Not responsible for grandchildrenBlack or African American 9 100.0% Responsible for grandchildrenTwo or more races 4 100.0% Responsible for grandchildrenWhite alone, not Hispanic / Latino 91 52.3% Responsible for grandchildren83 47.7% Not responsible for grandchildrenGrandparents (60 years and over) White / Caucasian 30 21.4% Responsible for grandchildren111 78.6% Not responsible for grandchildrenBlack or African American 6 71.1% Responsible for grandchildren3 28.9% Not responsible for grandchildrenWhite alone, not Hispanic / Latino 31 21.5% Responsible for grandchildren111 78.5% Not responsible for grandchildren