Races in Airway Heights, Washington (WA) Detailed Stats
Data:
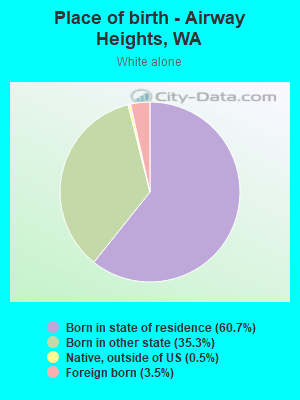
Races - White alone (%)
Races - White alone (% change since 2000)
Races - Black alone (%)
Races - Black alone (% change since 2000)
Races - American Indian alone (%)
Races - American Indian alone (% change since 2000)
Races - Asian alone (%)
Races - Asian alone (% change since 2000)
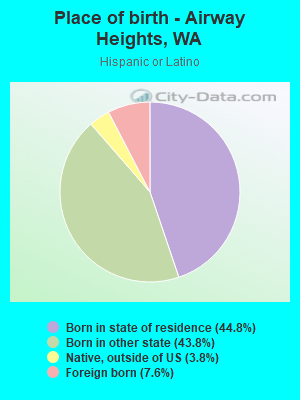
Races - Hispanic (%)
Races - Hispanic (% change since 2000)
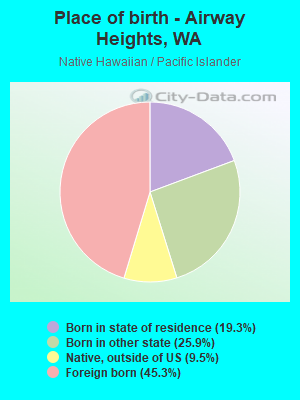
Races - Native Hawaiian and Other Pacific Islander alone (%)
Races - Native Hawaiian and Other Pacific Islander alone (% change since 2000)
Races - Two or more races(%)
Races - Two or more races(% change since 2000)
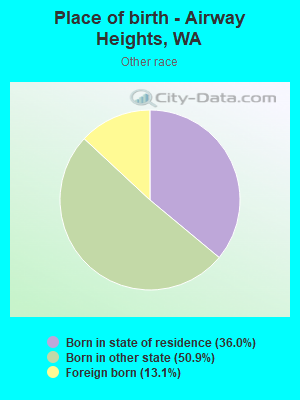
Races - Other race alone (%)
Races - Other race alone (% change since 2000)
Racial diversity
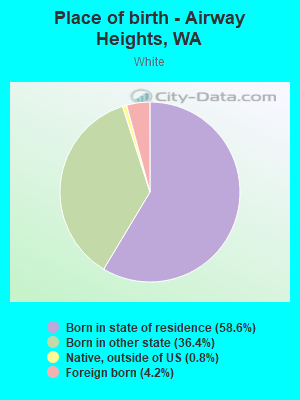
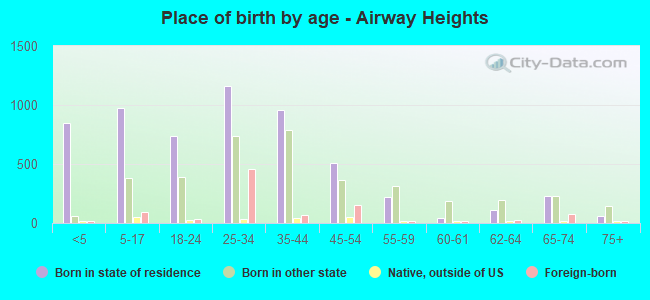
Place of birth - Born in state of residence (%)
Place of birth - Born in state of residence (%) - White
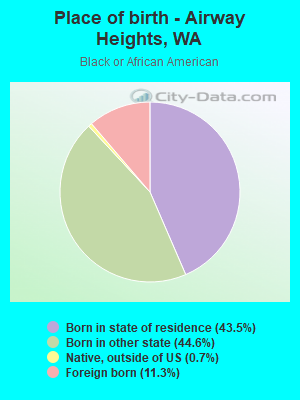
Place of birth - Born in state of residence (%) - Black or African American
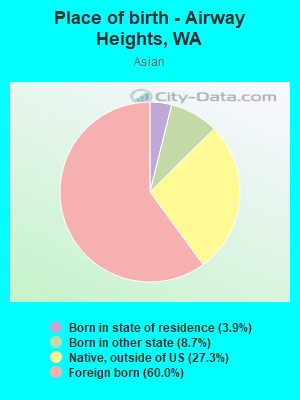
Place of birth - Born in state of residence (%) - Asian
Place of birth - Born in state of residence (%) - Hispanic or Latino
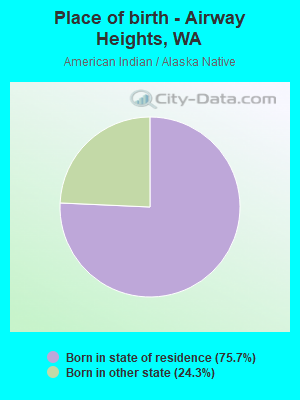
Place of birth - Born in state of residence (%) - American Indian and Alaska Native
Place of birth - Born in state of residence (%) - Multirace
Place of birth - Born in state of residence (%) - Other Race
Place of birth - Born in other state (%)
Place of birth - Born in other state (%) - White
Place of birth - Born in other state (%) - Black or African American
Place of birth - Born in other state (%) - Asian
Place of birth - Born in other state (%) - Hispanic or Latino
Place of birth - Born in other state (%) - American Indian and Alaska Native
Place of birth - Born in other state (%) - Multirace
Place of birth - Born in other state (%) - Other Race
Place of birth - Native, outside of US (%)
Place of birth - Native, outside of US (%) - White
Place of birth - Native, outside of US (%) - Black or African American
Place of birth - Native, outside of US (%) - Asian
Place of birth - Native, outside of US (%) - Hispanic or Latino
Place of birth - Native, outside of US (%) - American Indian and Alaska Native
Place of birth - Native, outside of US (%) - Multirace
Place of birth - Native, outside of US (%) - Other Race
Place of birth - Foreign born (%)
Place of birth - Foreign born (%) - White
Place of birth - Foreign born (%) - Black or African American
Place of birth - Foreign born (%) - Asian
Place of birth - Foreign born (%) - Hispanic or Latino
Place of birth - Foreign born (%) - American Indian and Alaska Native
Place of birth - Foreign born (%) - Multirace
Place of birth - Foreign born (%) - Other Race
Residents speaking English at home (%)
Residents speaking English at home - Born in the United States (%)
Residents speaking English at home - Native, born elsewhere (%)
Residents speaking English at home - Foreign born (%)
Residents speaking Spanish at home (%)
Residents speaking Spanish at home - Born in the United States (%)
Residents speaking Spanish at home - Native, born elsewhere (%)
Residents speaking Spanish at home - Foreign born (%)
Residents speaking other language at home (%)
Residents speaking other language at home - Born in the United States (%)
Residents speaking other language at home - Native, born elsewhere (%)
Residents speaking other language at home - Foreign born (%)
Marital status - Never married (%)
Marital status - Now married (%)
Marital status - Separated (%)
Marital status - Widowed (%)
Marital status - Divorced (%)
Ancestries Reported - Arab (%)
Ancestries Reported - Czech (%)
Ancestries Reported - Danish (%)
Ancestries Reported - Dutch (%)
Ancestries Reported - English (%)
Ancestries Reported - French (%)
Ancestries Reported - French Canadian (%)
Ancestries Reported - German (%)
Ancestries Reported - Greek (%)
Ancestries Reported - Hungarian (%)
Ancestries Reported - Irish (%)
Ancestries Reported - Italian (%)
Ancestries Reported - Lithuanian (%)
Ancestries Reported - Norwegian (%)
Ancestries Reported - Polish (%)
Ancestries Reported - Portuguese (%)
Ancestries Reported - Russian (%)
Ancestries Reported - Scotch-Irish (%)
Ancestries Reported - Scottish (%)
Ancestries Reported - Slovak (%)
Ancestries Reported - Subsaharan African (%)
Ancestries Reported - Swedish (%)
Ancestries Reported - Swiss (%)
Ancestries Reported - Ukrainian (%)
Ancestries Reported - United States (%)
Ancestries Reported - Welsh (%)
Ancestries Reported - West Indian (%)
Ancestries Reported - Other (%)
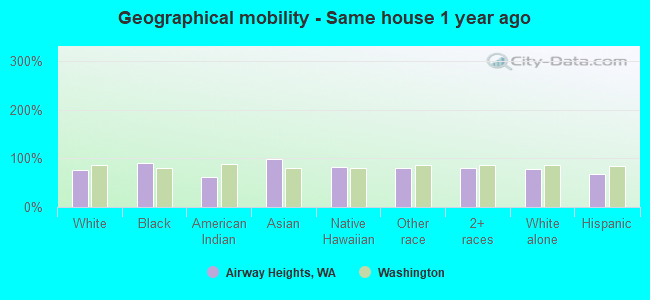
Geographical mobility - Same house 1 year ago (%)
Geographical mobility - Same house 1 year ago (%) - White
Geographical mobility - Same house 1 year ago (%) - Black or African American
Geographical mobility - Same house 1 year ago (%) - Asian
Geographical mobility - Same house 1 year ago (%) - Hispanic or Latino
Geographical mobility - Same house 1 year ago (%) - American Indian and Alaska Native
Geographical mobility - Same house 1 year ago (%) - Multirace
Geographical mobility - Same house 1 year ago (%) - Other Race
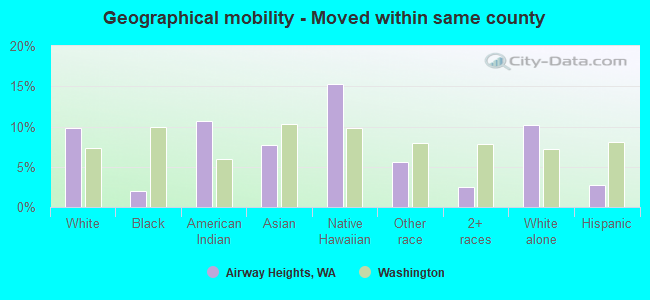
Geographical mobility - Moved within same county (%)
Geographical mobility - Moved within same county (%) - White
Geographical mobility - Moved within same county (%) - Black or African American
Geographical mobility - Moved within same county (%) - Asian
Geographical mobility - Moved within same county (%) - Hispanic or Latino
Geographical mobility - Moved within same county (%) - American Indian and Alaska Native
Geographical mobility - Moved within same county (%) - Multirace
Geographical mobility - Moved within same county (%) - Other Race
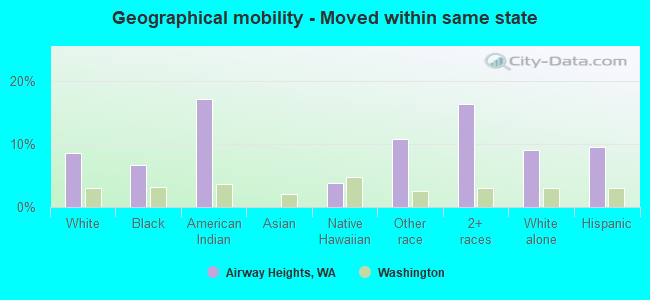
Geographical mobility - Moved from different county within same state (%)
Geographical mobility - Moved from different county within same state (%) - White
Geographical mobility - Moved from different county within same state (%) - Black or African American
Geographical mobility - Moved from different county within same state (%) - Asian
Geographical mobility - Moved from different county within same state (%) - Hispanic or Latino
Geographical mobility - Moved from different county within same state (%) - American Indian and Alaska Native
Geographical mobility - Moved from different county within same state (%) - Multirace
Geographical mobility - Moved from different county within same state (%) - Other Race
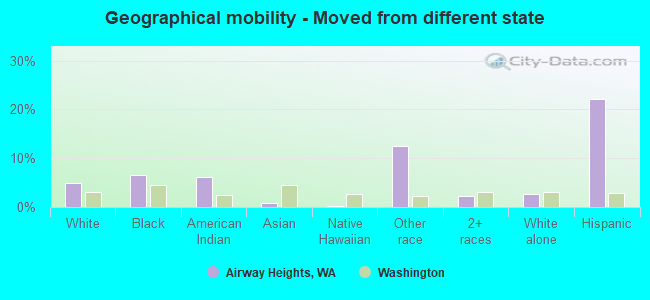
Geographical mobility - Moved from different state (%)
Geographical mobility - Moved from different state (%) - White
Geographical mobility - Moved from different state (%) - Black or African American
Geographical mobility - Moved from different state (%) - Asian
Geographical mobility - Moved from different state (%) - Hispanic or Latino
Geographical mobility - Moved from different state (%) - American Indian and Alaska Native
Geographical mobility - Moved from different state (%) - Multirace
Geographical mobility - Moved from different state (%) - Other Race
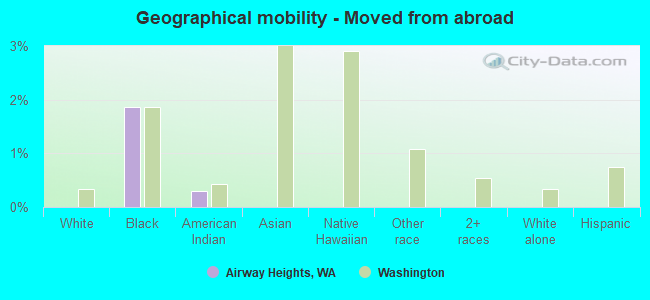
Geographical mobility - Moved from abroad (%)
Geographical mobility - Moved from abroad (%) - White
Geographical mobility - Moved from abroad (%) - Black or African American
Geographical mobility - Moved from abroad (%) - Asian
Geographical mobility - Moved from abroad (%) - Hispanic or Latino
Geographical mobility - Moved from abroad (%) - American Indian and Alaska Native
Geographical mobility - Moved from abroad (%) - Multirace
Geographical mobility - Moved from abroad (%) - Other Race
Place of birth for the foreign-born population - Ireland (%)
Place of birth for the foreign-born population - Denmark (%)
Place of birth for the foreign-born population - Norway (%)
Place of birth for the foreign-born population - Sweden (%)
Place of birth for the foreign-born population - United Kingdom (%)
Place of birth for the foreign-born population - England (%)
Place of birth for the foreign-born population - Scotland (%)
Place of birth for the foreign-born population - Other Northern Europe (%)
Place of birth for the foreign-born population - Austria (%)
Place of birth for the foreign-born population - Belgium (%)
Place of birth for the foreign-born population - France (%)
Place of birth for the foreign-born population - Germany (%)
Place of birth for the foreign-born population - Netherlands (%)
Place of birth for the foreign-born population - Switzerland (%)
Place of birth for the foreign-born population - Other Western Europe (%)
Place of birth for the foreign-born population - Greece (%)
Place of birth for the foreign-born population - Italy (%)
Place of birth for the foreign-born population - Portugal (%)
Place of birth for the foreign-born population - Spain (%)
Place of birth for the foreign-born population - Other Southern Europe (%)
Place of birth for the foreign-born population - Albania (%)
Place of birth for the foreign-born population - Belarus (%)
Place of birth for the foreign-born population - Bosnia and Herzegovina (%)
Place of birth for the foreign-born population - Bulgaria (%)
Place of birth for the foreign-born population - Croatia (%)
Place of birth for the foreign-born population - Czechoslovakia (%)
Place of birth for the foreign-born population - Hungary (%)
Place of birth for the foreign-born population - Latvia (%)
Place of birth for the foreign-born population - Lithuania (%)
Place of birth for the foreign-born population - North Macedonia (Macedonia) (%)
Place of birth for the foreign-born population - Moldova (%)
Place of birth for the foreign-born population - Poland (%)
Place of birth for the foreign-born population - Romania (%)
Place of birth for the foreign-born population - Russia (%)
Place of birth for the foreign-born population - Serbia (%)
Place of birth for the foreign-born population - Ukraine (%)
Place of birth for the foreign-born population - Other Eastern Europe (%)
Place of birth for the foreign-born population - China (%)
Place of birth for the foreign-born population - Hong Kong (%)
Place of birth for the foreign-born population - Taiwan (%)
Place of birth for the foreign-born population - Japan (%)
Place of birth for the foreign-born population - Korea (%)
Place of birth for the foreign-born population - Other Eastern Asia (%)
Place of birth for the foreign-born population - Afghanistan (%)
Place of birth for the foreign-born population - Bangladesh (%)
Place of birth for the foreign-born population - India (%)
Place of birth for the foreign-born population - Iran (%)
Place of birth for the foreign-born population - Kazakhstan (%)
Place of birth for the foreign-born population - Nepal (%)
Place of birth for the foreign-born population - Pakistan (%)
Place of birth for the foreign-born population - Sri Lanka (%)
Place of birth for the foreign-born population - Uzbekistan (%)
Place of birth for the foreign-born population - Other South Central Asia (%)
Place of birth for the foreign-born population - Burma (%)
Place of birth for the foreign-born population - Cambodia (%)
Place of birth for the foreign-born population - Indonesia (%)
Place of birth for the foreign-born population - Laos (%)
Place of birth for the foreign-born population - Malaysia (%)
Place of birth for the foreign-born population - Philippines (%)
Place of birth for the foreign-born population - Singapore (%)
Place of birth for the foreign-born population - Thailand (%)
Place of birth for the foreign-born population - Vietnam (%)
Place of birth for the foreign-born population - Other South Eastern Asia (%)
Place of birth for the foreign-born population - Armenia (%)
Place of birth for the foreign-born population - Iraq (%)
Place of birth for the foreign-born population - Israel (%)
Place of birth for the foreign-born population - Jordan (%)
Place of birth for the foreign-born population - Kuwait (%)
Place of birth for the foreign-born population - Lebanon (%)
Place of birth for the foreign-born population - Saudi Arabia (%)
Place of birth for the foreign-born population - Syria (%)
Place of birth for the foreign-born population - Turkey (%)
Place of birth for the foreign-born population - Yemen (%)
Place of birth for the foreign-born population - Other Western Asia (%)
Place of birth for the foreign-born population - Eritrea (%)
Place of birth for the foreign-born population - Ethiopia (%)
Place of birth for the foreign-born population - Kenya (%)
Place of birth for the foreign-born population - Somalia (%)
Place of birth for the foreign-born population - Uganda (%)
Place of birth for the foreign-born population - Zimbabwe (%)
Place of birth for the foreign-born population - Other Eastern Africa (%)
Place of birth for the foreign-born population - Cameroon (%)
Place of birth for the foreign-born population - Congo (%)
Place of birth for the foreign-born population - Democratic Republic of Congo (Zaire) (%)
Place of birth for the foreign-born population - Other Middle Africa (%)
Place of birth for the foreign-born population - Egypt (%)
Place of birth for the foreign-born population - Morocco (%)
Place of birth for the foreign-born population - Sudan (%)
Place of birth for the foreign-born population - Other Northern Africa (%)
Place of birth for the foreign-born population - South Africa (%)
Place of birth for the foreign-born population - Other Southern Africa (%)
Place of birth for the foreign-born population - Cabo Verde (%)
Place of birth for the foreign-born population - Ghana (%)
Place of birth for the foreign-born population - Liberia (%)
Place of birth for the foreign-born population - Nigeria (%)
Place of birth for the foreign-born population - Senegal (%)
Place of birth for the foreign-born population - Sierra Leone (%)
Place of birth for the foreign-born population - Other Western Africa (%)
Place of birth for the foreign-born population - Australia (%)
Place of birth for the foreign-born population - New Zealand (%)
Place of birth for the foreign-born population - Fiji (%)
Place of birth for the foreign-born population - Micronesia (%)
Place of birth for the foreign-born population - Bahamas (%)
Place of birth for the foreign-born population - Barbados (%)
Place of birth for the foreign-born population - Cuba (%)
Place of birth for the foreign-born population - Dominica (%)
Place of birth for the foreign-born population - Dominican Republic (%)
Place of birth for the foreign-born population - Grenada (%)
Place of birth for the foreign-born population - Haiti (%)
Place of birth for the foreign-born population - Jamaica (%)
Place of birth for the foreign-born population - St. Vincent and the Grenadines (%)
Place of birth for the foreign-born population - Trinidad and Tobago (%)
Place of birth for the foreign-born population - West Indies (%)
Place of birth for the foreign-born population - Other Caribbean (%)
Place of birth for the foreign-born population - Belize (%)
Place of birth for the foreign-born population - Costa Rica (%)
Place of birth for the foreign-born population - El Salvador (%)
Place of birth for the foreign-born population - Guatemala (%)
Place of birth for the foreign-born population - Honduras (%)
Place of birth for the foreign-born population - Mexico (%)
Place of birth for the foreign-born population - Nicaragua (%)
Place of birth for the foreign-born population - Panama (%)
Place of birth for the foreign-born population - Other Central America (%)
Place of birth for the foreign-born population - Argentina (%)
Place of birth for the foreign-born population - Bolivia (%)
Place of birth for the foreign-born population - Brazil (%)
Place of birth for the foreign-born population - Chile (%)
Place of birth for the foreign-born population - Colombia (%)
Place of birth for the foreign-born population - Ecuador (%)
Place of birth for the foreign-born population - Guyana (%)
Place of birth for the foreign-born population - Peru (%)
Place of birth for the foreign-born population - Uruguay (%)
Place of birth for the foreign-born population - Venezuela (%)
Place of birth for the foreign-born population - Other South America (%)
Place of birth for the foreign-born population - Canada (%)
Place of birth for the foreign-born population - Other Northern America (%)
Place of birth for the foreign-born population - Other (%)
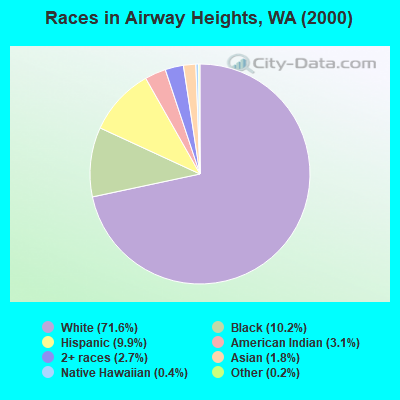
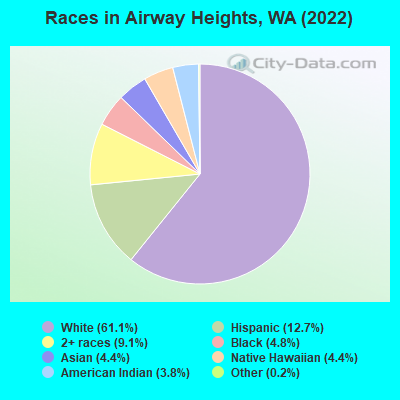
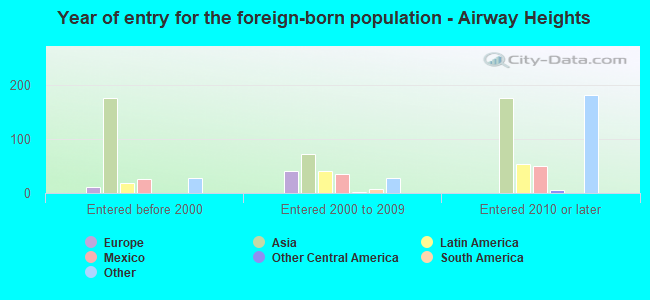
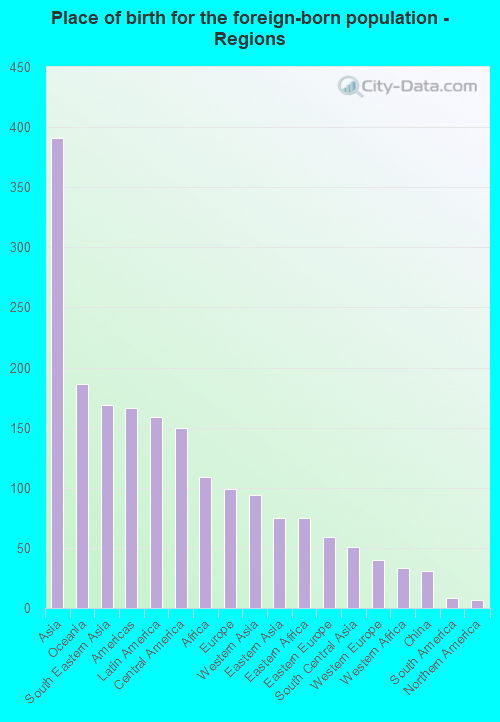
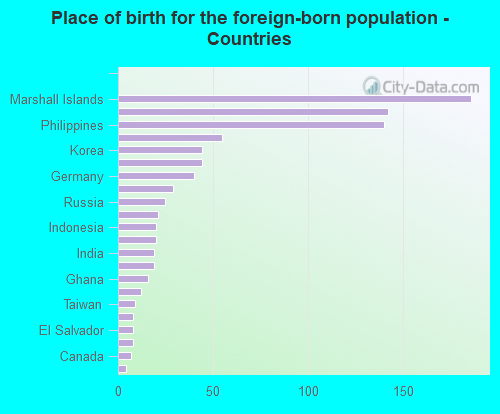
According to 2022 data, the most numerous races in Airway Heights, WA are White alone (6,585 residents), Hispanic (1,367 residents), and Asian alone (476 residents). 86.1% of Airway Heights residents speak English at home. 8.8% of Airway Heights, WA residents are foreign-born (3.6% born in Asia, 1.7% born in Oceania, 1.4% born in Latin America, 1.0% born in Africa, 0.9% born in Europe), which is 69.8% less than the foreign-born rate of 15.0% across the entire state of Washington.
Race distribution in Airway Heights
2000 2022
4,652,490 78.9% White alone 441,509 7.5% Hispanic 319,401 5.4% Asian alone 184,631 3.1% Black alone 175,926 3.0% Two or more races 85,396 1.4% American Indian alone 22,779 0.4% Native Hawaiian and Other 11,989 0.2% Other race alone
4,941,456 63.5% White alone 1,093,313 14.0% Hispanic 755,832 9.7% Asian alone 523,448 6.7% Two or more races 299,537 3.8% Black alone 69,024 0.9% American Indian alone 52,231 0.7% Native Hawaiian and Other 50,945 0.7% Other race alone
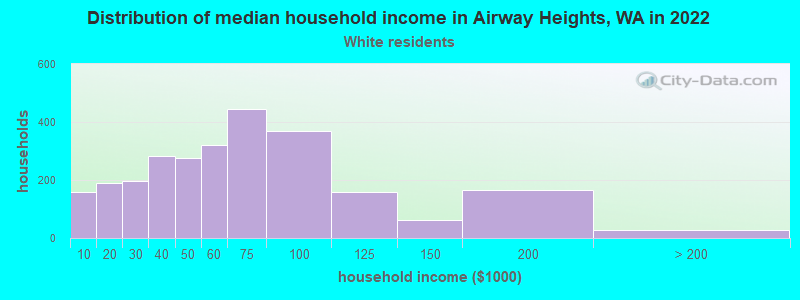
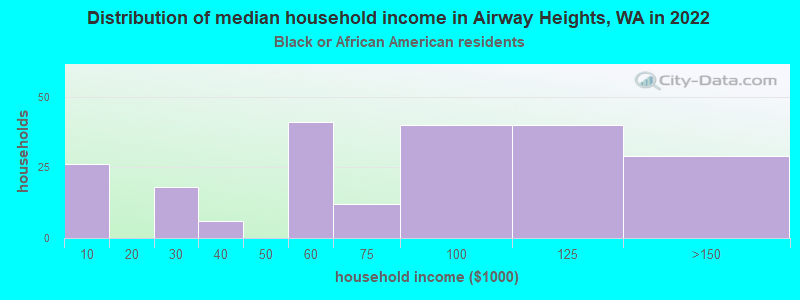
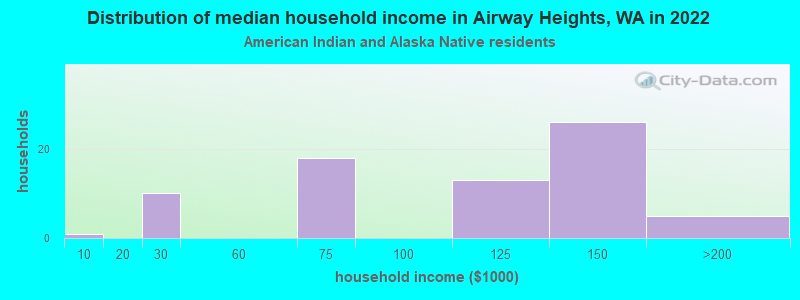
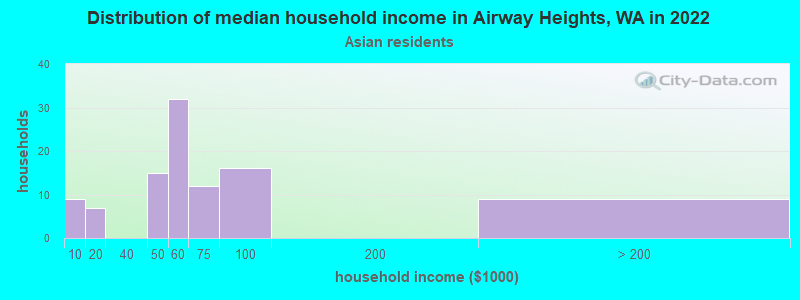
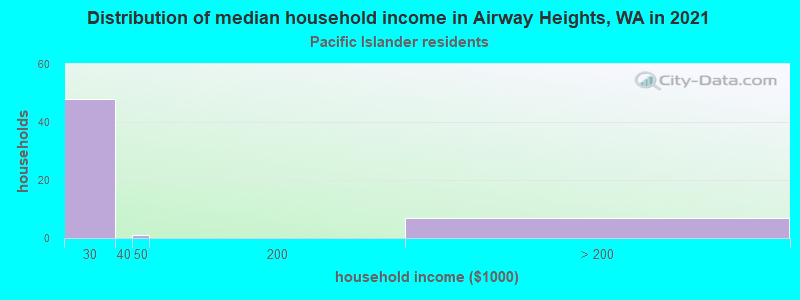
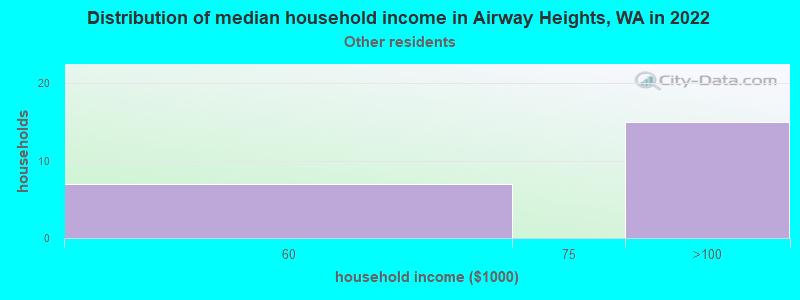
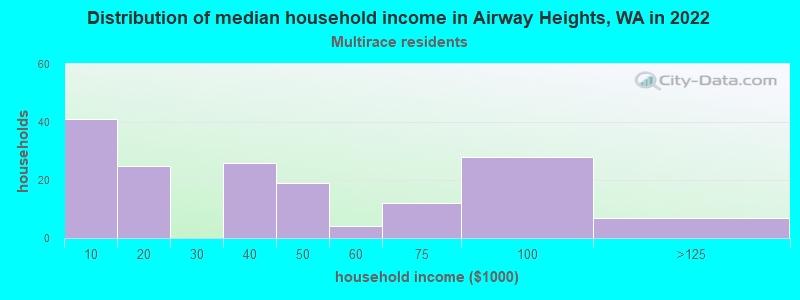
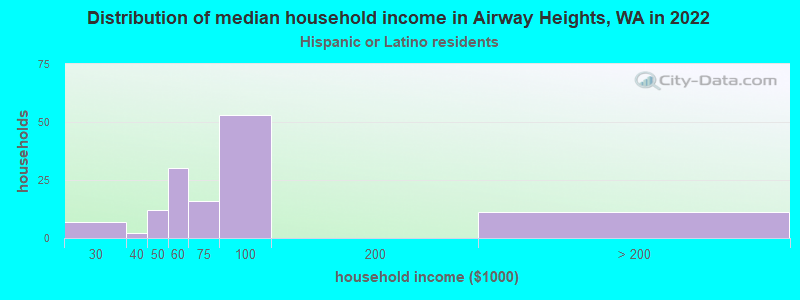
Income and house value in Airway Heights Median household income in 2022 $57,384 White non-Hispanic householders$77,320 Black householders$124,530 American Indian and Alaska Native householders$71,298 Asian householders$25,862 Native Hawaiian and other Pacific Islander householders$31,533 Two or more races householders$78,454 Hispanic or Latino race householdersMedian 2022 house value $386,009 White Non-Hispanic householders$473,079 Black or African American householders $366,108 Asian householders$93,289 Some other race householders$466,445 Two or more races householders$93,289 Hispanic or Latino householders
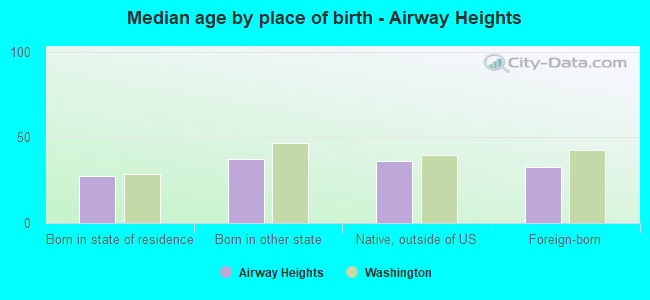
Median age by race in Airway Heights
33.2 Median age for White residents32.2 34.4 37.7 Median age for Black or African American residents46.5 35.5 28.5 Median age for American Indian / Alaska Native residents31.0 19.8 44.7 Median age for Asian residents36.9 44.4 23.9 Median age for Native Hawaiian / Pacific Islander residents7.7 25.5 39.1 Median age for Other race residents40.7 30.0 32.0 Median age for Two or more races residents34.9 25.3 34.3 Median age for White alone residents32.8 35.7 28.7 Median age for Hispanic or Latino residents32.0 12.1
Owner/renter occupied households by race in Airway Heights
House owners and renters - White residents 1,045 39.3% Owner occupied1,613 60.7% Renter occupiedHouse owners and renters - Black or African American residents 56 26.9% Owner occupied153 73.1% Renter occupiedHouse owners and renters - American Indian / Alaska Native residents 18 29.9% Owner occupied43 70.1% Renter occupiedHouse owners and renters - Asian residents 54 51.6% Owner occupied51 48.4% Renter occupiedHouse owners and renters - Native Hawaiian / Pacific Islander residents 135 100.0% Renter occupiedHouse owners and renters - Other race residents 21 100.0% Renter occupiedHouse owners and renters - Two or more races residents 54 30.3% Owner occupied125 69.7% Renter occupiedHouse owners and renters - White alone residents 1,022 39.3% Owner occupied1,581 60.7% Renter occupiedHouse owners and renters - Hispanic or Latino residents 46 34.2% Owner occupied88 65.8% Renter occupied
Language usage in Airway Heights
English speakers - Total 86.1% of residents of Airway Heights speak English at home.
4.4% of residents speak Spanish at home 281 64.9% Speak English very well152 35.1% Speak English less than very well9.1% of residents speak other language at home 654 72.5% Speak English very well248 27.5% Speak English less than very well
English speakers - Born in the United States 93.6% of residents of Airway Heights speak English at home.
3.7% of residents speak Spanish at home 127 93.4% Speak English very well9 6.6% Speak English less than very well1.7% of residents speak other language at home 63 100.0% Speak English very well
English speakers - Native, born elsewhere 50.9% of residents of Airway Heights speak English at home.
4.3% of residents speak Spanish at home 10 100.0% Speak English very well42.3% of residents speak other language at home 48 48.5% Speak English very well51 51.5% Speak English less than very well
English speakers - Foreign-born 28.9% of residents of Airway Heights speak English at home.
9.7% of residents speak Spanish at home 33 37.5% Speak English very well55 62.5% Speak English less than very well57.3% of residents speak other language at home 335 64.7% Speak English very well183 35.3% Speak English less than very well
White (Caucasian) - Speak only English Native:
96.4% (5,989)Foreign-born:
2.7% (8)
White (Caucasian) - Speak another language Native:
3.6% (224)Foreign-born:
91.6% (271)
Black or African American - Speak only English Native:
100.0% (529)Foreign-born:
36.5% (37)
Asian - Speak only English Native:
42.5% (70)Foreign-born:
25.0% (73)
Asian - Speak another language Native:
46.2% (76)Foreign-born:
75.1% (218)
Native Hawaiian / Pacific Islander - Speak only English Native:
56.5% (92)Foreign-born:
26.9% (56)
Native Hawaiian / Pacific Islander - Speak another language Native:
45.2% (73)Foreign-born:
36.6% (76)
Other race - Speak another language Native:
59.5% (127)Foreign-born:
81.4% (26)
Two or more races - Speak only English Native:
92.7% (1,220)Foreign-born:
34.5% (5)
Two or more races - Speak another language Native:
7.3% (97)Foreign-born:
66.6% (9)
White alone - Speak only English Native:
97.8% (5,793)Foreign-born:
3.6% (8)
White alone - Speak another language Native:
2.2% (133)Foreign-born:
91.7% (210)
Hispanic or Latino - Speak only English Native:
66.5% (646)Foreign-born:
5.3% (6)
Hispanic or Latino - Speak another language Native:
31.3% (304)Foreign-born:
89.0% (93)
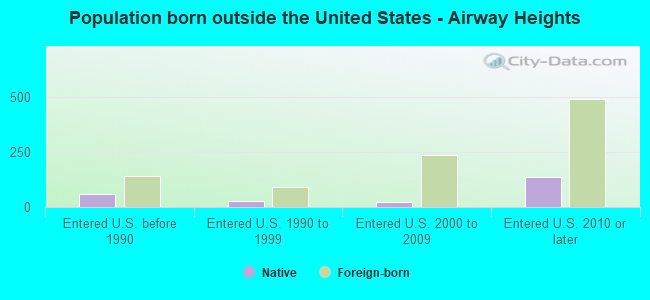
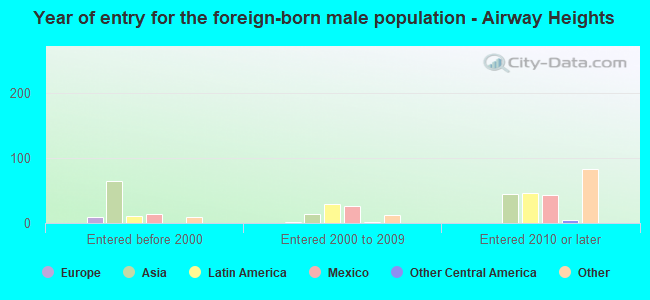
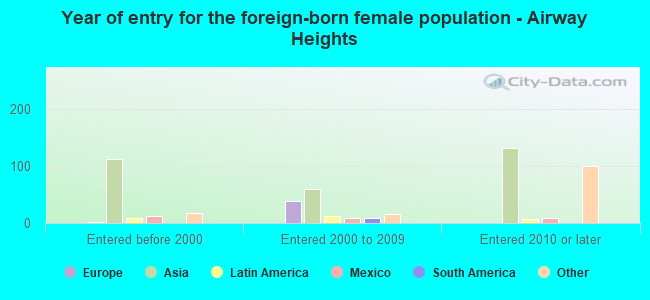
Foreign-born residents in Airway Heights 953 residents are foreign born (3.6% Asia , 1.7% Oceania , 1.4% Latin America , 1.0% Africa , 0.9% Europe ).
This city:
8.8%Washington:
14.9%
Marital status for residents in Airway Heights Marital status - White (Caucasian) population 15 years and over
Males 50.3% Never married28.6% Now married3.0% Separated2.2% Widowed15.9% DivorcedFemales 29.3% Never married38.6% Now married3.4% Separated7.3% Widowed21.3% DivorcedWomen who gave birth in the past 12 months Now married:
35.9% (33)Unmarried:
64.1% (59)
Women who did not give birth in the past 12 months Now married:
42.0% (609)Unmarried:
58.0% (841)
Marital status - Black or African American population 15 years and over
Males 34.6% Never married51.7% Now married1.5% Separated0.0% Widowed12.2% DivorcedFemales 50.2% Never married20.3% Now married0.9% Separated4.8% Widowed23.8% DivorcedWomen who gave birth in the past 12 months Now married:
17.9% (5)Unmarried:
82.1% (23)
Women who did not give birth in the past 12 months Now married:
29.9% (44)Unmarried:
70.1% (103)
Marital status - American Indian / Alaska Native population 15 years and over
Males 63.7% Never married29.0% Now married4.1% Separated0.0% Widowed3.2% DivorcedFemales 73.2% Never married4.7% Now married13.4% Separated0.0% Widowed8.7% DivorcedWomen who gave birth in the past 12 months Now married:
0.0% (0)Unmarried:
100.0% (19)
Women who did not give birth in the past 12 months Now married:
6.1% (6)Unmarried:
93.9% (91)
Marital status - Asian population 15 years and over
Males 42.5% Never married41.9% Now married0.0% Separated0.0% Widowed15.6% DivorcedFemales 12.5% Never married79.7% Now married0.0% Separated4.7% Widowed3.0% DivorcedWomen who gave birth in the past 12 months Now married:
100.0% (9)Unmarried:
0.0% (0)
Women who did not give birth in the past 12 months Now married:
72.1% (96)Unmarried:
27.9% (37)
Marital status - Native Hawaiian / Pacific Islander population 15 years and over
Males 80.0% Never married20.0% Now married0.0% Separated0.0% Widowed0.0% DivorcedFemales 87.6% Never married10.9% Now married0.0% Separated1.6% Widowed0.0% DivorcedWomen who gave birth in the past 12 months Now married:
3.1% (2)Unmarried:
96.9% (67)
Women who did not give birth in the past 12 months Now married:
19.0% (13)Unmarried:
81.0% (55)
Marital status - Other race population 15 years and over
Males 58.0% Never married7.4% Now married14.8% Separated4.5% Widowed15.3% DivorcedFemales 77.4% Never married22.6% Now married0.0% Separated0.0% Widowed0.0% DivorcedWomen who did not give birth in the past 12 months Now married:
0.0% (0)Unmarried:
100.0% (28)
Marital status - Two or more races population 15 years and over
Males 45.0% Never married36.1% Now married3.2% Separated0.0% Widowed15.8% DivorcedFemales 38.3% Never married53.4% Now married0.0% Separated0.0% Widowed8.3% DivorcedWomen who gave birth in the past 12 months Now married:
100.0% (7)Unmarried:
0.0% (0)
Women who did not give birth in the past 12 months Now married:
49.0% (65)Unmarried:
51.0% (68)
Marital status - White alone, not Hispanic / Latino population 15 years and over
Males 50.4% Never married28.2% Now married2.9% Separated2.4% Widowed16.1% DivorcedFemales 29.5% Never married38.8% Now married3.4% Separated7.5% Widowed20.7% DivorcedWomen who gave birth in the past 12 months Now married:
35.9% (33)Unmarried:
64.1% (59)
Women who did not give birth in the past 12 months Now married:
42.4% (593)Unmarried:
57.6% (806)
Marital status - Hispanic or Latino population 15 years and over
Males 50.7% Never married27.4% Now married5.3% Separated1.2% Widowed15.4% DivorcedFemales 53.4% Never married31.0% Now married0.0% Separated0.0% Widowed15.5% DivorcedWomen who gave birth in the past 12 months Now married:
34.3% (13)Unmarried:
65.7% (25)
Women who did not give birth in the past 12 months Now married:
16.4% (21)Unmarried:
83.6% (106)
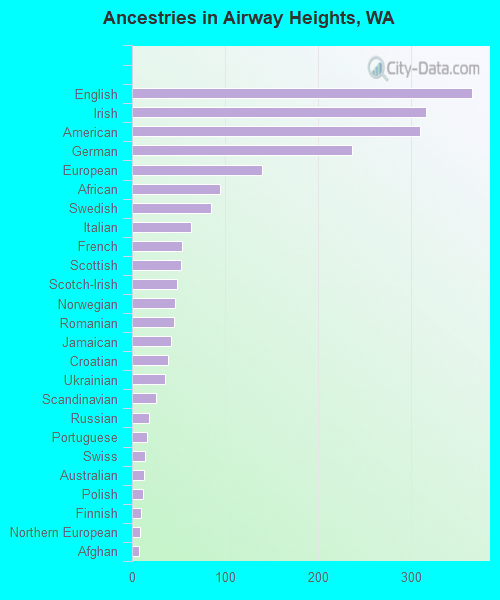
Ancestries in Airway Heights
366 8.1% English317 7.0% Irish310 6.9% American237 5.3% German140 3.1% European95 2.1% African85 1.9% Swedish63 1.4% Italian54 1.2% French53 1.2% Scottish48 1.1% Scotch-Irish46 1.0% Norwegian45 1.0% Romanian42 0.9% Jamaican39 0.9% Croatian35 0.8% Ukrainian26 0.6% Scandinavian18 0.4% Russian16 0.4% Portuguese14 0.3% Swiss13 0.3% Australian12 0.3% Polish10 0.2% Finnish9 0.2% Northern European7 0.2% Afghan7 0.2% Eastern European6 0.1% Danish6 0.1% Slavic3 0.07% Nigerian2 0.04% Haitian
Children Nativity (place of birth) in Airway Heights
Children under 6 years - Living with two parents Both parents native 363 100.0% NativeBoth parents foreign-born 34 91.1% Native3 8.9% Foreign-bornOne native, one foreign-born parent 17 100.0% NativeChildren under 6 years - Living with one parent Native parent 494 100.0% NativeForeign-born parent 157 100.0% NativeChildren 6 to 17 years - Living with two parents Both parents native 390 100.0% NativeBoth parents foreign-born 47 91.5% Native4 8.5% Foreign-bornOne native, one foreign-born parent 56 71.7% Native22 28.3% Foreign-bornChildren 6 to 17 years - Living with one parent Native parent 350 100.0% NativeForeign-born parent 358 61.6% Native223 38.4% Foreign-born
Grandparents responsible for own grandchildren in Airway Heights
Grandparents (30 to 59 years) White / Caucasian 7 100.0% Responsible for grandchildrenAmerican Indian / Alaska Native 9 100.0% Not responsible for grandchildrenWhite alone, not Hispanic / Latino 7 100.0% Responsible for grandchildrenGrandparents (60 years and over) White / Caucasian 15 39.5% Responsible for grandchildren24 60.5% Not responsible for grandchildrenAmerican Indian / Alaska Native 6 100.0% Not responsible for grandchildrenWhite alone, not Hispanic / Latino 16 40.2% Responsible for grandchildren23 59.8% Not responsible for grandchildren