Races in Alexandria, Louisiana (LA) Detailed Stats
Data:
Races - White alone (%)
Races - White alone (% change since 2000)
Races - Black alone (%)
Races - Black alone (% change since 2000)
Races - American Indian alone (%)
Races - American Indian alone (% change since 2000)
Races - Asian alone (%)
Races - Asian alone (% change since 2000)
Races - Hispanic (%)
Races - Hispanic (% change since 2000)
Races - Native Hawaiian and Other Pacific Islander alone (%)
Races - Native Hawaiian and Other Pacific Islander alone (% change since 2000)
Races - Two or more races(%)
Races - Two or more races(% change since 2000)
Races - Other race alone (%)
Races - Other race alone (% change since 2000)
Racial diversity
Place of birth - Born in state of residence (%)
Place of birth - Born in state of residence (%) - White
Place of birth - Born in state of residence (%) - Black or African American
Place of birth - Born in state of residence (%) - Asian
Place of birth - Born in state of residence (%) - Hispanic or Latino
Place of birth - Born in state of residence (%) - American Indian and Alaska Native
Place of birth - Born in state of residence (%) - Multirace
Place of birth - Born in state of residence (%) - Other Race
Place of birth - Born in other state (%)
Place of birth - Born in other state (%) - White
Place of birth - Born in other state (%) - Black or African American
Place of birth - Born in other state (%) - Asian
Place of birth - Born in other state (%) - Hispanic or Latino
Place of birth - Born in other state (%) - American Indian and Alaska Native
Place of birth - Born in other state (%) - Multirace
Place of birth - Born in other state (%) - Other Race
Place of birth - Native, outside of US (%)
Place of birth - Native, outside of US (%) - White
Place of birth - Native, outside of US (%) - Black or African American
Place of birth - Native, outside of US (%) - Asian
Place of birth - Native, outside of US (%) - Hispanic or Latino
Place of birth - Native, outside of US (%) - American Indian and Alaska Native
Place of birth - Native, outside of US (%) - Multirace
Place of birth - Native, outside of US (%) - Other Race
Place of birth - Foreign born (%)
Place of birth - Foreign born (%) - White
Place of birth - Foreign born (%) - Black or African American
Place of birth - Foreign born (%) - Asian
Place of birth - Foreign born (%) - Hispanic or Latino
Place of birth - Foreign born (%) - American Indian and Alaska Native
Place of birth - Foreign born (%) - Multirace
Place of birth - Foreign born (%) - Other Race
Residents speaking English at home (%)
Residents speaking English at home - Born in the United States (%)
Residents speaking English at home - Native, born elsewhere (%)
Residents speaking English at home - Foreign born (%)
Residents speaking Spanish at home (%)
Residents speaking Spanish at home - Born in the United States (%)
Residents speaking Spanish at home - Native, born elsewhere (%)
Residents speaking Spanish at home - Foreign born (%)
Residents speaking other language at home (%)
Residents speaking other language at home - Born in the United States (%)
Residents speaking other language at home - Native, born elsewhere (%)
Residents speaking other language at home - Foreign born (%)
Marital status - Never married (%)
Marital status - Now married (%)
Marital status - Separated (%)
Marital status - Widowed (%)
Marital status - Divorced (%)
Ancestries Reported - Arab (%)
Ancestries Reported - Czech (%)
Ancestries Reported - Danish (%)
Ancestries Reported - Dutch (%)
Ancestries Reported - English (%)
Ancestries Reported - French (%)
Ancestries Reported - French Canadian (%)
Ancestries Reported - German (%)
Ancestries Reported - Greek (%)
Ancestries Reported - Hungarian (%)
Ancestries Reported - Irish (%)
Ancestries Reported - Italian (%)
Ancestries Reported - Lithuanian (%)
Ancestries Reported - Norwegian (%)
Ancestries Reported - Polish (%)
Ancestries Reported - Portuguese (%)
Ancestries Reported - Russian (%)
Ancestries Reported - Scotch-Irish (%)
Ancestries Reported - Scottish (%)
Ancestries Reported - Slovak (%)
Ancestries Reported - Subsaharan African (%)
Ancestries Reported - Swedish (%)
Ancestries Reported - Swiss (%)
Ancestries Reported - Ukrainian (%)
Ancestries Reported - United States (%)
Ancestries Reported - Welsh (%)
Ancestries Reported - West Indian (%)
Ancestries Reported - Other (%)
Geographical mobility - Same house 1 year ago (%)
Geographical mobility - Same house 1 year ago (%) - White
Geographical mobility - Same house 1 year ago (%) - Black or African American
Geographical mobility - Same house 1 year ago (%) - Asian
Geographical mobility - Same house 1 year ago (%) - Hispanic or Latino
Geographical mobility - Same house 1 year ago (%) - American Indian and Alaska Native
Geographical mobility - Same house 1 year ago (%) - Multirace
Geographical mobility - Same house 1 year ago (%) - Other Race
Geographical mobility - Moved within same county (%)
Geographical mobility - Moved within same county (%) - White
Geographical mobility - Moved within same county (%) - Black or African American
Geographical mobility - Moved within same county (%) - Asian
Geographical mobility - Moved within same county (%) - Hispanic or Latino
Geographical mobility - Moved within same county (%) - American Indian and Alaska Native
Geographical mobility - Moved within same county (%) - Multirace
Geographical mobility - Moved within same county (%) - Other Race
Geographical mobility - Moved from different county within same state (%)
Geographical mobility - Moved from different county within same state (%) - White
Geographical mobility - Moved from different county within same state (%) - Black or African American
Geographical mobility - Moved from different county within same state (%) - Asian
Geographical mobility - Moved from different county within same state (%) - Hispanic or Latino
Geographical mobility - Moved from different county within same state (%) - American Indian and Alaska Native
Geographical mobility - Moved from different county within same state (%) - Multirace
Geographical mobility - Moved from different county within same state (%) - Other Race
Geographical mobility - Moved from different state (%)
Geographical mobility - Moved from different state (%) - White
Geographical mobility - Moved from different state (%) - Black or African American
Geographical mobility - Moved from different state (%) - Asian
Geographical mobility - Moved from different state (%) - Hispanic or Latino
Geographical mobility - Moved from different state (%) - American Indian and Alaska Native
Geographical mobility - Moved from different state (%) - Multirace
Geographical mobility - Moved from different state (%) - Other Race
Geographical mobility - Moved from abroad (%)
Geographical mobility - Moved from abroad (%) - White
Geographical mobility - Moved from abroad (%) - Black or African American
Geographical mobility - Moved from abroad (%) - Asian
Geographical mobility - Moved from abroad (%) - Hispanic or Latino
Geographical mobility - Moved from abroad (%) - American Indian and Alaska Native
Geographical mobility - Moved from abroad (%) - Multirace
Geographical mobility - Moved from abroad (%) - Other Race
Place of birth for the foreign-born population - Ireland (%)
Place of birth for the foreign-born population - Denmark (%)
Place of birth for the foreign-born population - Norway (%)
Place of birth for the foreign-born population - Sweden (%)
Place of birth for the foreign-born population - United Kingdom (%)
Place of birth for the foreign-born population - England (%)
Place of birth for the foreign-born population - Scotland (%)
Place of birth for the foreign-born population - Other Northern Europe (%)
Place of birth for the foreign-born population - Austria (%)
Place of birth for the foreign-born population - Belgium (%)
Place of birth for the foreign-born population - France (%)
Place of birth for the foreign-born population - Germany (%)
Place of birth for the foreign-born population - Netherlands (%)
Place of birth for the foreign-born population - Switzerland (%)
Place of birth for the foreign-born population - Other Western Europe (%)
Place of birth for the foreign-born population - Greece (%)
Place of birth for the foreign-born population - Italy (%)
Place of birth for the foreign-born population - Portugal (%)
Place of birth for the foreign-born population - Spain (%)
Place of birth for the foreign-born population - Other Southern Europe (%)
Place of birth for the foreign-born population - Albania (%)
Place of birth for the foreign-born population - Belarus (%)
Place of birth for the foreign-born population - Bosnia and Herzegovina (%)
Place of birth for the foreign-born population - Bulgaria (%)
Place of birth for the foreign-born population - Croatia (%)
Place of birth for the foreign-born population - Czechoslovakia (%)
Place of birth for the foreign-born population - Hungary (%)
Place of birth for the foreign-born population - Latvia (%)
Place of birth for the foreign-born population - Lithuania (%)
Place of birth for the foreign-born population - North Macedonia (Macedonia) (%)
Place of birth for the foreign-born population - Moldova (%)
Place of birth for the foreign-born population - Poland (%)
Place of birth for the foreign-born population - Romania (%)
Place of birth for the foreign-born population - Russia (%)
Place of birth for the foreign-born population - Serbia (%)
Place of birth for the foreign-born population - Ukraine (%)
Place of birth for the foreign-born population - Other Eastern Europe (%)
Place of birth for the foreign-born population - China (%)
Place of birth for the foreign-born population - Hong Kong (%)
Place of birth for the foreign-born population - Taiwan (%)
Place of birth for the foreign-born population - Japan (%)
Place of birth for the foreign-born population - Korea (%)
Place of birth for the foreign-born population - Other Eastern Asia (%)
Place of birth for the foreign-born population - Afghanistan (%)
Place of birth for the foreign-born population - Bangladesh (%)
Place of birth for the foreign-born population - India (%)
Place of birth for the foreign-born population - Iran (%)
Place of birth for the foreign-born population - Kazakhstan (%)
Place of birth for the foreign-born population - Nepal (%)
Place of birth for the foreign-born population - Pakistan (%)
Place of birth for the foreign-born population - Sri Lanka (%)
Place of birth for the foreign-born population - Uzbekistan (%)
Place of birth for the foreign-born population - Other South Central Asia (%)
Place of birth for the foreign-born population - Burma (%)
Place of birth for the foreign-born population - Cambodia (%)
Place of birth for the foreign-born population - Indonesia (%)
Place of birth for the foreign-born population - Laos (%)
Place of birth for the foreign-born population - Malaysia (%)
Place of birth for the foreign-born population - Philippines (%)
Place of birth for the foreign-born population - Singapore (%)
Place of birth for the foreign-born population - Thailand (%)
Place of birth for the foreign-born population - Vietnam (%)
Place of birth for the foreign-born population - Other South Eastern Asia (%)
Place of birth for the foreign-born population - Armenia (%)
Place of birth for the foreign-born population - Iraq (%)
Place of birth for the foreign-born population - Israel (%)
Place of birth for the foreign-born population - Jordan (%)
Place of birth for the foreign-born population - Kuwait (%)
Place of birth for the foreign-born population - Lebanon (%)
Place of birth for the foreign-born population - Saudi Arabia (%)
Place of birth for the foreign-born population - Syria (%)
Place of birth for the foreign-born population - Turkey (%)
Place of birth for the foreign-born population - Yemen (%)
Place of birth for the foreign-born population - Other Western Asia (%)
Place of birth for the foreign-born population - Eritrea (%)
Place of birth for the foreign-born population - Ethiopia (%)
Place of birth for the foreign-born population - Kenya (%)
Place of birth for the foreign-born population - Somalia (%)
Place of birth for the foreign-born population - Uganda (%)
Place of birth for the foreign-born population - Zimbabwe (%)
Place of birth for the foreign-born population - Other Eastern Africa (%)
Place of birth for the foreign-born population - Cameroon (%)
Place of birth for the foreign-born population - Congo (%)
Place of birth for the foreign-born population - Democratic Republic of Congo (Zaire) (%)
Place of birth for the foreign-born population - Other Middle Africa (%)
Place of birth for the foreign-born population - Egypt (%)
Place of birth for the foreign-born population - Morocco (%)
Place of birth for the foreign-born population - Sudan (%)
Place of birth for the foreign-born population - Other Northern Africa (%)
Place of birth for the foreign-born population - South Africa (%)
Place of birth for the foreign-born population - Other Southern Africa (%)
Place of birth for the foreign-born population - Cabo Verde (%)
Place of birth for the foreign-born population - Ghana (%)
Place of birth for the foreign-born population - Liberia (%)
Place of birth for the foreign-born population - Nigeria (%)
Place of birth for the foreign-born population - Senegal (%)
Place of birth for the foreign-born population - Sierra Leone (%)
Place of birth for the foreign-born population - Other Western Africa (%)
Place of birth for the foreign-born population - Australia (%)
Place of birth for the foreign-born population - New Zealand (%)
Place of birth for the foreign-born population - Fiji (%)
Place of birth for the foreign-born population - Micronesia (%)
Place of birth for the foreign-born population - Bahamas (%)
Place of birth for the foreign-born population - Barbados (%)
Place of birth for the foreign-born population - Cuba (%)
Place of birth for the foreign-born population - Dominica (%)
Place of birth for the foreign-born population - Dominican Republic (%)
Place of birth for the foreign-born population - Grenada (%)
Place of birth for the foreign-born population - Haiti (%)
Place of birth for the foreign-born population - Jamaica (%)
Place of birth for the foreign-born population - St. Vincent and the Grenadines (%)
Place of birth for the foreign-born population - Trinidad and Tobago (%)
Place of birth for the foreign-born population - West Indies (%)
Place of birth for the foreign-born population - Other Caribbean (%)
Place of birth for the foreign-born population - Belize (%)
Place of birth for the foreign-born population - Costa Rica (%)
Place of birth for the foreign-born population - El Salvador (%)
Place of birth for the foreign-born population - Guatemala (%)
Place of birth for the foreign-born population - Honduras (%)
Place of birth for the foreign-born population - Mexico (%)
Place of birth for the foreign-born population - Nicaragua (%)
Place of birth for the foreign-born population - Panama (%)
Place of birth for the foreign-born population - Other Central America (%)
Place of birth for the foreign-born population - Argentina (%)
Place of birth for the foreign-born population - Bolivia (%)
Place of birth for the foreign-born population - Brazil (%)
Place of birth for the foreign-born population - Chile (%)
Place of birth for the foreign-born population - Colombia (%)
Place of birth for the foreign-born population - Ecuador (%)
Place of birth for the foreign-born population - Guyana (%)
Place of birth for the foreign-born population - Peru (%)
Place of birth for the foreign-born population - Uruguay (%)
Place of birth for the foreign-born population - Venezuela (%)
Place of birth for the foreign-born population - Other South America (%)
Place of birth for the foreign-born population - Canada (%)
Place of birth for the foreign-born population - Other Northern America (%)
Place of birth for the foreign-born population - Other (%)
Latest news about races in Alexandria, LA collected exclusively by city-data.com from local newspapers, TV, and radio stations
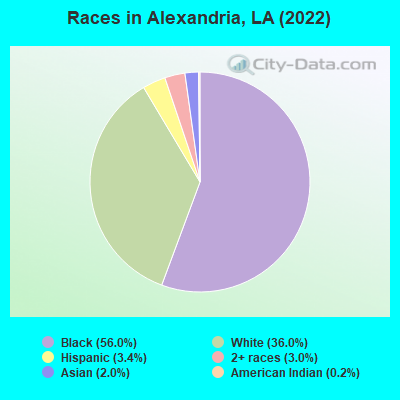
According to 2022 data, the most numerous races in Alexandria, LA are White alone (15,947 residents), Black alone (24,820 residents), and Hispanic (1,506 residents). 94.6% of Alexandria residents speak English at home. 4.0% of Alexandria, LA residents are foreign-born (2.1% born in Asia, 1.3% born in Latin America), which is about the same as the foreign-born rate of 4.0% across the entire state of Louisiana.
Race distribution in Alexandria
2000 2022
2,794,391 62.5% White alone 1,443,390 32.3% Black alone 107,738 2.4% Hispanic 54,256 1.2% Asian alone 39,260 0.9% Two or more races 24,129 0.5% American Indian alone 4,736 0.1% Other race alone 1,076 0.02% Native Hawaiian and Other
2,603,221 56.7% White alone 1,420,055 30.9% Black alone 262,213 5.7% Hispanic 183,270 4.0% Two or more races 81,169 1.8% Asian alone 19,991 0.4% American Indian alone 18,043 0.4% Other race alone 2,279 0.05% Native Hawaiian and Other
Income and house value in Alexandria Median household income in 2022 $77,083 White non-Hispanic householders$37,774 Black householders$90,169 Asian householders$18,903 Two or more races householders$79,248 Hispanic or Latino race householdersMedian 2022 house value $259,004 White Non-Hispanic householders$130,060 Black or African American householders$197,323 American Indian or Alaska Native householders $290,821 Asian householders$187,275 Two or more races householders$141,503 Hispanic or Latino householders
Median age by race in Alexandria
44.2 Median age for White residents44.0 44.2 34.0 Median age for Black or African American residents30.5 38.5 38.4 Median age for American Indian / Alaska Native residents27.3 52.6 42.4 Median age for Asian residents37.6 44.8 -821,138,210.6 Median age for Native Hawaiian / Pacific Islander residents-666,666,666.0 -666,666,666.0 32.3 Median age for Other race residents27.0 33.0 28.6 Median age for Two or more races residents36.5 26.8 45.1 Median age for White alone residents45.5 44.7 25.1 Median age for Hispanic or Latino residents25.2 22.0
Owner/renter occupied households by race in Alexandria
House owners and renters - White residents 4,995 72.0% Owner occupied1,939 28.0% Renter occupiedHouse owners and renters - Black or African American residents 3,798 43.2% Owner occupied4,998 56.8% Renter occupiedHouse owners and renters - American Indian / Alaska Native residents 22 100.0% Owner occupiedHouse owners and renters - Asian residents 313 83.8% Owner occupied61 16.2% Renter occupiedHouse owners and renters - Other race residents 36 20.5% Owner occupied141 79.5% Renter occupiedHouse owners and renters - Two or more races residents 310 76.6% Owner occupied95 23.4% Renter occupiedHouse owners and renters - White alone residents 4,826 71.3% Owner occupied1,946 28.7% Renter occupiedHouse owners and renters - Hispanic or Latino residents 252 62.3% Owner occupied153 37.7% Renter occupied
Language usage in Alexandria
English speakers - Total 94.6% of residents of Alexandria speak English at home.
1.9% of residents speak Spanish at home 388 48.8% Speak English very well407 51.2% Speak English less than very well3.6% of residents speak other language at home 974 64.8% Speak English very well529 35.2% Speak English less than very well
English speakers - Born in the United States 97.0% of residents of Alexandria speak English at home.
1.6% of residents speak Spanish at home 106 97.2% Speak English very well3 2.8% Speak English less than very well1.5% of residents speak other language at home 71 68.9% Speak English very well32 31.1% Speak English less than very well
English speakers - Native, born elsewhere 68.4% of residents of Alexandria speak English at home.
20.3% of residents speak Spanish at home 48 100.0% Speak English very well5.9% of residents speak other language at home 14 100.0% Speak English very well
English speakers - Foreign-born 13.7% of residents of Alexandria speak English at home.
28.7% of residents speak Spanish at home 80 16.4% Speak English very well408 83.6% Speak English less than very well58.6% of residents speak other language at home 619 62.0% Speak English very well379 38.0% Speak English less than very well
White (Caucasian) - Speak only English Native:
97.8% (15,163)Foreign-born:
29.3% (190)
White (Caucasian) - Speak another language Native:
2.1% (324)Foreign-born:
69.8% (453)
Black or African American - Speak another language Native:
0.8% (182)Foreign-born:
100.0% (60)
Asian - Speak only English Native:
60.9% (76)Foreign-born:
9.5% (70)
Asian - Speak another language Native:
34.1% (42)Foreign-born:
91.0% (672)
Other race - Speak another language Native:
34.7% (50)Foreign-born:
100.0% (313)
Two or more races - Speak only English Native:
92.0% (1,579)Foreign-born:
19.1% (35)
Two or more races - Speak another language Native:
7.7% (133)Foreign-born:
76.4% (140)
White alone - Speak only English Native:
97.7% (14,869)Foreign-born:
48.4% (202)
White alone - Speak another language Native:
2.3% (343)Foreign-born:
48.5% (202)
Hispanic or Latino - Speak only English Native:
78.6% (594)Foreign-born:
6.6% (34)
Hispanic or Latino - Speak another language Native:
23.5% (177)Foreign-born:
93.4% (487)
Foreign-born residents in Alexandria 1,792 residents are foreign born (2.1% Asia , 1.3% Latin America ).
This city:
4.0%Louisiana:
4.2%
Marital status for residents in Alexandria Marital status - White (Caucasian) population 15 years and over
Males 32.4% Never married51.5% Now married2.4% Separated3.0% Widowed10.8% DivorcedFemales 26.1% Never married43.4% Now married1.3% Separated9.4% Widowed19.8% DivorcedWomen who gave birth in the past 12 months Now married:
85.8% (198)Unmarried:
14.2% (33)
Women who did not give birth in the past 12 months Now married:
41.0% (1,607)Unmarried:
59.0% (2,311)
Marital status - Black or African American population 15 years and over
Males 57.4% Never married25.0% Now married2.1% Separated1.7% Widowed13.8% DivorcedFemales 47.7% Never married22.6% Now married4.4% Separated10.4% Widowed14.8% DivorcedWomen who gave birth in the past 12 months Now married:
32.9% (149)Unmarried:
67.1% (304)
Women who did not give birth in the past 12 months Now married:
20.9% (1,138)Unmarried:
79.1% (4,313)
Marital status - American Indian / Alaska Native population 15 years and over
Males 21.2% Never married69.2% Now married0.0% Separated0.0% Widowed9.6% DivorcedFemales 19.6% Never married58.9% Now married0.0% Separated21.4% Widowed0.0% DivorcedWomen who did not give birth in the past 12 months Now married:
71.8% (23)Unmarried:
28.2% (9)
Marital status - Asian population 15 years and over
Males 34.7% Never married63.3% Now married0.0% Separated2.0% Widowed0.0% DivorcedFemales 15.1% Never married60.8% Now married0.0% Separated7.8% Widowed16.3% DivorcedWomen who did not give birth in the past 12 months Now married:
68.3% (163)Unmarried:
31.7% (76)
Marital status - Other race population 15 years and over
Males 44.8% Never married55.2% Now married0.0% Separated0.0% Widowed0.0% DivorcedFemales 18.2% Never married67.5% Now married0.0% Separated0.0% Widowed14.3% DivorcedWomen who did not give birth in the past 12 months Now married:
74.5% (44)Unmarried:
25.5% (15)
Marital status - Two or more races population 15 years and over
Males 58.4% Never married28.5% Now married0.0% Separated6.4% Widowed6.6% DivorcedFemales 59.9% Never married13.6% Now married2.3% Separated17.7% Widowed6.6% DivorcedWomen who did not give birth in the past 12 months Now married:
11.2% (47)Unmarried:
88.8% (373)
Marital status - White alone, not Hispanic / Latino population 15 years and over
Males 33.0% Never married50.9% Now married2.5% Separated3.0% Widowed10.7% DivorcedFemales 26.1% Never married43.3% Now married1.4% Separated9.5% Widowed19.7% DivorcedWomen who gave birth in the past 12 months Now married:
85.8% (194)Unmarried:
14.2% (32)
Women who did not give birth in the past 12 months Now married:
41.3% (1,552)Unmarried:
58.7% (2,209)
Marital status - Hispanic or Latino population 15 years and over
Males 28.5% Never married64.6% Now married0.0% Separated1.0% Widowed5.9% DivorcedFemales 43.4% Never married36.3% Now married0.0% Separated9.4% Widowed10.9% DivorcedWomen who did not give birth in the past 12 months Now married:
31.0% (81)Unmarried:
69.0% (181)
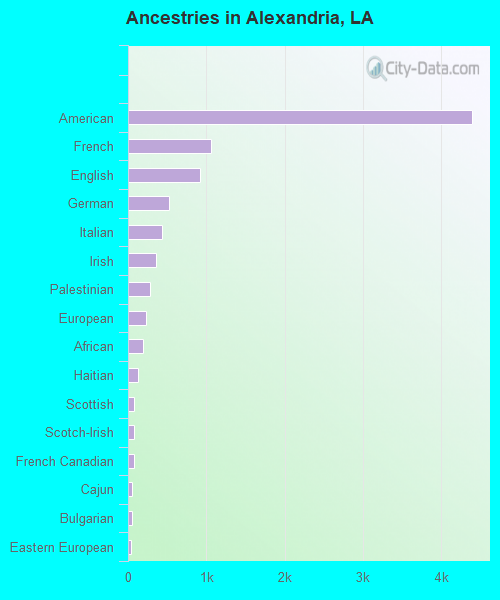
Ancestries in Alexandria
4,392 14.0% American1,061 3.4% French926 2.9% English528 1.7% German430 1.4% Italian355 1.1% Irish277 0.9% Palestinian235 0.7% European197 0.6% African127 0.4% Haitian80 0.3% Scottish79 0.3% Scotch-Irish71 0.2% French Canadian56 0.2% Cajun54 0.2% Bulgarian41 0.1% Eastern European39 0.1% Polish36 0.1% Hungarian34 0.1% Jordanian34 0.1% Scandinavian27 0.09% Turkish25 0.08% Ethiopian23 0.07% British23 0.07% Swedish21 0.07% Norwegian20 0.06% Russian20 0.06% Kenyan14 0.04% Swiss10 0.03% Czechoslovakian6 0.02% Belgian6 0.02% Romanian4 0.01% Brazilian
Geographical mobility in Alexandria Same house 1 year ago 14,105 85.0% White (Caucasian)21,238 86.8% Black or African American148 85.1% American Indian / Alaska Native709 81.9% Asian354 75.6% Other race1,834 86.8% Two or more races13,560 84.9% White alone, not Hispanic / Latino1,210 82.9% Hispanic or LatinoMoved within same county 1,020 6.2% White / Caucasian1,701 7.0% Black or African American22 12.4% American Indian / Alaska Native100 21.4% Other race187 8.9% Two or more races973 6.1% White alone, not Hispanic / Latino231 15.8% Hispanic or LatinoMoved within same state 983 5.9% White / Caucasian1,078 4.4% Black or African American42 2.0% Two or more races1,001 6.3% White alone, not Hispanic / LatinoMoved from different state 567 3.4% White / Caucasian313 1.3% Black or African American200 23.1% Asian37 1.7% Two or more races566 3.5% White alone, not Hispanic / Latino5 0.3% Hispanic or LatinoMoved from abroad 49 0.3% White9 1.0% Asian7 0.3% Two or more races52 0.3% White alone, not Hispanic / Latino
Children Nativity (place of birth) in Alexandria
Children under 6 years - Living with two parents Both parents native 1,160 100.0% NativeBoth parents foreign-born 79 79.3% Native21 20.7% Foreign-bornChildren under 6 years - Living with one parent Native parent 1,492 100.0% Native0 0.0% Foreign-bornForeign-born parent 22 90.2% Native2 9.8% Foreign-bornChildren 6 to 17 years - Living with two parents Both parents native 2,885 100.0% NativeBoth parents foreign-born 192 58.1% Native138 41.9% Foreign-bornOne native, one foreign-born parent 79 100.0% NativeChildren 6 to 17 years - Living with one parent Native parent 3,483 99.3% Native24 0.7% Foreign-bornForeign-born parent 23 100.0% Native
Grandparents responsible for own grandchildren in Alexandria
Grandparents (30 to 59 years) White / Caucasian 11 6.3% Responsible for grandchildren159 93.7% Not responsible for grandchildrenBlack or African American 103 32.4% Responsible for grandchildren215 67.6% Not responsible for grandchildrenAsian 1 98.3% Not responsible for grandchildrenWhite alone, not Hispanic / Latino 11 6.1% Responsible for grandchildren168 93.9% Not responsible for grandchildrenHispanic or Latino 3 100.0% Responsible for grandchildrenGrandparents (60 years and over) White / Caucasian 53 61.2% Responsible for grandchildren34 38.8% Not responsible for grandchildrenBlack or African American 50 24.7% Responsible for grandchildren152 75.3% Not responsible for grandchildrenAsian 5 100.0% Responsible for grandchildrenWhite alone, not Hispanic / Latino 45 56.5% Responsible for grandchildren35 43.5% Not responsible for grandchildrenHispanic or Latino 8 21.5% Responsible for grandchildren30 78.5% Not responsible for grandchildren