Races in Algona, Washington (WA) Detailed Stats
Data:
Races - White alone (%)
Races - White alone (% change since 2000)
Races - Black alone (%)
Races - Black alone (% change since 2000)
Races - American Indian alone (%)
Races - American Indian alone (% change since 2000)
Races - Asian alone (%)
Races - Asian alone (% change since 2000)
Races - Hispanic (%)
Races - Hispanic (% change since 2000)
Races - Native Hawaiian and Other Pacific Islander alone (%)
Races - Native Hawaiian and Other Pacific Islander alone (% change since 2000)
Races - Two or more races(%)
Races - Two or more races(% change since 2000)
Races - Other race alone (%)
Races - Other race alone (% change since 2000)
Racial diversity
Place of birth - Born in state of residence (%)
Place of birth - Born in state of residence (%) - White
Place of birth - Born in state of residence (%) - Black or African American
Place of birth - Born in state of residence (%) - Asian
Place of birth - Born in state of residence (%) - Hispanic or Latino
Place of birth - Born in state of residence (%) - American Indian and Alaska Native
Place of birth - Born in state of residence (%) - Multirace
Place of birth - Born in state of residence (%) - Other Race
Place of birth - Born in other state (%)
Place of birth - Born in other state (%) - White
Place of birth - Born in other state (%) - Black or African American
Place of birth - Born in other state (%) - Asian
Place of birth - Born in other state (%) - Hispanic or Latino
Place of birth - Born in other state (%) - American Indian and Alaska Native
Place of birth - Born in other state (%) - Multirace
Place of birth - Born in other state (%) - Other Race
Place of birth - Native, outside of US (%)
Place of birth - Native, outside of US (%) - White
Place of birth - Native, outside of US (%) - Black or African American
Place of birth - Native, outside of US (%) - Asian
Place of birth - Native, outside of US (%) - Hispanic or Latino
Place of birth - Native, outside of US (%) - American Indian and Alaska Native
Place of birth - Native, outside of US (%) - Multirace
Place of birth - Native, outside of US (%) - Other Race
Place of birth - Foreign born (%)
Place of birth - Foreign born (%) - White
Place of birth - Foreign born (%) - Black or African American
Place of birth - Foreign born (%) - Asian
Place of birth - Foreign born (%) - Hispanic or Latino
Place of birth - Foreign born (%) - American Indian and Alaska Native
Place of birth - Foreign born (%) - Multirace
Place of birth - Foreign born (%) - Other Race
Residents speaking English at home (%)
Residents speaking English at home - Born in the United States (%)
Residents speaking English at home - Native, born elsewhere (%)
Residents speaking English at home - Foreign born (%)
Residents speaking Spanish at home (%)
Residents speaking Spanish at home - Born in the United States (%)
Residents speaking Spanish at home - Native, born elsewhere (%)
Residents speaking Spanish at home - Foreign born (%)
Residents speaking other language at home (%)
Residents speaking other language at home - Born in the United States (%)
Residents speaking other language at home - Native, born elsewhere (%)
Residents speaking other language at home - Foreign born (%)
Marital status - Never married (%)
Marital status - Now married (%)
Marital status - Separated (%)
Marital status - Widowed (%)
Marital status - Divorced (%)
Ancestries Reported - Arab (%)
Ancestries Reported - Czech (%)
Ancestries Reported - Danish (%)
Ancestries Reported - Dutch (%)
Ancestries Reported - English (%)
Ancestries Reported - French (%)
Ancestries Reported - French Canadian (%)
Ancestries Reported - German (%)
Ancestries Reported - Greek (%)
Ancestries Reported - Hungarian (%)
Ancestries Reported - Irish (%)
Ancestries Reported - Italian (%)
Ancestries Reported - Lithuanian (%)
Ancestries Reported - Norwegian (%)
Ancestries Reported - Polish (%)
Ancestries Reported - Portuguese (%)
Ancestries Reported - Russian (%)
Ancestries Reported - Scotch-Irish (%)
Ancestries Reported - Scottish (%)
Ancestries Reported - Slovak (%)
Ancestries Reported - Subsaharan African (%)
Ancestries Reported - Swedish (%)
Ancestries Reported - Swiss (%)
Ancestries Reported - Ukrainian (%)
Ancestries Reported - United States (%)
Ancestries Reported - Welsh (%)
Ancestries Reported - West Indian (%)
Ancestries Reported - Other (%)
Geographical mobility - Same house 1 year ago (%)
Geographical mobility - Same house 1 year ago (%) - White
Geographical mobility - Same house 1 year ago (%) - Black or African American
Geographical mobility - Same house 1 year ago (%) - Asian
Geographical mobility - Same house 1 year ago (%) - Hispanic or Latino
Geographical mobility - Same house 1 year ago (%) - American Indian and Alaska Native
Geographical mobility - Same house 1 year ago (%) - Multirace
Geographical mobility - Same house 1 year ago (%) - Other Race
Geographical mobility - Moved within same county (%)
Geographical mobility - Moved within same county (%) - White
Geographical mobility - Moved within same county (%) - Black or African American
Geographical mobility - Moved within same county (%) - Asian
Geographical mobility - Moved within same county (%) - Hispanic or Latino
Geographical mobility - Moved within same county (%) - American Indian and Alaska Native
Geographical mobility - Moved within same county (%) - Multirace
Geographical mobility - Moved within same county (%) - Other Race
Geographical mobility - Moved from different county within same state (%)
Geographical mobility - Moved from different county within same state (%) - White
Geographical mobility - Moved from different county within same state (%) - Black or African American
Geographical mobility - Moved from different county within same state (%) - Asian
Geographical mobility - Moved from different county within same state (%) - Hispanic or Latino
Geographical mobility - Moved from different county within same state (%) - American Indian and Alaska Native
Geographical mobility - Moved from different county within same state (%) - Multirace
Geographical mobility - Moved from different county within same state (%) - Other Race
Geographical mobility - Moved from different state (%)
Geographical mobility - Moved from different state (%) - White
Geographical mobility - Moved from different state (%) - Black or African American
Geographical mobility - Moved from different state (%) - Asian
Geographical mobility - Moved from different state (%) - Hispanic or Latino
Geographical mobility - Moved from different state (%) - American Indian and Alaska Native
Geographical mobility - Moved from different state (%) - Multirace
Geographical mobility - Moved from different state (%) - Other Race
Geographical mobility - Moved from abroad (%)
Geographical mobility - Moved from abroad (%) - White
Geographical mobility - Moved from abroad (%) - Black or African American
Geographical mobility - Moved from abroad (%) - Asian
Geographical mobility - Moved from abroad (%) - Hispanic or Latino
Geographical mobility - Moved from abroad (%) - American Indian and Alaska Native
Geographical mobility - Moved from abroad (%) - Multirace
Geographical mobility - Moved from abroad (%) - Other Race
Place of birth for the foreign-born population - Ireland (%)
Place of birth for the foreign-born population - Denmark (%)
Place of birth for the foreign-born population - Norway (%)
Place of birth for the foreign-born population - Sweden (%)
Place of birth for the foreign-born population - United Kingdom (%)
Place of birth for the foreign-born population - England (%)
Place of birth for the foreign-born population - Scotland (%)
Place of birth for the foreign-born population - Other Northern Europe (%)
Place of birth for the foreign-born population - Austria (%)
Place of birth for the foreign-born population - Belgium (%)
Place of birth for the foreign-born population - France (%)
Place of birth for the foreign-born population - Germany (%)
Place of birth for the foreign-born population - Netherlands (%)
Place of birth for the foreign-born population - Switzerland (%)
Place of birth for the foreign-born population - Other Western Europe (%)
Place of birth for the foreign-born population - Greece (%)
Place of birth for the foreign-born population - Italy (%)
Place of birth for the foreign-born population - Portugal (%)
Place of birth for the foreign-born population - Spain (%)
Place of birth for the foreign-born population - Other Southern Europe (%)
Place of birth for the foreign-born population - Albania (%)
Place of birth for the foreign-born population - Belarus (%)
Place of birth for the foreign-born population - Bosnia and Herzegovina (%)
Place of birth for the foreign-born population - Bulgaria (%)
Place of birth for the foreign-born population - Croatia (%)
Place of birth for the foreign-born population - Czechoslovakia (%)
Place of birth for the foreign-born population - Hungary (%)
Place of birth for the foreign-born population - Latvia (%)
Place of birth for the foreign-born population - Lithuania (%)
Place of birth for the foreign-born population - North Macedonia (Macedonia) (%)
Place of birth for the foreign-born population - Moldova (%)
Place of birth for the foreign-born population - Poland (%)
Place of birth for the foreign-born population - Romania (%)
Place of birth for the foreign-born population - Russia (%)
Place of birth for the foreign-born population - Serbia (%)
Place of birth for the foreign-born population - Ukraine (%)
Place of birth for the foreign-born population - Other Eastern Europe (%)
Place of birth for the foreign-born population - China (%)
Place of birth for the foreign-born population - Hong Kong (%)
Place of birth for the foreign-born population - Taiwan (%)
Place of birth for the foreign-born population - Japan (%)
Place of birth for the foreign-born population - Korea (%)
Place of birth for the foreign-born population - Other Eastern Asia (%)
Place of birth for the foreign-born population - Afghanistan (%)
Place of birth for the foreign-born population - Bangladesh (%)
Place of birth for the foreign-born population - India (%)
Place of birth for the foreign-born population - Iran (%)
Place of birth for the foreign-born population - Kazakhstan (%)
Place of birth for the foreign-born population - Nepal (%)
Place of birth for the foreign-born population - Pakistan (%)
Place of birth for the foreign-born population - Sri Lanka (%)
Place of birth for the foreign-born population - Uzbekistan (%)
Place of birth for the foreign-born population - Other South Central Asia (%)
Place of birth for the foreign-born population - Burma (%)
Place of birth for the foreign-born population - Cambodia (%)
Place of birth for the foreign-born population - Indonesia (%)
Place of birth for the foreign-born population - Laos (%)
Place of birth for the foreign-born population - Malaysia (%)
Place of birth for the foreign-born population - Philippines (%)
Place of birth for the foreign-born population - Singapore (%)
Place of birth for the foreign-born population - Thailand (%)
Place of birth for the foreign-born population - Vietnam (%)
Place of birth for the foreign-born population - Other South Eastern Asia (%)
Place of birth for the foreign-born population - Armenia (%)
Place of birth for the foreign-born population - Iraq (%)
Place of birth for the foreign-born population - Israel (%)
Place of birth for the foreign-born population - Jordan (%)
Place of birth for the foreign-born population - Kuwait (%)
Place of birth for the foreign-born population - Lebanon (%)
Place of birth for the foreign-born population - Saudi Arabia (%)
Place of birth for the foreign-born population - Syria (%)
Place of birth for the foreign-born population - Turkey (%)
Place of birth for the foreign-born population - Yemen (%)
Place of birth for the foreign-born population - Other Western Asia (%)
Place of birth for the foreign-born population - Eritrea (%)
Place of birth for the foreign-born population - Ethiopia (%)
Place of birth for the foreign-born population - Kenya (%)
Place of birth for the foreign-born population - Somalia (%)
Place of birth for the foreign-born population - Uganda (%)
Place of birth for the foreign-born population - Zimbabwe (%)
Place of birth for the foreign-born population - Other Eastern Africa (%)
Place of birth for the foreign-born population - Cameroon (%)
Place of birth for the foreign-born population - Congo (%)
Place of birth for the foreign-born population - Democratic Republic of Congo (Zaire) (%)
Place of birth for the foreign-born population - Other Middle Africa (%)
Place of birth for the foreign-born population - Egypt (%)
Place of birth for the foreign-born population - Morocco (%)
Place of birth for the foreign-born population - Sudan (%)
Place of birth for the foreign-born population - Other Northern Africa (%)
Place of birth for the foreign-born population - South Africa (%)
Place of birth for the foreign-born population - Other Southern Africa (%)
Place of birth for the foreign-born population - Cabo Verde (%)
Place of birth for the foreign-born population - Ghana (%)
Place of birth for the foreign-born population - Liberia (%)
Place of birth for the foreign-born population - Nigeria (%)
Place of birth for the foreign-born population - Senegal (%)
Place of birth for the foreign-born population - Sierra Leone (%)
Place of birth for the foreign-born population - Other Western Africa (%)
Place of birth for the foreign-born population - Australia (%)
Place of birth for the foreign-born population - New Zealand (%)
Place of birth for the foreign-born population - Fiji (%)
Place of birth for the foreign-born population - Micronesia (%)
Place of birth for the foreign-born population - Bahamas (%)
Place of birth for the foreign-born population - Barbados (%)
Place of birth for the foreign-born population - Cuba (%)
Place of birth for the foreign-born population - Dominica (%)
Place of birth for the foreign-born population - Dominican Republic (%)
Place of birth for the foreign-born population - Grenada (%)
Place of birth for the foreign-born population - Haiti (%)
Place of birth for the foreign-born population - Jamaica (%)
Place of birth for the foreign-born population - St. Vincent and the Grenadines (%)
Place of birth for the foreign-born population - Trinidad and Tobago (%)
Place of birth for the foreign-born population - West Indies (%)
Place of birth for the foreign-born population - Other Caribbean (%)
Place of birth for the foreign-born population - Belize (%)
Place of birth for the foreign-born population - Costa Rica (%)
Place of birth for the foreign-born population - El Salvador (%)
Place of birth for the foreign-born population - Guatemala (%)
Place of birth for the foreign-born population - Honduras (%)
Place of birth for the foreign-born population - Mexico (%)
Place of birth for the foreign-born population - Nicaragua (%)
Place of birth for the foreign-born population - Panama (%)
Place of birth for the foreign-born population - Other Central America (%)
Place of birth for the foreign-born population - Argentina (%)
Place of birth for the foreign-born population - Bolivia (%)
Place of birth for the foreign-born population - Brazil (%)
Place of birth for the foreign-born population - Chile (%)
Place of birth for the foreign-born population - Colombia (%)
Place of birth for the foreign-born population - Ecuador (%)
Place of birth for the foreign-born population - Guyana (%)
Place of birth for the foreign-born population - Peru (%)
Place of birth for the foreign-born population - Uruguay (%)
Place of birth for the foreign-born population - Venezuela (%)
Place of birth for the foreign-born population - Other South America (%)
Place of birth for the foreign-born population - Canada (%)
Place of birth for the foreign-born population - Other Northern America (%)
Place of birth for the foreign-born population - Other (%)
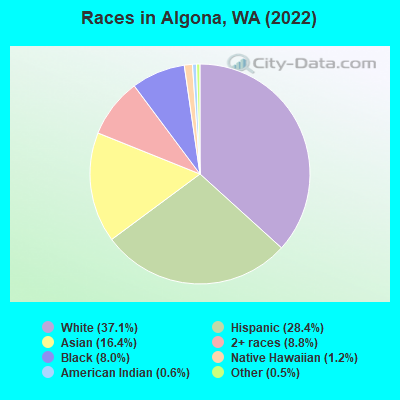
According to 2022 data, the most numerous races in Algona, WA are White alone (1,217 residents), Hispanic (932 residents), and Asian alone (539 residents). 54.1% of Algona residents speak English at home. 29.3% of Algona, WA residents are foreign-born (11.2% born in Asia, 8.2% born in Latin America, 4.0% born in Europe, 3.3% born in Africa), which is 48.7% greater than the foreign-born rate of 15.0% across the entire state of Washington.
Race distribution in Algona
2000 2022
4,652,490 78.9% White alone 441,509 7.5% Hispanic 319,401 5.4% Asian alone 184,631 3.1% Black alone 175,926 3.0% Two or more races 85,396 1.4% American Indian alone 22,779 0.4% Native Hawaiian and Other 11,989 0.2% Other race alone
4,941,456 63.5% White alone 1,093,313 14.0% Hispanic 755,832 9.7% Asian alone 523,448 6.7% Two or more races 299,537 3.8% Black alone 69,024 0.9% American Indian alone 52,231 0.7% Native Hawaiian and Other 50,945 0.7% Other race alone
Income and house value in Algona Median household income in 2022 $83,689 White non-Hispanic householders$120,505 Black householders$76,945 Asian householders$79,868 Some other race householders$90,409 Two or more races householders$74,411 Hispanic or Latino race householdersMedian 2022 house value $389,981 White Non-Hispanic householdersover $1,000,000 Black or African American householders$395,737 American Indian or Alaska Native householders $398,615 Asian householders$323,785 Some other race householders$442,650 Two or more races householders$333,570 Hispanic or Latino householders
Median age by race in Algona
35.6 Median age for White residents35.9 34.9 11.8 Median age for Black or African American residents10.2 14.4 40.8 Median age for American Indian / Alaska Native residents43.4 40.2 37.2 Median age for Asian residents30.9 43.1 49.2 Median age for Native Hawaiian / Pacific Islander residents-664,509,168.7 -651,945,320.1 23.5 Median age for Other race residents41.9 18.5 18.5 Median age for Two or more races residents15.3 22.7 39.4 Median age for White alone residents44.8 37.3 27.0 Median age for Hispanic or Latino residents31.4 22.8
Owner/renter occupied households by race in Algona
House owners and renters - White residents 337 69.8% Owner occupied146 30.2% Renter occupiedHouse owners and renters - Black or African American residents 20 67.7% Owner occupied9 32.3% Renter occupiedHouse owners and renters - American Indian / Alaska Native residents 18 100.0% Owner occupiedHouse owners and renters - Asian residents 157 92.1% Owner occupied13 7.9% Renter occupiedHouse owners and renters - Native Hawaiian / Pacific Islander residents 13 100.0% Owner occupiedHouse owners and renters - Other race residents 98 81.9% Owner occupied22 18.1% Renter occupiedHouse owners and renters - Two or more races residents 105 89.6% Owner occupied12 10.4% Renter occupiedHouse owners and renters - White alone residents 331 77.8% Owner occupied95 22.2% Renter occupiedHouse owners and renters - Hispanic or Latino residents 160 67.5% Owner occupied77 32.5% Renter occupied
Language usage in Algona
English speakers - Total 54.1% of residents of Algona speak English at home.
21.1% of residents speak Spanish at home 398 61.7% Speak English very well247 38.3% Speak English less than very well26.3% of residents speak other language at home 549 68.2% Speak English very well256 31.8% Speak English less than very well
English speakers - Born in the United States 69.1% of residents of Algona speak English at home.
29.8% of residents speak Spanish at home 192 100.0% Speak English very well2.5% of residents speak other language at home 13 81.2% Speak English very well3 18.8% Speak English less than very well
English speakers - Native, born elsewhere 41.1% of residents of Algona speak English at home.
43.5% of residents speak Spanish at home 54 100.0% Speak English very well23.4% of residents speak other language at home 29 100.0% Speak English very well
English speakers - Foreign-born 12.8% of residents of Algona speak English at home.
27.7% of residents speak Spanish at home 58 21.8% Speak English very well208 78.2% Speak English less than very well58.5% of residents speak other language at home 336 59.8% Speak English very well226 40.2% Speak English less than very well
White (Caucasian) - Speak only English Native:
86.8% (1,000)Foreign-born:
25.2% (45)
White (Caucasian) - Speak another language Native:
13.0% (150)Foreign-born:
75.0% (134)
Black or African American - Speak only English Native:
89.0% (137)Foreign-born:
48.2% (56)
Black or African American - Speak another language Native:
11.1% (17)Foreign-born:
57.2% (67)
Asian - Speak only English Native:
41.8% (75)Foreign-born:
5.6% (20)
Asian - Speak another language Native:
60.4% (108)Foreign-born:
94.4% (347)
Other race - Speak only English Native:
15.5% (28)Foreign-born:
3.0% (6)
Other race - Speak another language Native:
83.1% (148)Foreign-born:
97.7% (178)
Two or more races - Speak another language Native:
51.3% (218)Foreign-born:
100.0% (89)
White alone - Speak only English Native:
95.7% (939)Foreign-born:
31.7% (46)
White alone - Speak another language Native:
4.3% (43)Foreign-born:
68.4% (98)
Hispanic or Latino - Speak only English Native:
37.8% (222)Foreign-born:
2.0% (5)
Hispanic or Latino - Speak another language Native:
63.3% (371)Foreign-born:
98.5% (269)
Foreign-born residents in Algona 960 residents are foreign born (11.2% Asia , 8.2% Latin America , 4.0% Europe , 3.3% Africa ).
This city:
29.3%Washington:
14.9%
Marital status for residents in Algona Marital status - White (Caucasian) population 15 years and over
Males 39.7% Never married41.7% Now married0.0% Separated1.7% Widowed16.8% DivorcedFemales 30.7% Never married42.1% Now married1.2% Separated8.0% Widowed18.1% DivorcedWomen who gave birth in the past 12 months Now married:
50.6% (37)Unmarried:
49.4% (36)
Women who did not give birth in the past 12 months Now married:
33.3% (83)Unmarried:
66.7% (166)
Marital status - Black or African American population 15 years and over
Males 40.0% Never married34.7% Now married25.3% Separated0.0% Widowed0.0% DivorcedFemales 45.3% Never married45.3% Now married9.4% Separated0.0% Widowed0.0% DivorcedWomen who did not give birth in the past 12 months Now married:
50.0% (30)Unmarried:
50.0% (30)
Marital status - American Indian / Alaska Native population 15 years and over
Males 100.0% Never married0.0% Now married0.0% Separated0.0% Widowed0.0% DivorcedFemales 27.3% Never married45.5% Now married0.0% Separated27.3% Widowed0.0% DivorcedWomen who did not give birth in the past 12 months Now married:
45.5% (18)Unmarried:
54.5% (22)
Marital status - Asian population 15 years and over
Males 56.4% Never married29.2% Now married0.0% Separated0.0% Widowed14.4% DivorcedFemales 27.6% Never married29.9% Now married0.0% Separated41.2% Widowed1.4% DivorcedWomen who did not give birth in the past 12 months Now married:
36.6% (41)Unmarried:
63.4% (70)
Marital status - Native Hawaiian / Pacific Islander population 15 years and over
Males 0.0% Never married100.0% Now married0.0% Separated0.0% Widowed0.0% DivorcedFemales 0.0% Never married100.0% Now married0.0% Separated0.0% Widowed0.0% DivorcedWomen who did not give birth in the past 12 months Now married:
100.0% (31)Unmarried:
0.0% (0)
Marital status - Other race population 15 years and over
Males 26.4% Never married68.7% Now married0.0% Separated0.0% Widowed4.9% DivorcedFemales 65.7% Never married34.3% Now married0.0% Separated0.0% Widowed0.0% DivorcedWomen who did not give birth in the past 12 months Now married:
31.1% (40)Unmarried:
68.9% (88)
Marital status - Two or more races population 15 years and over
Males 36.4% Never married53.7% Now married0.0% Separated0.0% Widowed9.9% DivorcedFemales 38.6% Never married44.3% Now married0.0% Separated0.0% Widowed17.1% DivorcedWomen who did not give birth in the past 12 months Now married:
36.0% (36)Unmarried:
64.0% (65)
Marital status - White alone, not Hispanic / Latino population 15 years and over
Males 28.0% Never married54.8% Now married0.0% Separated2.4% Widowed14.8% DivorcedFemales 23.4% Never married46.5% Now married1.3% Separated8.9% Widowed20.0% DivorcedWomen who gave birth in the past 12 months Now married:
100.0% (38)Unmarried:
0.0% (0)
Women who did not give birth in the past 12 months Now married:
35.6% (86)Unmarried:
64.4% (155)
Marital status - Hispanic or Latino population 15 years and over
Males 53.0% Never married36.0% Now married0.0% Separated0.0% Widowed11.1% DivorcedFemales 67.3% Never married30.6% Now married0.0% Separated0.0% Widowed2.0% DivorcedWomen who gave birth in the past 12 months Now married:
0.0% (0)Unmarried:
100.0% (41)
Women who did not give birth in the past 12 months Now married:
31.4% (62)Unmarried:
68.6% (136)
Ancestries in Algona
111 5.4% American62 3.0% European62 3.0% Ukrainian49 2.4% Irish47 2.3% German43 2.1% Russian35 1.7% African28 1.4% Latvian25 1.2% Sudanese11 0.5% Norwegian11 0.5% Polish10 0.5% French9 0.4% English6 0.3% Swedish5 0.2% Liberian4 0.2% Romanian4 0.2% Scottish3 0.1% Northern European3 0.1% Kenyan1 0.05% Italian1 0.05% Scotch-Irish
Children Nativity (place of birth) in Algona
Children under 6 years - Living with two parents Both parents native 42 100.0% NativeBoth parents foreign-born 48 100.0% NativeOne native, one foreign-born parent 65 100.0% NativeChildren under 6 years - Living with one parent Native parent 89 100.0% NativeForeign-born parent 26 100.0% NativeChildren 6 to 17 years - Living with two parents Both parents native 65 100.0% NativeBoth parents foreign-born 195 91.8% Native17 8.2% Foreign-bornOne native, one foreign-born parent 67 100.0% NativeChildren 6 to 17 years - Living with one parent Native parent 147 100.0% NativeForeign-born parent 87 52.1% Native80 47.9% Foreign-born
Grandparents responsible for own grandchildren in Algona
Grandparents (30 to 59 years) White / Caucasian 6 22.8% Responsible for grandchildren20 77.2% Not responsible for grandchildrenAsian 7 100.0% Not responsible for grandchildrenNative Hawaiian / Pacific Islander 12 100.0% Not responsible for grandchildrenTwo or more races 4 100.0% Not responsible for grandchildrenWhite alone, not Hispanic / Latino 6 21.0% Responsible for grandchildren22 79.0% Not responsible for grandchildrenGrandparents (60 years and over) White / Caucasian 16 78.0% Responsible for grandchildren4 22.0% Not responsible for grandchildrenAsian 13 76.1% Responsible for grandchildren4 23.9% Not responsible for grandchildrenTwo or more races 9 100.0% Not responsible for grandchildrenWhite alone, not Hispanic / Latino 15 77.6% Responsible for grandchildren4 22.4% Not responsible for grandchildren