Races in Allen Park, Michigan (MI) Detailed Stats
Data:
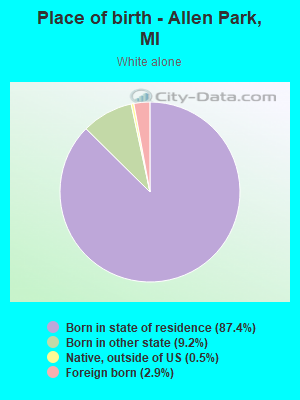
Races - White alone (%)
Races - White alone (% change since 2000)
Races - Black alone (%)
Races - Black alone (% change since 2000)
Races - American Indian alone (%)
Races - American Indian alone (% change since 2000)
Races - Asian alone (%)
Races - Asian alone (% change since 2000)
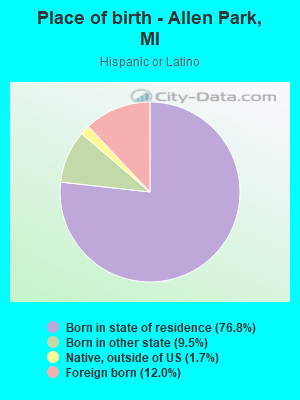
Races - Hispanic (%)
Races - Hispanic (% change since 2000)
Races - Native Hawaiian and Other Pacific Islander alone (%)
Races - Native Hawaiian and Other Pacific Islander alone (% change since 2000)
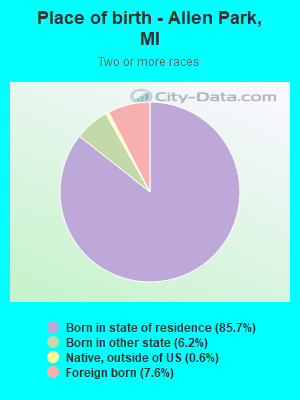
Races - Two or more races(%)
Races - Two or more races(% change since 2000)
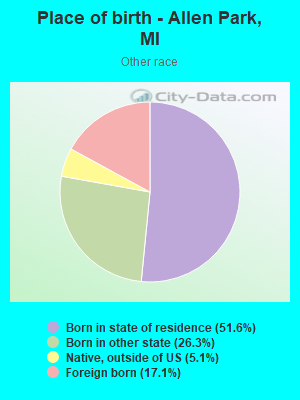
Races - Other race alone (%)
Races - Other race alone (% change since 2000)
Racial diversity
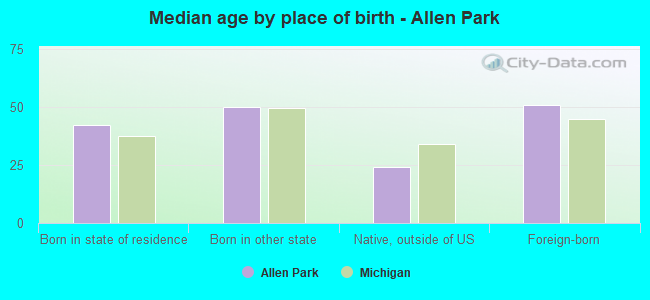
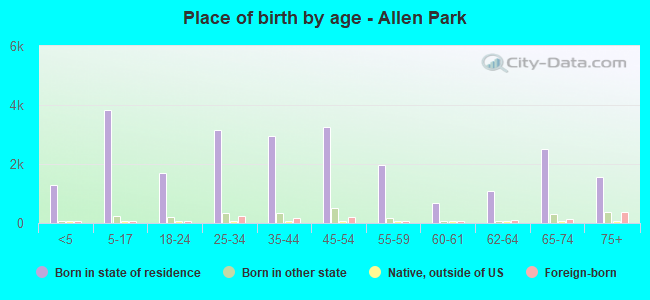
Place of birth - Born in state of residence (%)
Place of birth - Born in state of residence (%) - White
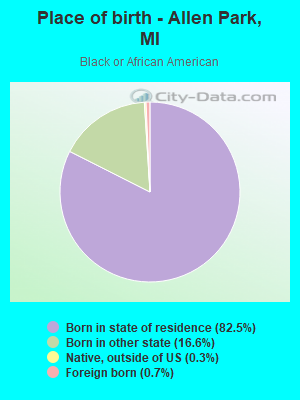
Place of birth - Born in state of residence (%) - Black or African American
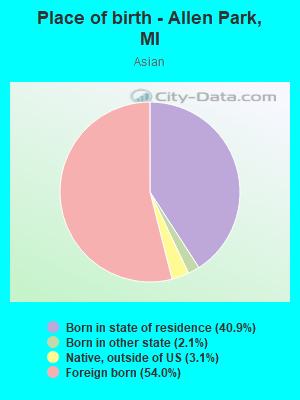
Place of birth - Born in state of residence (%) - Asian
Place of birth - Born in state of residence (%) - Hispanic or Latino
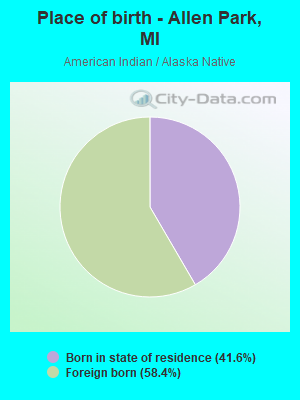
Place of birth - Born in state of residence (%) - American Indian and Alaska Native
Place of birth - Born in state of residence (%) - Multirace
Place of birth - Born in state of residence (%) - Other Race
Place of birth - Born in other state (%)
Place of birth - Born in other state (%) - White
Place of birth - Born in other state (%) - Black or African American
Place of birth - Born in other state (%) - Asian
Place of birth - Born in other state (%) - Hispanic or Latino
Place of birth - Born in other state (%) - American Indian and Alaska Native
Place of birth - Born in other state (%) - Multirace
Place of birth - Born in other state (%) - Other Race
Place of birth - Native, outside of US (%)
Place of birth - Native, outside of US (%) - White
Place of birth - Native, outside of US (%) - Black or African American
Place of birth - Native, outside of US (%) - Asian
Place of birth - Native, outside of US (%) - Hispanic or Latino
Place of birth - Native, outside of US (%) - American Indian and Alaska Native
Place of birth - Native, outside of US (%) - Multirace
Place of birth - Native, outside of US (%) - Other Race
Place of birth - Foreign born (%)
Place of birth - Foreign born (%) - White
Place of birth - Foreign born (%) - Black or African American
Place of birth - Foreign born (%) - Asian
Place of birth - Foreign born (%) - Hispanic or Latino
Place of birth - Foreign born (%) - American Indian and Alaska Native
Place of birth - Foreign born (%) - Multirace
Place of birth - Foreign born (%) - Other Race
Residents speaking English at home (%)
Residents speaking English at home - Born in the United States (%)
Residents speaking English at home - Native, born elsewhere (%)
Residents speaking English at home - Foreign born (%)
Residents speaking Spanish at home (%)
Residents speaking Spanish at home - Born in the United States (%)
Residents speaking Spanish at home - Native, born elsewhere (%)
Residents speaking Spanish at home - Foreign born (%)
Residents speaking other language at home (%)
Residents speaking other language at home - Born in the United States (%)
Residents speaking other language at home - Native, born elsewhere (%)
Residents speaking other language at home - Foreign born (%)
Marital status - Never married (%)
Marital status - Now married (%)
Marital status - Separated (%)
Marital status - Widowed (%)
Marital status - Divorced (%)
Ancestries Reported - Arab (%)
Ancestries Reported - Czech (%)
Ancestries Reported - Danish (%)
Ancestries Reported - Dutch (%)
Ancestries Reported - English (%)
Ancestries Reported - French (%)
Ancestries Reported - French Canadian (%)
Ancestries Reported - German (%)
Ancestries Reported - Greek (%)
Ancestries Reported - Hungarian (%)
Ancestries Reported - Irish (%)
Ancestries Reported - Italian (%)
Ancestries Reported - Lithuanian (%)
Ancestries Reported - Norwegian (%)
Ancestries Reported - Polish (%)
Ancestries Reported - Portuguese (%)
Ancestries Reported - Russian (%)
Ancestries Reported - Scotch-Irish (%)
Ancestries Reported - Scottish (%)
Ancestries Reported - Slovak (%)
Ancestries Reported - Subsaharan African (%)
Ancestries Reported - Swedish (%)
Ancestries Reported - Swiss (%)
Ancestries Reported - Ukrainian (%)
Ancestries Reported - United States (%)
Ancestries Reported - Welsh (%)
Ancestries Reported - West Indian (%)
Ancestries Reported - Other (%)
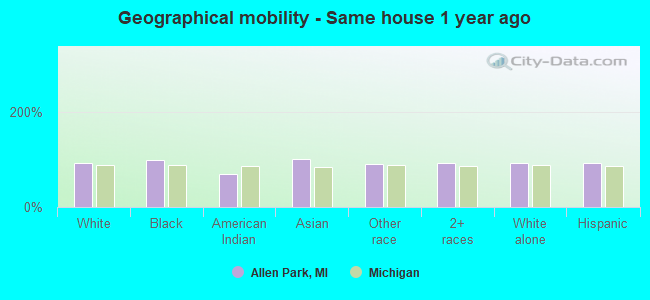
Geographical mobility - Same house 1 year ago (%)
Geographical mobility - Same house 1 year ago (%) - White
Geographical mobility - Same house 1 year ago (%) - Black or African American
Geographical mobility - Same house 1 year ago (%) - Asian
Geographical mobility - Same house 1 year ago (%) - Hispanic or Latino
Geographical mobility - Same house 1 year ago (%) - American Indian and Alaska Native
Geographical mobility - Same house 1 year ago (%) - Multirace
Geographical mobility - Same house 1 year ago (%) - Other Race
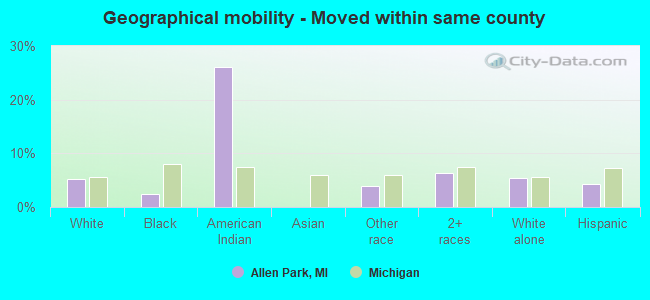
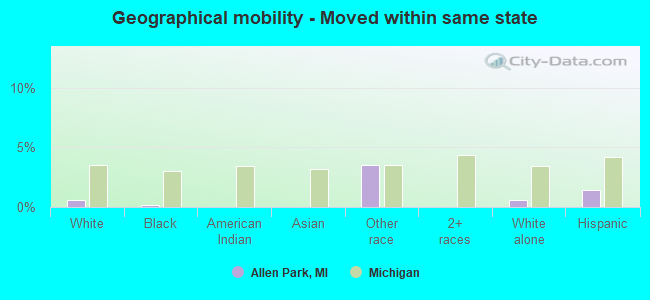
Geographical mobility - Moved within same county (%)
Geographical mobility - Moved within same county (%) - White
Geographical mobility - Moved within same county (%) - Black or African American
Geographical mobility - Moved within same county (%) - Asian
Geographical mobility - Moved within same county (%) - Hispanic or Latino
Geographical mobility - Moved within same county (%) - American Indian and Alaska Native
Geographical mobility - Moved within same county (%) - Multirace
Geographical mobility - Moved within same county (%) - Other Race
Geographical mobility - Moved from different county within same state (%)
Geographical mobility - Moved from different county within same state (%) - White
Geographical mobility - Moved from different county within same state (%) - Black or African American
Geographical mobility - Moved from different county within same state (%) - Asian
Geographical mobility - Moved from different county within same state (%) - Hispanic or Latino
Geographical mobility - Moved from different county within same state (%) - American Indian and Alaska Native
Geographical mobility - Moved from different county within same state (%) - Multirace
Geographical mobility - Moved from different county within same state (%) - Other Race
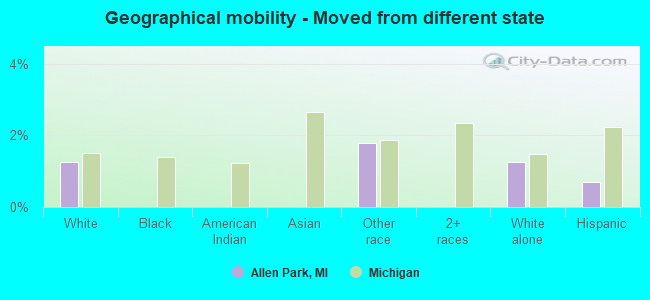
Geographical mobility - Moved from different state (%)
Geographical mobility - Moved from different state (%) - White
Geographical mobility - Moved from different state (%) - Black or African American
Geographical mobility - Moved from different state (%) - Asian
Geographical mobility - Moved from different state (%) - Hispanic or Latino
Geographical mobility - Moved from different state (%) - American Indian and Alaska Native
Geographical mobility - Moved from different state (%) - Multirace
Geographical mobility - Moved from different state (%) - Other Race
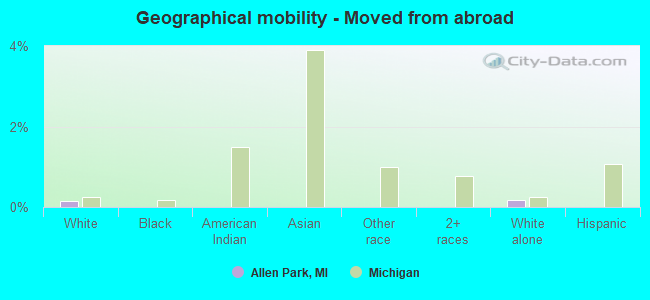
Geographical mobility - Moved from abroad (%)
Geographical mobility - Moved from abroad (%) - White
Geographical mobility - Moved from abroad (%) - Black or African American
Geographical mobility - Moved from abroad (%) - Asian
Geographical mobility - Moved from abroad (%) - Hispanic or Latino
Geographical mobility - Moved from abroad (%) - American Indian and Alaska Native
Geographical mobility - Moved from abroad (%) - Multirace
Geographical mobility - Moved from abroad (%) - Other Race
Place of birth for the foreign-born population - Ireland (%)
Place of birth for the foreign-born population - Denmark (%)
Place of birth for the foreign-born population - Norway (%)
Place of birth for the foreign-born population - Sweden (%)
Place of birth for the foreign-born population - United Kingdom (%)
Place of birth for the foreign-born population - England (%)
Place of birth for the foreign-born population - Scotland (%)
Place of birth for the foreign-born population - Other Northern Europe (%)
Place of birth for the foreign-born population - Austria (%)
Place of birth for the foreign-born population - Belgium (%)
Place of birth for the foreign-born population - France (%)
Place of birth for the foreign-born population - Germany (%)
Place of birth for the foreign-born population - Netherlands (%)
Place of birth for the foreign-born population - Switzerland (%)
Place of birth for the foreign-born population - Other Western Europe (%)
Place of birth for the foreign-born population - Greece (%)
Place of birth for the foreign-born population - Italy (%)
Place of birth for the foreign-born population - Portugal (%)
Place of birth for the foreign-born population - Spain (%)
Place of birth for the foreign-born population - Other Southern Europe (%)
Place of birth for the foreign-born population - Albania (%)
Place of birth for the foreign-born population - Belarus (%)
Place of birth for the foreign-born population - Bosnia and Herzegovina (%)
Place of birth for the foreign-born population - Bulgaria (%)
Place of birth for the foreign-born population - Croatia (%)
Place of birth for the foreign-born population - Czechoslovakia (%)
Place of birth for the foreign-born population - Hungary (%)
Place of birth for the foreign-born population - Latvia (%)
Place of birth for the foreign-born population - Lithuania (%)
Place of birth for the foreign-born population - North Macedonia (Macedonia) (%)
Place of birth for the foreign-born population - Moldova (%)
Place of birth for the foreign-born population - Poland (%)
Place of birth for the foreign-born population - Romania (%)
Place of birth for the foreign-born population - Russia (%)
Place of birth for the foreign-born population - Serbia (%)
Place of birth for the foreign-born population - Ukraine (%)
Place of birth for the foreign-born population - Other Eastern Europe (%)
Place of birth for the foreign-born population - China (%)
Place of birth for the foreign-born population - Hong Kong (%)
Place of birth for the foreign-born population - Taiwan (%)
Place of birth for the foreign-born population - Japan (%)
Place of birth for the foreign-born population - Korea (%)
Place of birth for the foreign-born population - Other Eastern Asia (%)
Place of birth for the foreign-born population - Afghanistan (%)
Place of birth for the foreign-born population - Bangladesh (%)
Place of birth for the foreign-born population - India (%)
Place of birth for the foreign-born population - Iran (%)
Place of birth for the foreign-born population - Kazakhstan (%)
Place of birth for the foreign-born population - Nepal (%)
Place of birth for the foreign-born population - Pakistan (%)
Place of birth for the foreign-born population - Sri Lanka (%)
Place of birth for the foreign-born population - Uzbekistan (%)
Place of birth for the foreign-born population - Other South Central Asia (%)
Place of birth for the foreign-born population - Burma (%)
Place of birth for the foreign-born population - Cambodia (%)
Place of birth for the foreign-born population - Indonesia (%)
Place of birth for the foreign-born population - Laos (%)
Place of birth for the foreign-born population - Malaysia (%)
Place of birth for the foreign-born population - Philippines (%)
Place of birth for the foreign-born population - Singapore (%)
Place of birth for the foreign-born population - Thailand (%)
Place of birth for the foreign-born population - Vietnam (%)
Place of birth for the foreign-born population - Other South Eastern Asia (%)
Place of birth for the foreign-born population - Armenia (%)
Place of birth for the foreign-born population - Iraq (%)
Place of birth for the foreign-born population - Israel (%)
Place of birth for the foreign-born population - Jordan (%)
Place of birth for the foreign-born population - Kuwait (%)
Place of birth for the foreign-born population - Lebanon (%)
Place of birth for the foreign-born population - Saudi Arabia (%)
Place of birth for the foreign-born population - Syria (%)
Place of birth for the foreign-born population - Turkey (%)
Place of birth for the foreign-born population - Yemen (%)
Place of birth for the foreign-born population - Other Western Asia (%)
Place of birth for the foreign-born population - Eritrea (%)
Place of birth for the foreign-born population - Ethiopia (%)
Place of birth for the foreign-born population - Kenya (%)
Place of birth for the foreign-born population - Somalia (%)
Place of birth for the foreign-born population - Uganda (%)
Place of birth for the foreign-born population - Zimbabwe (%)
Place of birth for the foreign-born population - Other Eastern Africa (%)
Place of birth for the foreign-born population - Cameroon (%)
Place of birth for the foreign-born population - Congo (%)
Place of birth for the foreign-born population - Democratic Republic of Congo (Zaire) (%)
Place of birth for the foreign-born population - Other Middle Africa (%)
Place of birth for the foreign-born population - Egypt (%)
Place of birth for the foreign-born population - Morocco (%)
Place of birth for the foreign-born population - Sudan (%)
Place of birth for the foreign-born population - Other Northern Africa (%)
Place of birth for the foreign-born population - South Africa (%)
Place of birth for the foreign-born population - Other Southern Africa (%)
Place of birth for the foreign-born population - Cabo Verde (%)
Place of birth for the foreign-born population - Ghana (%)
Place of birth for the foreign-born population - Liberia (%)
Place of birth for the foreign-born population - Nigeria (%)
Place of birth for the foreign-born population - Senegal (%)
Place of birth for the foreign-born population - Sierra Leone (%)
Place of birth for the foreign-born population - Other Western Africa (%)
Place of birth for the foreign-born population - Australia (%)
Place of birth for the foreign-born population - New Zealand (%)
Place of birth for the foreign-born population - Fiji (%)
Place of birth for the foreign-born population - Micronesia (%)
Place of birth for the foreign-born population - Bahamas (%)
Place of birth for the foreign-born population - Barbados (%)
Place of birth for the foreign-born population - Cuba (%)
Place of birth for the foreign-born population - Dominica (%)
Place of birth for the foreign-born population - Dominican Republic (%)
Place of birth for the foreign-born population - Grenada (%)
Place of birth for the foreign-born population - Haiti (%)
Place of birth for the foreign-born population - Jamaica (%)
Place of birth for the foreign-born population - St. Vincent and the Grenadines (%)
Place of birth for the foreign-born population - Trinidad and Tobago (%)
Place of birth for the foreign-born population - West Indies (%)
Place of birth for the foreign-born population - Other Caribbean (%)
Place of birth for the foreign-born population - Belize (%)
Place of birth for the foreign-born population - Costa Rica (%)
Place of birth for the foreign-born population - El Salvador (%)
Place of birth for the foreign-born population - Guatemala (%)
Place of birth for the foreign-born population - Honduras (%)
Place of birth for the foreign-born population - Mexico (%)
Place of birth for the foreign-born population - Nicaragua (%)
Place of birth for the foreign-born population - Panama (%)
Place of birth for the foreign-born population - Other Central America (%)
Place of birth for the foreign-born population - Argentina (%)
Place of birth for the foreign-born population - Bolivia (%)
Place of birth for the foreign-born population - Brazil (%)
Place of birth for the foreign-born population - Chile (%)
Place of birth for the foreign-born population - Colombia (%)
Place of birth for the foreign-born population - Ecuador (%)
Place of birth for the foreign-born population - Guyana (%)
Place of birth for the foreign-born population - Peru (%)
Place of birth for the foreign-born population - Uruguay (%)
Place of birth for the foreign-born population - Venezuela (%)
Place of birth for the foreign-born population - Other South America (%)
Place of birth for the foreign-born population - Canada (%)
Place of birth for the foreign-born population - Other Northern America (%)
Place of birth for the foreign-born population - Other (%)
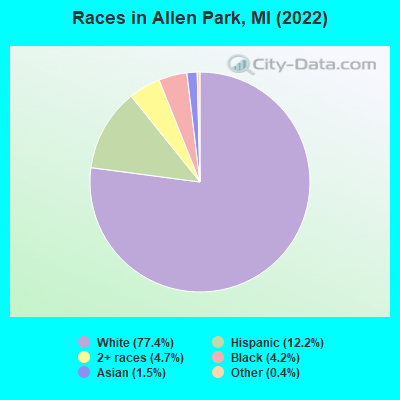
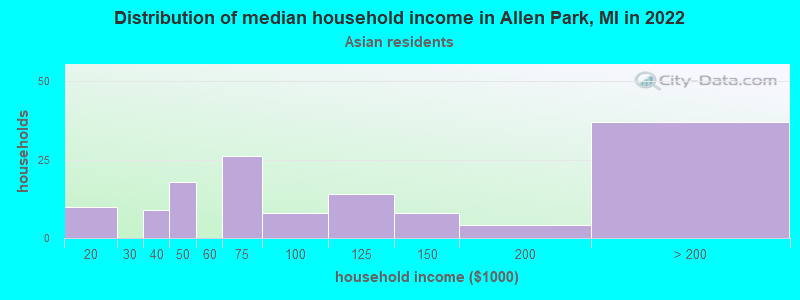
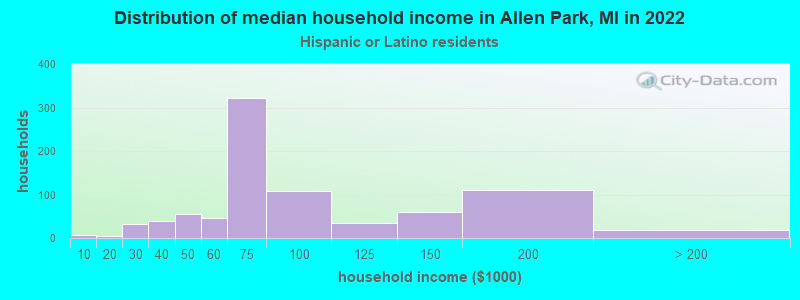
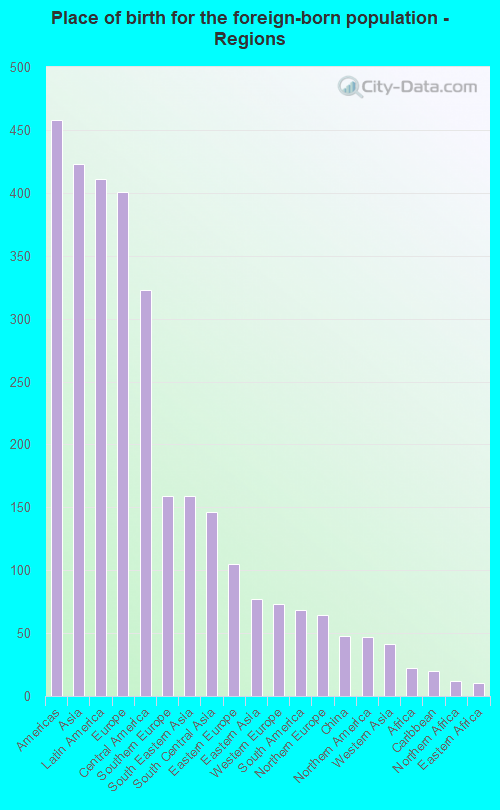
According to 2022 data, the most numerous races in Allen Park, MI are White alone (21,665 residents), Black alone (1,174 residents), and Hispanic (3,419 residents). 89.4% of Allen Park residents speak English at home. 4.7% of Allen Park, MI residents are foreign-born (1.5% born in Asia, 1.4% born in Latin America, 1.4% born in Europe), which is 28.8% less than the foreign-born rate of 6.0% across the entire state of Michigan.
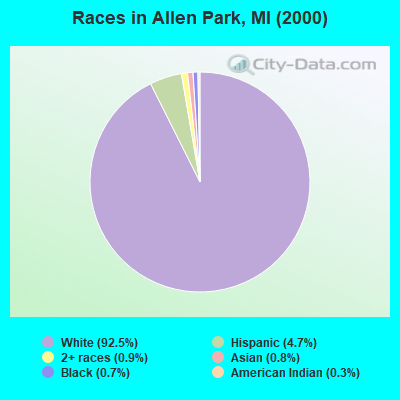
Race distribution in Allen Park
2000 2022
7,806,691 78.6% White alone 1,402,047 14.1% Black alone 323,877 3.3% Hispanic 175,311 1.8% Asian alone 163,487 1.6% Two or more races 53,421 0.5% American Indian alone 11,465 0.1% Other race alone 2,145 0.02% Native Hawaiian and Other
7,289,051 72.6% White alone 1,310,464 13.1% Black alone 572,405 5.7% Hispanic 450,031 4.5% Two or more races 335,732 3.3% Asian alone 45,217 0.5% Other race alone 29,011 0.3% American Indian alone 2,207 0.02% Native Hawaiian and Other
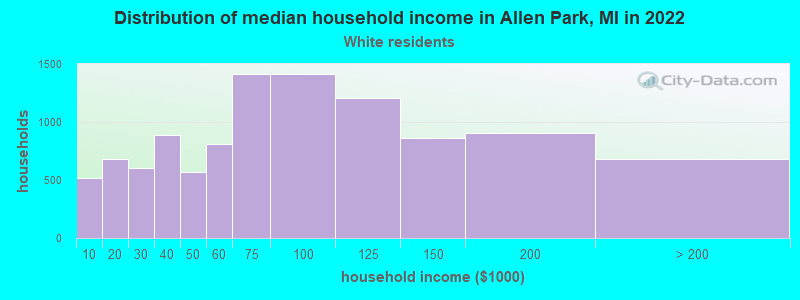
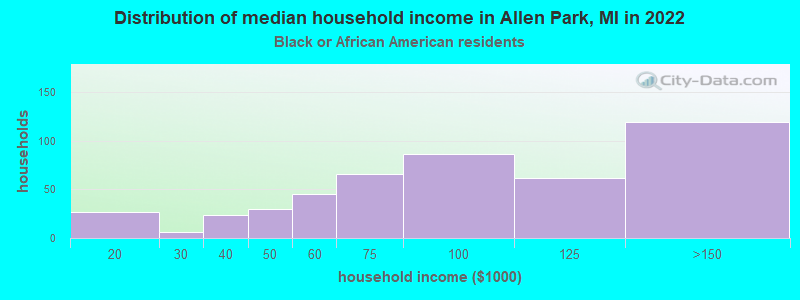
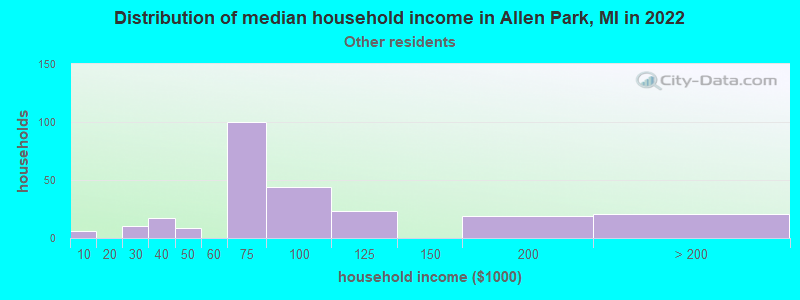
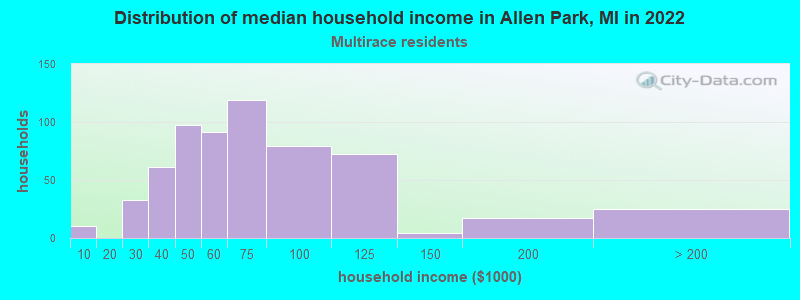
Income and house value in Allen Park Median household income in 2022 $71,343 White non-Hispanic householders$81,236 Black householders$66,406 American Indian and Alaska Native householders$100,354 Asian householders$71,811 Some other race householders$56,619 Two or more races householders$70,309 Hispanic or Latino race householdersMedian 2022 house value $181,005 White Non-Hispanic householders$90,197 Black or African American householders$198,374 American Indian or Alaska Native householders $252,310 Asian householders$167,292 Some other race householders$176,586 Two or more races householders$172,625 Hispanic or Latino householders
Median age by race in Allen Park
46.5 Median age for White residents45.0 47.9 35.7 Median age for Black or African American residents32.6 41.5 67.9 Median age for American Indian / Alaska Native residents-795,074,757.3 55.2 42.7 Median age for Asian residents53.7 44.1 -934,108,526.2 Median age for Native Hawaiian / Pacific Islander residents-674,772,035.8 -699,588,476.7 30.1 Median age for Other race residents38.8 20.6 23.5 Median age for Two or more races residents31.6 19.3 46.5 Median age for White alone residents44.5 49.3 30.7 Median age for Hispanic or Latino residents40.0 26.0
Owner/renter occupied households by race in Allen Park
House owners and renters - White residents 9,302 87.7% Owner occupied1,305 12.3% Renter occupiedHouse owners and renters - Black or African American residents 258 57.3% Owner occupied193 42.7% Renter occupiedHouse owners and renters - American Indian / Alaska Native residents 20 79.2% Owner occupied5 20.8% Renter occupiedHouse owners and renters - Asian residents 127 95.9% Owner occupied5 4.1% Renter occupiedHouse owners and renters - Other race residents 234 93.0% Owner occupied18 7.0% Renter occupiedHouse owners and renters - Two or more races residents 514 94.4% Owner occupied31 5.6% Renter occupiedHouse owners and renters - White alone residents 9,006 87.3% Owner occupied1,311 12.7% Renter occupiedHouse owners and renters - Hispanic or Latino residents 812 94.8% Owner occupied44 5.2% Renter occupied
Language usage in Allen Park
English speakers - Total 89.4% of residents of Allen Park speak English at home.
5.3% of residents speak Spanish at home 1,069 75.4% Speak English very well349 24.6% Speak English less than very well4.8% of residents speak other language at home 995 78.1% Speak English very well279 21.9% Speak English less than very well
English speakers - Born in the United States 91.9% of residents of Allen Park speak English at home.
6.7% of residents speak Spanish at home 114 65.5% Speak English very well60 34.5% Speak English less than very well1.9% of residents speak other language at home 41 82.0% Speak English very well9 18.0% Speak English less than very well
English speakers - Native, born elsewhere 62.8% of residents of Allen Park speak English at home.
20.2% of residents speak Spanish at home 37 100.0% Speak English very well16.9% of residents speak other language at home 27 87.1% Speak English very well4 12.9% Speak English less than very well
English speakers - Foreign-born 29.9% of residents of Allen Park speak English at home.
26.9% of residents speak Spanish at home 109 30.3% Speak English very well251 69.7% Speak English less than very well37.4% of residents speak other language at home 344 68.9% Speak English very well155 31.1% Speak English less than very well
White (Caucasian) - Speak only English Native:
95.7% (19,881)Foreign-born:
39.7% (291)
White (Caucasian) - Speak another language Native:
4.8% (997)Foreign-born:
60.8% (446)
Black or African American - Speak another language Native:
1.0% (12)Foreign-born:
96.9% (8)
American Indian / Alaska Native - Speak another language Native:
53.5% (17)Foreign-born:
100.0% (37)
Asian - Speak only English Native:
28.6% (60)Foreign-born:
48.5% (118)
Asian - Speak another language Native:
73.1% (154)Foreign-born:
56.9% (138)
Other race - Speak only English Native:
53.3% (339)Foreign-born:
5.9% (8)
Other race - Speak another language Native:
42.9% (273)Foreign-born:
93.5% (131)
Two or more races - Speak another language Native:
19.1% (481)Foreign-born:
100.0% (211)
White alone - Speak only English Native:
97.1% (19,325)Foreign-born:
46.1% (287)
White alone - Speak another language Native:
3.2% (646)Foreign-born:
52.8% (329)
Hispanic or Latino - Speak only English Native:
61.2% (1,685)Foreign-born:
1.6% (7)
Hispanic or Latino - Speak another language Native:
38.6% (1,063)Foreign-born:
99.4% (409)
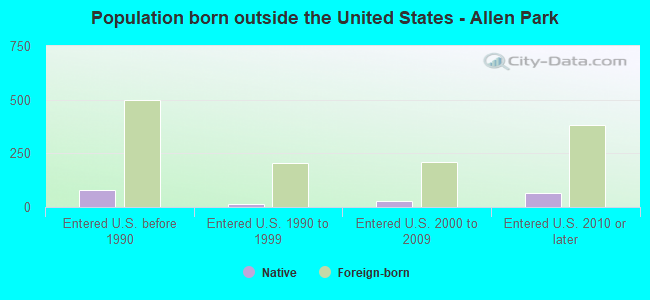
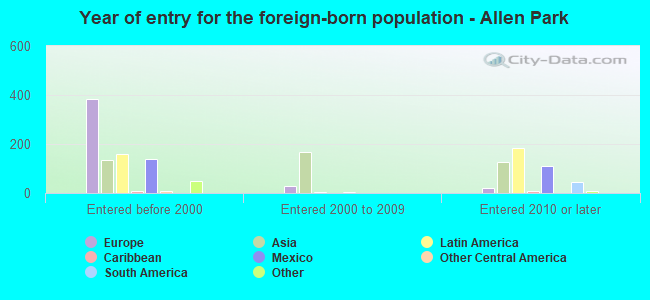
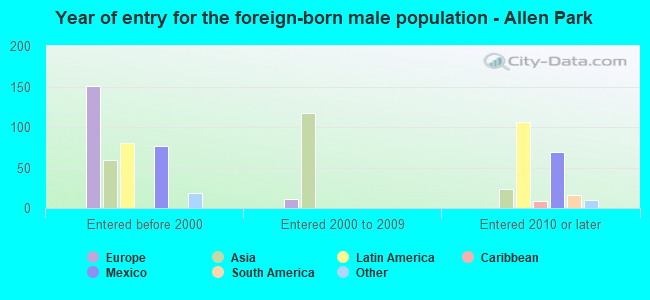
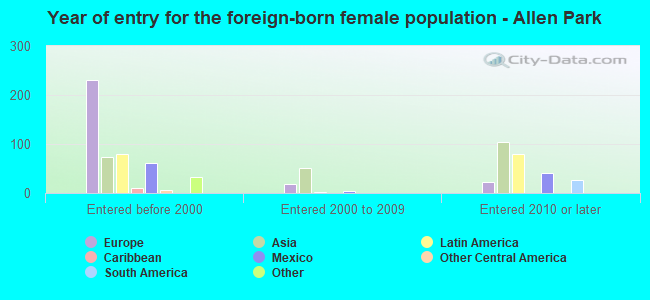
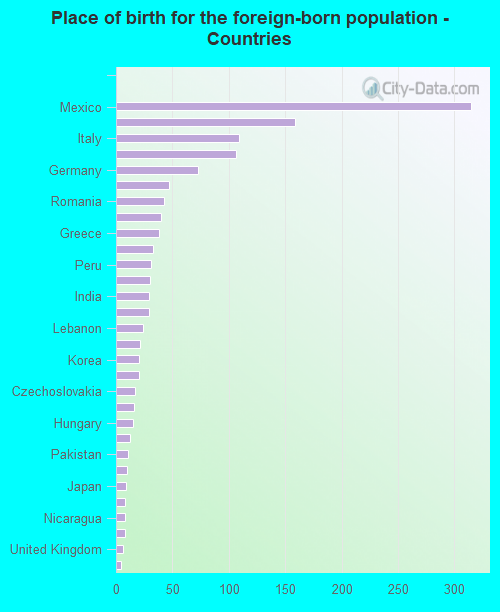
Foreign-born residents in Allen Park 1,304 residents are foreign born (1.5% Asia , 1.4% Latin America , 1.4% Europe ).
This city:
4.7%Michigan:
6.9%
Marital status for residents in Allen Park Marital status - White (Caucasian) population 15 years and over
Males 28.9% Never married51.1% Now married1.0% Separated4.6% Widowed14.3% DivorcedFemales 27.1% Never married47.9% Now married0.5% Separated10.8% Widowed13.7% DivorcedWomen who gave birth in the past 12 months Now married:
69.2% (173)Unmarried:
30.8% (77)
Women who did not give birth in the past 12 months Now married:
47.4% (2,191)Unmarried:
52.6% (2,431)
Marital status - Black or African American population 15 years and over
Males 54.8% Never married34.5% Now married0.0% Separated2.4% Widowed8.3% DivorcedFemales 46.3% Never married12.7% Now married5.0% Separated9.0% Widowed27.1% DivorcedWomen who gave birth in the past 12 months Now married:
35.2% (18)Unmarried:
64.8% (33)
Women who did not give birth in the past 12 months Now married:
7.6% (29)Unmarried:
92.4% (357)
Marital status - American Indian / Alaska Native population 15 years and over
Males 0.0% Never married100.0% Now married0.0% Separated0.0% Widowed0.0% DivorcedFemales 0.0% Never married27.1% Now married0.0% Separated20.8% Widowed52.1% DivorcedWomen who did not give birth in the past 12 months Now married:
100.0% (13)Unmarried:
0.0% (0)
Marital status - Asian population 15 years and over
Males 23.5% Never married55.3% Now married3.8% Separated0.0% Widowed17.4% DivorcedFemales 5.8% Never married48.6% Now married0.0% Separated9.7% Widowed36.0% DivorcedWomen who did not give birth in the past 12 months Now married:
46.3% (97)Unmarried:
53.7% (113)
Marital status - Other race population 15 years and over
Males 43.1% Never married33.8% Now married0.0% Separated0.0% Widowed23.1% DivorcedFemales 28.2% Never married57.4% Now married0.0% Separated2.6% Widowed11.8% DivorcedWomen who did not give birth in the past 12 months Now married:
59.6% (107)Unmarried:
40.4% (72)
Marital status - Two or more races population 15 years and over
Males 38.6% Never married58.1% Now married0.0% Separated1.0% Widowed2.2% DivorcedFemales 44.2% Never married35.4% Now married0.0% Separated9.9% Widowed10.5% DivorcedWomen who gave birth in the past 12 months Now married:
100.0% (92)Unmarried:
0.0% (0)
Women who did not give birth in the past 12 months Now married:
15.2% (92)Unmarried:
84.8% (515)
Marital status - White alone, not Hispanic / Latino population 15 years and over
Males 29.4% Never married51.2% Now married1.1% Separated4.6% Widowed13.7% DivorcedFemales 26.2% Never married48.5% Now married0.5% Separated11.4% Widowed13.3% DivorcedWomen who gave birth in the past 12 months Now married:
69.2% (177)Unmarried:
30.8% (79)
Women who did not give birth in the past 12 months Now married:
47.4% (2,012)Unmarried:
52.6% (2,230)
Marital status - Hispanic or Latino population 15 years and over
Males 30.2% Never married48.8% Now married0.0% Separated2.0% Widowed19.0% DivorcedFemales 38.9% Never married43.2% Now married0.0% Separated4.2% Widowed13.6% DivorcedWomen who gave birth in the past 12 months Now married:
100.0% (88)Unmarried:
0.0% (0)
Women who did not give birth in the past 12 months Now married:
41.9% (388)Unmarried:
58.1% (538)
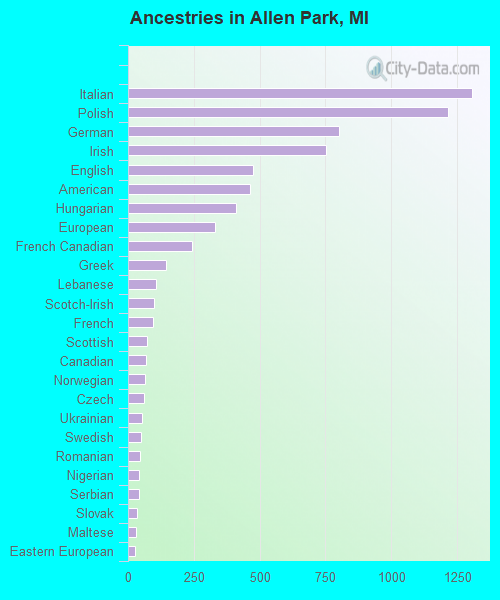
Ancestries in Allen Park
1,306 11.9% Italian1,217 11.1% Polish800 7.3% German754 6.9% Irish475 4.3% English463 4.2% American410 3.7% Hungarian331 3.0% European244 2.2% French Canadian145 1.3% Greek106 1.0% Lebanese98 0.9% Scotch-Irish96 0.9% French71 0.6% Scottish70 0.6% Canadian64 0.6% Norwegian60 0.5% Czech55 0.5% Ukrainian48 0.4% Swedish44 0.4% Romanian42 0.4% Nigerian41 0.4% Serbian33 0.3% Slovak29 0.3% Maltese28 0.3% Eastern European24 0.2% British23 0.2% African20 0.2% Finnish19 0.2% Welsh18 0.2% Albanian16 0.1% Czechoslovakian15 0.1% Russian15 0.1% Latvian13 0.1% Scandinavian13 0.1% Armenian12 0.1% Slavic12 0.1% Lithuanian10 0.09% Dutch10 0.09% Macedonian10 0.09% Danish9 0.08% Arab4 0.04% Ethiopian1 0.01% Belgian1 0.01% Syrian
Geographical mobility in Allen Park Same house 1 year ago 20,793 92.5% White (Caucasian)1,180 98.5% Black or African American41 70.1% American Indian / Alaska Native461 100.0% Asian746 90.3% Other race2,591 91.9% Two or more races19,749 92.2% White alone, not Hispanic / Latino3,175 93.0% Hispanic or LatinoMoved within same county 1,166 5.2% White / Caucasian28 2.4% Black or African American15 26.2% American Indian / Alaska Native32 3.9% Other race176 6.3% Two or more races1,171 5.5% White alone, not Hispanic / Latino147 4.3% Hispanic or LatinoMoved within same state 133 0.6% White / Caucasian2 0.1% Black or African American29 3.5% Other race124 0.6% White alone, not Hispanic / Latino48 1.4% Hispanic or LatinoMoved from different state 283 1.3% White / Caucasian15 1.8% Other race270 1.3% White alone, not Hispanic / Latino24 0.7% Hispanic or LatinoMoved from abroad 34 0.2% White36 0.2% White alone, not Hispanic / Latino
Children Nativity (place of birth) in Allen Park
Children under 6 years - Living with two parents Both parents native 1,097 100.0% NativeBoth parents foreign-born 71 100.0% NativeOne native, one foreign-born parent 120 100.0% NativeChildren under 6 years - Living with one parent Native parent 356 100.0% NativeChildren 6 to 17 years - Living with two parents Both parents native 1,950 99.9% Native1 0.1% Foreign-bornBoth parents foreign-born 102 79.4% Native26 20.6% Foreign-bornOne native, one foreign-born parent 209 100.0% NativeChildren 6 to 17 years - Living with one parent Native parent 1,224 100.0% NativeForeign-born parent 40 51.4% Native38 48.6% Foreign-born
Grandparents responsible for own grandchildren in Allen Park
Grandparents (30 to 59 years) White / Caucasian 76 65.2% Responsible for grandchildren41 34.8% Not responsible for grandchildrenBlack or African American 6 9.9% Responsible for grandchildren51 90.1% Not responsible for grandchildrenAmerican Indian / Alaska Native 4 100.0% Responsible for grandchildrenTwo or more races 4 17.6% Responsible for grandchildren20 82.4% Not responsible for grandchildrenWhite alone, not Hispanic / Latino 76 63.9% Responsible for grandchildren43 36.1% Not responsible for grandchildrenGrandparents (60 years and over) White / Caucasian 40 25.2% Responsible for grandchildren119 74.8% Not responsible for grandchildrenBlack or African American 20 100.0% Not responsible for grandchildrenTwo or more races 3 18.1% Responsible for grandchildren13 81.9% Not responsible for grandchildrenWhite alone, not Hispanic / Latino 38 25.1% Responsible for grandchildren112 74.9% Not responsible for grandchildren