Races in Allenstown, New Hampshire (NH) Detailed Stats
Ancestries, Foreign-born residents, place of birth
2.4% of Allenstown, NH residents are foreign-born (1.4% born in North America, 0.7% born in Europe, 0.3% born in Latin America), which is 149.5% less than the foreign-born rate of 6.0% across the entire state of New Hampshire.
Race distribution in Allenstown

- 4,69997.0%White alone
- 571.2%Hispanic
- 340.7%Two or more races
- 240.5%Black alone
- 170.4%Asian alone
- 100.2%American Indian alone
- 20.04%Other race alone

2000
2022
-
- 1,175,25295.1%White alone
- 20,4891.7%Hispanic
- 15,8031.3%Asian alone
- 11,6060.9%Two or more races
- 8,3540.7%Black alone
- 2,6980.2%American Indian alone
- 1,2540.1%Other race alone
- 3300.03%Native Hawaiian and Other
Pacific Islander alone

-
- 1,208,10186.6%White alone
- 63,4794.5%Hispanic
- 60,7244.4%Two or more races
- 36,5192.6%Asian alone
- 17,9311.3%Black alone
- 6,6150.5%Other race alone
- 1,0140.07%American Indian alone
- 8480.06%Native Hawaiian and Other
Pacific Islander alone

Income and house value in Allenstown
- Median household income in 2022
- $73,118White non-Hispanic householders
- $68,935Black householders
- $86,647Some other race householders
- $98,648Two or more races householders
- $35,854Hispanic or Latino race householders
- Median 2022 house value
- $304,495White Non-Hispanic householders
- $373,030Two or more races householders
- $352,063Hispanic or Latino householders
Household income for White non-Hispanic householders

Household income for Black householders

Household income for American Indian and Alaska Native householders

Household income for Two or more races householders

Household income for Hispanic or Latino race householders

Foreign-born residents in Allenstown
116 residents are foreign born (1.4% North America, 0.7% Europe, 0.3% Latin America).
| This city: | 2.4% |
| New Hampshire: | 4.4% |
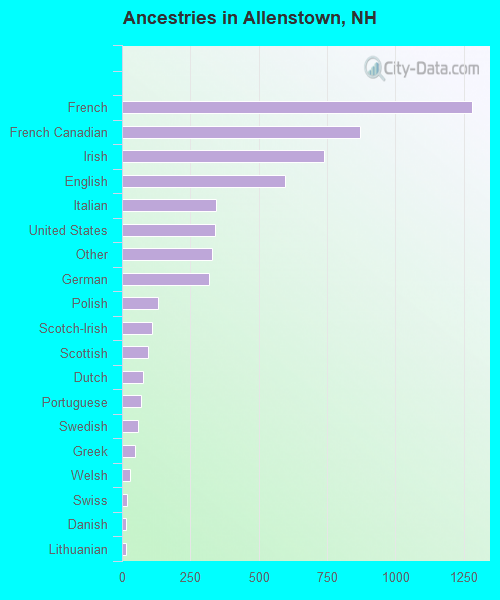
Ancestries in Allenstown

- 1,27923.2%French
- 87215.8%French Canadian
- 74113.4%Irish
- 59710.8%English
- 3446.2%Italian
- 3416.2%United States
- 3306.0%Other
- 3175.7%German
- 1312.4%Polish
- 1092.0%Scotch-Irish
- 961.7%Scottish
- 761.4%Dutch
- 711.3%Portuguese
- 571.0%Swedish
- 490.9%Greek
- 310.6%Welsh
- 180.3%Swiss
- 150.3%Danish
- 130.2%Lithuanian
- 90.2%Russian
- 90.2%Slovak
- 60.1%West Indian
- 50.09%Ukrainian
Zip codes: 03275.