Races in Alsip, Illinois (IL) Detailed Stats
Data:
Races - White alone (%)
Races - White alone (% change since 2000)
Races - Black alone (%)
Races - Black alone (% change since 2000)
Races - American Indian alone (%)
Races - American Indian alone (% change since 2000)
Races - Asian alone (%)
Races - Asian alone (% change since 2000)
Races - Hispanic (%)
Races - Hispanic (% change since 2000)
Races - Native Hawaiian and Other Pacific Islander alone (%)
Races - Native Hawaiian and Other Pacific Islander alone (% change since 2000)
Races - Two or more races(%)
Races - Two or more races(% change since 2000)
Races - Other race alone (%)
Races - Other race alone (% change since 2000)
Racial diversity
Place of birth - Born in state of residence (%)
Place of birth - Born in state of residence (%) - White
Place of birth - Born in state of residence (%) - Black or African American
Place of birth - Born in state of residence (%) - Asian
Place of birth - Born in state of residence (%) - Hispanic or Latino
Place of birth - Born in state of residence (%) - American Indian and Alaska Native
Place of birth - Born in state of residence (%) - Multirace
Place of birth - Born in state of residence (%) - Other Race
Place of birth - Born in other state (%)
Place of birth - Born in other state (%) - White
Place of birth - Born in other state (%) - Black or African American
Place of birth - Born in other state (%) - Asian
Place of birth - Born in other state (%) - Hispanic or Latino
Place of birth - Born in other state (%) - American Indian and Alaska Native
Place of birth - Born in other state (%) - Multirace
Place of birth - Born in other state (%) - Other Race
Place of birth - Native, outside of US (%)
Place of birth - Native, outside of US (%) - White
Place of birth - Native, outside of US (%) - Black or African American
Place of birth - Native, outside of US (%) - Asian
Place of birth - Native, outside of US (%) - Hispanic or Latino
Place of birth - Native, outside of US (%) - American Indian and Alaska Native
Place of birth - Native, outside of US (%) - Multirace
Place of birth - Native, outside of US (%) - Other Race
Place of birth - Foreign born (%)
Place of birth - Foreign born (%) - White
Place of birth - Foreign born (%) - Black or African American
Place of birth - Foreign born (%) - Asian
Place of birth - Foreign born (%) - Hispanic or Latino
Place of birth - Foreign born (%) - American Indian and Alaska Native
Place of birth - Foreign born (%) - Multirace
Place of birth - Foreign born (%) - Other Race
Residents speaking English at home (%)
Residents speaking English at home - Born in the United States (%)
Residents speaking English at home - Native, born elsewhere (%)
Residents speaking English at home - Foreign born (%)
Residents speaking Spanish at home (%)
Residents speaking Spanish at home - Born in the United States (%)
Residents speaking Spanish at home - Native, born elsewhere (%)
Residents speaking Spanish at home - Foreign born (%)
Residents speaking other language at home (%)
Residents speaking other language at home - Born in the United States (%)
Residents speaking other language at home - Native, born elsewhere (%)
Residents speaking other language at home - Foreign born (%)
Marital status - Never married (%)
Marital status - Now married (%)
Marital status - Separated (%)
Marital status - Widowed (%)
Marital status - Divorced (%)
Ancestries Reported - Arab (%)
Ancestries Reported - Czech (%)
Ancestries Reported - Danish (%)
Ancestries Reported - Dutch (%)
Ancestries Reported - English (%)
Ancestries Reported - French (%)
Ancestries Reported - French Canadian (%)
Ancestries Reported - German (%)
Ancestries Reported - Greek (%)
Ancestries Reported - Hungarian (%)
Ancestries Reported - Irish (%)
Ancestries Reported - Italian (%)
Ancestries Reported - Lithuanian (%)
Ancestries Reported - Norwegian (%)
Ancestries Reported - Polish (%)
Ancestries Reported - Portuguese (%)
Ancestries Reported - Russian (%)
Ancestries Reported - Scotch-Irish (%)
Ancestries Reported - Scottish (%)
Ancestries Reported - Slovak (%)
Ancestries Reported - Subsaharan African (%)
Ancestries Reported - Swedish (%)
Ancestries Reported - Swiss (%)
Ancestries Reported - Ukrainian (%)
Ancestries Reported - United States (%)
Ancestries Reported - Welsh (%)
Ancestries Reported - West Indian (%)
Ancestries Reported - Other (%)
Geographical mobility - Same house 1 year ago (%)
Geographical mobility - Same house 1 year ago (%) - White
Geographical mobility - Same house 1 year ago (%) - Black or African American
Geographical mobility - Same house 1 year ago (%) - Asian
Geographical mobility - Same house 1 year ago (%) - Hispanic or Latino
Geographical mobility - Same house 1 year ago (%) - American Indian and Alaska Native
Geographical mobility - Same house 1 year ago (%) - Multirace
Geographical mobility - Same house 1 year ago (%) - Other Race
Geographical mobility - Moved within same county (%)
Geographical mobility - Moved within same county (%) - White
Geographical mobility - Moved within same county (%) - Black or African American
Geographical mobility - Moved within same county (%) - Asian
Geographical mobility - Moved within same county (%) - Hispanic or Latino
Geographical mobility - Moved within same county (%) - American Indian and Alaska Native
Geographical mobility - Moved within same county (%) - Multirace
Geographical mobility - Moved within same county (%) - Other Race
Geographical mobility - Moved from different county within same state (%)
Geographical mobility - Moved from different county within same state (%) - White
Geographical mobility - Moved from different county within same state (%) - Black or African American
Geographical mobility - Moved from different county within same state (%) - Asian
Geographical mobility - Moved from different county within same state (%) - Hispanic or Latino
Geographical mobility - Moved from different county within same state (%) - American Indian and Alaska Native
Geographical mobility - Moved from different county within same state (%) - Multirace
Geographical mobility - Moved from different county within same state (%) - Other Race
Geographical mobility - Moved from different state (%)
Geographical mobility - Moved from different state (%) - White
Geographical mobility - Moved from different state (%) - Black or African American
Geographical mobility - Moved from different state (%) - Asian
Geographical mobility - Moved from different state (%) - Hispanic or Latino
Geographical mobility - Moved from different state (%) - American Indian and Alaska Native
Geographical mobility - Moved from different state (%) - Multirace
Geographical mobility - Moved from different state (%) - Other Race
Geographical mobility - Moved from abroad (%)
Geographical mobility - Moved from abroad (%) - White
Geographical mobility - Moved from abroad (%) - Black or African American
Geographical mobility - Moved from abroad (%) - Asian
Geographical mobility - Moved from abroad (%) - Hispanic or Latino
Geographical mobility - Moved from abroad (%) - American Indian and Alaska Native
Geographical mobility - Moved from abroad (%) - Multirace
Geographical mobility - Moved from abroad (%) - Other Race
Place of birth for the foreign-born population - Ireland (%)
Place of birth for the foreign-born population - Denmark (%)
Place of birth for the foreign-born population - Norway (%)
Place of birth for the foreign-born population - Sweden (%)
Place of birth for the foreign-born population - United Kingdom (%)
Place of birth for the foreign-born population - England (%)
Place of birth for the foreign-born population - Scotland (%)
Place of birth for the foreign-born population - Other Northern Europe (%)
Place of birth for the foreign-born population - Austria (%)
Place of birth for the foreign-born population - Belgium (%)
Place of birth for the foreign-born population - France (%)
Place of birth for the foreign-born population - Germany (%)
Place of birth for the foreign-born population - Netherlands (%)
Place of birth for the foreign-born population - Switzerland (%)
Place of birth for the foreign-born population - Other Western Europe (%)
Place of birth for the foreign-born population - Greece (%)
Place of birth for the foreign-born population - Italy (%)
Place of birth for the foreign-born population - Portugal (%)
Place of birth for the foreign-born population - Spain (%)
Place of birth for the foreign-born population - Other Southern Europe (%)
Place of birth for the foreign-born population - Albania (%)
Place of birth for the foreign-born population - Belarus (%)
Place of birth for the foreign-born population - Bosnia and Herzegovina (%)
Place of birth for the foreign-born population - Bulgaria (%)
Place of birth for the foreign-born population - Croatia (%)
Place of birth for the foreign-born population - Czechoslovakia (%)
Place of birth for the foreign-born population - Hungary (%)
Place of birth for the foreign-born population - Latvia (%)
Place of birth for the foreign-born population - Lithuania (%)
Place of birth for the foreign-born population - North Macedonia (Macedonia) (%)
Place of birth for the foreign-born population - Moldova (%)
Place of birth for the foreign-born population - Poland (%)
Place of birth for the foreign-born population - Romania (%)
Place of birth for the foreign-born population - Russia (%)
Place of birth for the foreign-born population - Serbia (%)
Place of birth for the foreign-born population - Ukraine (%)
Place of birth for the foreign-born population - Other Eastern Europe (%)
Place of birth for the foreign-born population - China (%)
Place of birth for the foreign-born population - Hong Kong (%)
Place of birth for the foreign-born population - Taiwan (%)
Place of birth for the foreign-born population - Japan (%)
Place of birth for the foreign-born population - Korea (%)
Place of birth for the foreign-born population - Other Eastern Asia (%)
Place of birth for the foreign-born population - Afghanistan (%)
Place of birth for the foreign-born population - Bangladesh (%)
Place of birth for the foreign-born population - India (%)
Place of birth for the foreign-born population - Iran (%)
Place of birth for the foreign-born population - Kazakhstan (%)
Place of birth for the foreign-born population - Nepal (%)
Place of birth for the foreign-born population - Pakistan (%)
Place of birth for the foreign-born population - Sri Lanka (%)
Place of birth for the foreign-born population - Uzbekistan (%)
Place of birth for the foreign-born population - Other South Central Asia (%)
Place of birth for the foreign-born population - Burma (%)
Place of birth for the foreign-born population - Cambodia (%)
Place of birth for the foreign-born population - Indonesia (%)
Place of birth for the foreign-born population - Laos (%)
Place of birth for the foreign-born population - Malaysia (%)
Place of birth for the foreign-born population - Philippines (%)
Place of birth for the foreign-born population - Singapore (%)
Place of birth for the foreign-born population - Thailand (%)
Place of birth for the foreign-born population - Vietnam (%)
Place of birth for the foreign-born population - Other South Eastern Asia (%)
Place of birth for the foreign-born population - Armenia (%)
Place of birth for the foreign-born population - Iraq (%)
Place of birth for the foreign-born population - Israel (%)
Place of birth for the foreign-born population - Jordan (%)
Place of birth for the foreign-born population - Kuwait (%)
Place of birth for the foreign-born population - Lebanon (%)
Place of birth for the foreign-born population - Saudi Arabia (%)
Place of birth for the foreign-born population - Syria (%)
Place of birth for the foreign-born population - Turkey (%)
Place of birth for the foreign-born population - Yemen (%)
Place of birth for the foreign-born population - Other Western Asia (%)
Place of birth for the foreign-born population - Eritrea (%)
Place of birth for the foreign-born population - Ethiopia (%)
Place of birth for the foreign-born population - Kenya (%)
Place of birth for the foreign-born population - Somalia (%)
Place of birth for the foreign-born population - Uganda (%)
Place of birth for the foreign-born population - Zimbabwe (%)
Place of birth for the foreign-born population - Other Eastern Africa (%)
Place of birth for the foreign-born population - Cameroon (%)
Place of birth for the foreign-born population - Congo (%)
Place of birth for the foreign-born population - Democratic Republic of Congo (Zaire) (%)
Place of birth for the foreign-born population - Other Middle Africa (%)
Place of birth for the foreign-born population - Egypt (%)
Place of birth for the foreign-born population - Morocco (%)
Place of birth for the foreign-born population - Sudan (%)
Place of birth for the foreign-born population - Other Northern Africa (%)
Place of birth for the foreign-born population - South Africa (%)
Place of birth for the foreign-born population - Other Southern Africa (%)
Place of birth for the foreign-born population - Cabo Verde (%)
Place of birth for the foreign-born population - Ghana (%)
Place of birth for the foreign-born population - Liberia (%)
Place of birth for the foreign-born population - Nigeria (%)
Place of birth for the foreign-born population - Senegal (%)
Place of birth for the foreign-born population - Sierra Leone (%)
Place of birth for the foreign-born population - Other Western Africa (%)
Place of birth for the foreign-born population - Australia (%)
Place of birth for the foreign-born population - New Zealand (%)
Place of birth for the foreign-born population - Fiji (%)
Place of birth for the foreign-born population - Micronesia (%)
Place of birth for the foreign-born population - Bahamas (%)
Place of birth for the foreign-born population - Barbados (%)
Place of birth for the foreign-born population - Cuba (%)
Place of birth for the foreign-born population - Dominica (%)
Place of birth for the foreign-born population - Dominican Republic (%)
Place of birth for the foreign-born population - Grenada (%)
Place of birth for the foreign-born population - Haiti (%)
Place of birth for the foreign-born population - Jamaica (%)
Place of birth for the foreign-born population - St. Vincent and the Grenadines (%)
Place of birth for the foreign-born population - Trinidad and Tobago (%)
Place of birth for the foreign-born population - West Indies (%)
Place of birth for the foreign-born population - Other Caribbean (%)
Place of birth for the foreign-born population - Belize (%)
Place of birth for the foreign-born population - Costa Rica (%)
Place of birth for the foreign-born population - El Salvador (%)
Place of birth for the foreign-born population - Guatemala (%)
Place of birth for the foreign-born population - Honduras (%)
Place of birth for the foreign-born population - Mexico (%)
Place of birth for the foreign-born population - Nicaragua (%)
Place of birth for the foreign-born population - Panama (%)
Place of birth for the foreign-born population - Other Central America (%)
Place of birth for the foreign-born population - Argentina (%)
Place of birth for the foreign-born population - Bolivia (%)
Place of birth for the foreign-born population - Brazil (%)
Place of birth for the foreign-born population - Chile (%)
Place of birth for the foreign-born population - Colombia (%)
Place of birth for the foreign-born population - Ecuador (%)
Place of birth for the foreign-born population - Guyana (%)
Place of birth for the foreign-born population - Peru (%)
Place of birth for the foreign-born population - Uruguay (%)
Place of birth for the foreign-born population - Venezuela (%)
Place of birth for the foreign-born population - Other South America (%)
Place of birth for the foreign-born population - Canada (%)
Place of birth for the foreign-born population - Other Northern America (%)
Place of birth for the foreign-born population - Other (%)
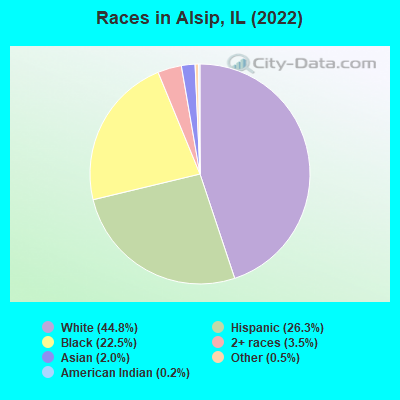
According to 2022 data, the most numerous races in Alsip, IL are White alone (8,267 residents), Hispanic (4,850 residents), and Black alone (4,143 residents). 79.1% of Alsip residents speak English at home. 9.9% of Alsip, IL residents are foreign-born (4.3% born in Latin America, 2.4% born in Asia, 2.0% born in Europe, 1.0% born in Africa), which is 41.0% less than the foreign-born rate of 14.0% across the entire state of Illinois.
Race distribution in Alsip
2000 2022
8,424,140 67.8% White alone 1,856,152 14.9% Black alone 1,530,262 12.3% Hispanic 419,916 3.4% Asian alone 153,996 1.2% Two or more races 13,479 0.1% Other race alone 18,232 0.1% American Indian alone 3,116 0.03% Native Hawaiian and Other
7,356,301 58.5% White alone 2,299,726 18.3% Hispanic 1,660,423 13.2% Black alone 747,296 5.9% Asian alone 458,599 3.6% Two or more races 45,386 0.4% Other race alone 10,405 0.08% American Indian alone 3,896 0.03% Native Hawaiian and Other
Income and house value in Alsip Median household income in 2022 $58,289 White non-Hispanic householders$50,297 Black householders$98,757 Asian householders$93,456 Some other race householders$99,063 Two or more races householders$109,612 Hispanic or Latino race householdersMedian 2022 house value $209,748 White Non-Hispanic householders$194,596 Black or African American householders$167,115 American Indian or Alaska Native householders $209,897 Asian householders$235,150 Some other race householders$240,052 Two or more races householders$212,422 Hispanic or Latino householders
Median age by race in Alsip
45.6 Median age for White residents41.0 50.7 37.1 Median age for Black or African American residents32.2 41.3 11.8 Median age for American Indian / Alaska Native residents12.6 16.0 60.7 Median age for Asian residents62.5 37.9 -687,999,999.3 Median age for Native Hawaiian / Pacific Islander residents-918,721,460.3 -610,229,276.3 26.6 Median age for Other race residents29.9 21.4 39.0 Median age for Two or more races residents31.3 48.8 50.8 Median age for White alone residents48.7 51.3 30.3 Median age for Hispanic or Latino residents29.7 32.3
Owner/renter occupied households by race in Alsip
House owners and renters - White residents 3,391 76.2% Owner occupied1,059 23.8% Renter occupiedHouse owners and renters - Black or African American residents 616 32.8% Owner occupied1,265 67.2% Renter occupiedHouse owners and renters - American Indian / Alaska Native residents 47 100.0% Owner occupiedHouse owners and renters - Asian residents 102 90.5% Owner occupied11 9.5% Renter occupiedHouse owners and renters - Other race residents 252 59.7% Owner occupied170 40.3% Renter occupiedHouse owners and renters - Two or more races residents 432 51.8% Owner occupied401 48.2% Renter occupiedHouse owners and renters - White alone residents 2,966 72.9% Owner occupied1,101 27.1% Renter occupiedHouse owners and renters - Hispanic or Latino residents 1,148 82.2% Owner occupied249 17.8% Renter occupied
Language usage in Alsip
English speakers - Total 79.1% of residents of Alsip speak English at home.
14.4% of residents speak Spanish at home 1,735 68.8% Speak English very well788 31.2% Speak English less than very well5.9% of residents speak other language at home 648 62.9% Speak English very well382 37.1% Speak English less than very well
English speakers - Born in the United States 92.6% of residents of Alsip speak English at home.
6.6% of residents speak Spanish at home 48 39.7% Speak English very well73 60.3% Speak English less than very well0.7% of residents speak other language at home 12 100.0% Speak English very well
English speakers - Native, born elsewhere 65.2% of residents of Alsip speak English at home.
16.7% of residents speak Spanish at home 24 31.2% Speak English very well53 68.8% Speak English less than very well17.8% of residents speak other language at home 62 75.6% Speak English very well20 24.4% Speak English less than very well
English speakers - Foreign-born 22.4% of residents of Alsip speak English at home.
40.3% of residents speak Spanish at home 314 42.5% Speak English very well424 57.5% Speak English less than very well36.2% of residents speak other language at home 297 44.8% Speak English very well366 55.2% Speak English less than very well
White (Caucasian) - Speak only English Native:
92.2% (7,968)Foreign-born:
31.6% (202)
White (Caucasian) - Speak another language Native:
8.8% (761)Foreign-born:
69.7% (444)
Black or African American - Speak only English Native:
99.7% (3,824)Foreign-born:
72.9% (69)
Black or African American - Speak another language Native:
0.3% (10)Foreign-born:
35.4% (34)
American Indian / Alaska Native - Speak only English Native:
22.2% (51)Foreign-born:
63.3% (6)
Other race - Speak only English Native:
46.1% (483)Foreign-born:
3.4% (15)
Other race - Speak another language Native:
55.8% (585)Foreign-born:
96.8% (421)
Two or more races - Speak another language Native:
33.8% (572)Foreign-born:
100.0% (249)
White alone - Speak only English Native:
94.2% (6,932)Foreign-born:
31.6% (177)
White alone - Speak another language Native:
5.5% (407)Foreign-born:
66.6% (373)
Hispanic or Latino - Speak only English Native:
54.5% (2,012)Foreign-born:
7.9% (64)
Hispanic or Latino - Speak another language Native:
46.9% (1,734)Foreign-born:
91.7% (740)
Foreign-born residents in Alsip 1,831 residents are foreign born (4.3% Latin America , 2.4% Asia , 2.0% Europe , 1.0% Africa ).
This city:
9.9%Illinois:
14.1%
Marital status for residents in Alsip Marital status - White (Caucasian) population 15 years and over
Males 39.2% Never married47.8% Now married0.5% Separated5.0% Widowed7.4% DivorcedFemales 34.6% Never married44.3% Now married0.3% Separated8.6% Widowed12.2% DivorcedWomen who gave birth in the past 12 months Now married:
100.0% (60)Unmarried:
0.0% (0)
Women who did not give birth in the past 12 months Now married:
36.7% (693)Unmarried:
63.3% (1,198)
Marital status - Black or African American population 15 years and over
Males 53.2% Never married36.2% Now married1.3% Separated4.0% Widowed5.3% DivorcedFemales 49.1% Never married27.1% Now married1.9% Separated6.6% Widowed15.4% DivorcedWomen who gave birth in the past 12 months Now married:
0.0% (0)Unmarried:
100.0% (108)
Women who did not give birth in the past 12 months Now married:
33.5% (335)Unmarried:
66.5% (667)
Marital status - American Indian / Alaska Native population 15 years and over
Males 0.0% Never married100.0% Now married0.0% Separated0.0% Widowed0.0% DivorcedFemales 58.1% Never married27.9% Now married14.0% Separated0.0% Widowed0.0% DivorcedWomen who gave birth in the past 12 months Now married:
100.0% (22)Unmarried:
0.0% (0)
Women who did not give birth in the past 12 months Now married:
19.4% (11)Unmarried:
80.6% (45)
Marital status - Asian population 15 years and over
Males 0.0% Never married52.1% Now married0.0% Separated0.0% Widowed47.9% DivorcedFemales 26.5% Never married54.8% Now married12.0% Separated0.0% Widowed6.6% DivorcedWomen who gave birth in the past 12 months Now married:
0.0% (0)Unmarried:
100.0% (11)
Women who did not give birth in the past 12 months Now married:
46.3% (38)Unmarried:
53.7% (44)
Marital status - Other race population 15 years and over
Males 30.6% Never married56.3% Now married0.0% Separated0.0% Widowed13.1% DivorcedFemales 46.2% Never married48.7% Now married3.8% Separated1.3% Widowed0.0% DivorcedWomen who gave birth in the past 12 months Now married:
100.0% (37)Unmarried:
0.0% (0)
Women who did not give birth in the past 12 months Now married:
42.6% (183)Unmarried:
57.4% (246)
Marital status - Two or more races population 15 years and over
Males 45.4% Never married46.3% Now married3.2% Separated2.5% Widowed2.7% DivorcedFemales 32.0% Never married55.6% Now married0.0% Separated6.7% Widowed5.6% DivorcedWomen who gave birth in the past 12 months Now married:
100.0% (8)Unmarried:
0.0% (0)
Women who did not give birth in the past 12 months Now married:
33.2% (133)Unmarried:
66.8% (268)
Marital status - White alone, not Hispanic / Latino population 15 years and over
Males 33.8% Never married50.0% Now married0.6% Separated6.5% Widowed9.1% DivorcedFemales 34.9% Never married42.3% Now married0.0% Separated9.6% Widowed13.2% DivorcedWomen who gave birth in the past 12 months Now married:
100.0% (57)Unmarried:
0.0% (0)
Women who did not give birth in the past 12 months Now married:
30.9% (523)Unmarried:
69.1% (1,171)
Marital status - Hispanic or Latino population 15 years and over
Males 44.2% Never married49.7% Now married0.0% Separated0.3% Widowed5.8% DivorcedFemales 32.5% Never married56.0% Now married2.3% Separated4.2% Widowed5.0% DivorcedWomen who gave birth in the past 12 months Now married:
100.0% (62)Unmarried:
0.0% (0)
Women who did not give birth in the past 12 months Now married:
51.1% (496)Unmarried:
48.9% (475)
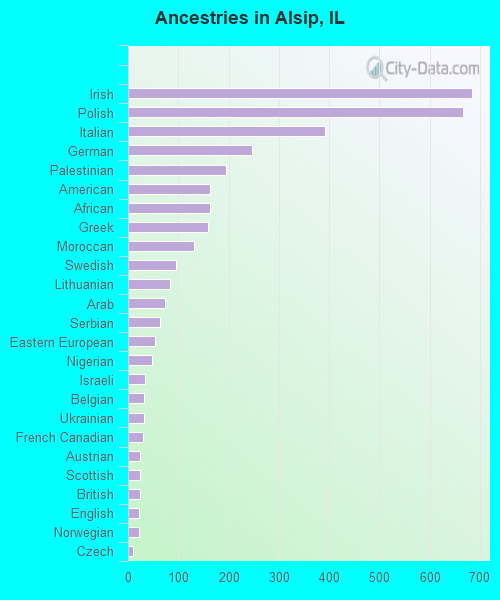
Ancestries in Alsip
684 7.1% Irish667 6.9% Polish392 4.1% Italian246 2.6% German194 2.0% Palestinian164 1.7% American164 1.7% African160 1.7% Greek132 1.4% Moroccan95 1.0% Swedish84 0.9% Lithuanian74 0.8% Arab63 0.7% Serbian54 0.6% Eastern European47 0.5% Nigerian34 0.4% Israeli31 0.3% Belgian31 0.3% Ukrainian29 0.3% French Canadian24 0.2% Austrian24 0.2% Scottish23 0.2% British21 0.2% English21 0.2% Norwegian10 0.1% Czech9 0.09% Romanian7 0.07% Danish7 0.07% Dutch7 0.07% Turkish
Children Nativity (place of birth) in Alsip
Children under 6 years - Living with two parents Both parents native 574 100.0% NativeBoth parents foreign-born 60 77.1% Native18 22.9% Foreign-bornOne native, one foreign-born parent 11 100.0% NativeChildren under 6 years - Living with one parent Native parent 533 100.0% NativeForeign-born parent 12 100.0% NativeChildren 6 to 17 years - Living with two parents Both parents native 1,072 100.0% NativeBoth parents foreign-born 222 74.2% Native77 25.8% Foreign-bornOne native, one foreign-born parent 393 100.0% NativeChildren 6 to 17 years - Living with one parent Native parent 894 100.0% NativeForeign-born parent 101 53.1% Native89 46.9% Foreign-born
Grandparents responsible for own grandchildren in Alsip
Grandparents (30 to 59 years) White / Caucasian 99 100.0% Not responsible for grandchildrenBlack or African American 47 100.0% Not responsible for grandchildrenOther race 44 71.5% Responsible for grandchildren17 28.5% Not responsible for grandchildrenTwo or more races 9 100.0% Not responsible for grandchildrenWhite alone, not Hispanic / Latino 27 100.0% Not responsible for grandchildrenHispanic or Latino 29 19.0% Responsible for grandchildren125 81.0% Not responsible for grandchildrenGrandparents (60 years and over) White / Caucasian 12 23.7% Responsible for grandchildren39 76.3% Not responsible for grandchildrenBlack or African American 40 100.0% Not responsible for grandchildrenOther race 27 100.0% Responsible for grandchildrenTwo or more races 39 100.0% Not responsible for grandchildrenWhite alone, not Hispanic / Latino 32 100.0% Not responsible for grandchildrenHispanic or Latino 49 56.3% Responsible for grandchildren38 43.7% Not responsible for grandchildren