Races in Amarillo, Texas (TX) Detailed Stats
Data:
Races - White alone (%)
Races - White alone (% change since 2000)
Races - Black alone (%)
Races - Black alone (% change since 2000)
Races - American Indian alone (%)
Races - American Indian alone (% change since 2000)
Races - Asian alone (%)
Races - Asian alone (% change since 2000)
Races - Hispanic (%)
Races - Hispanic (% change since 2000)
Races - Native Hawaiian and Other Pacific Islander alone (%)
Races - Native Hawaiian and Other Pacific Islander alone (% change since 2000)
Races - Two or more races(%)
Races - Two or more races(% change since 2000)
Races - Other race alone (%)
Races - Other race alone (% change since 2000)
Racial diversity
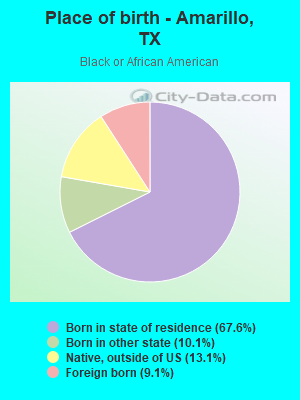
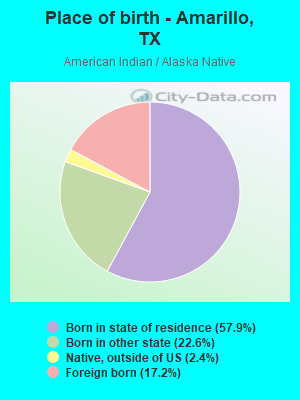
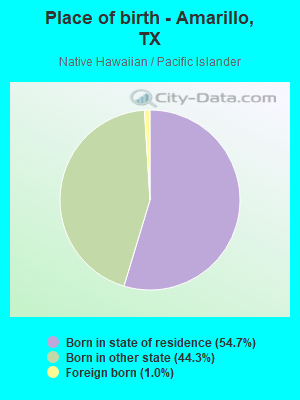
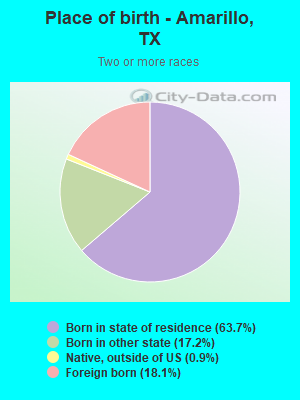
Place of birth - Born in state of residence (%)
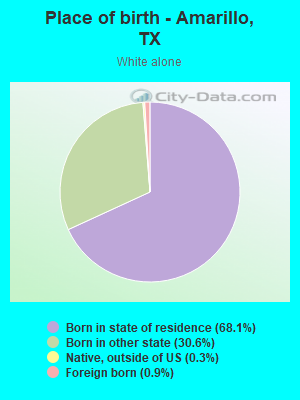
Place of birth - Born in state of residence (%) - White
Place of birth - Born in state of residence (%) - Black or African American
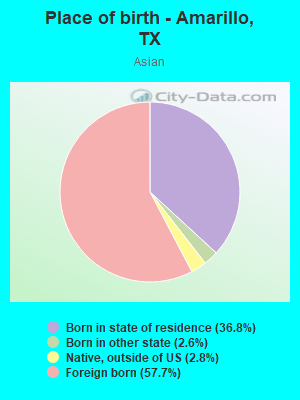
Place of birth - Born in state of residence (%) - Asian
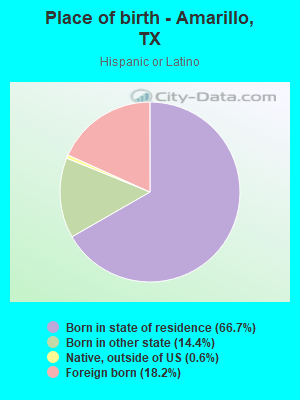
Place of birth - Born in state of residence (%) - Hispanic or Latino
Place of birth - Born in state of residence (%) - American Indian and Alaska Native
Place of birth - Born in state of residence (%) - Multirace
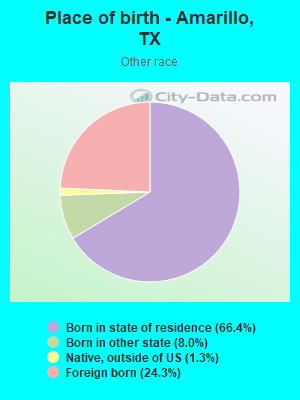
Place of birth - Born in state of residence (%) - Other Race
Place of birth - Born in other state (%)
Place of birth - Born in other state (%) - White
Place of birth - Born in other state (%) - Black or African American
Place of birth - Born in other state (%) - Asian
Place of birth - Born in other state (%) - Hispanic or Latino
Place of birth - Born in other state (%) - American Indian and Alaska Native
Place of birth - Born in other state (%) - Multirace
Place of birth - Born in other state (%) - Other Race
Place of birth - Native, outside of US (%)
Place of birth - Native, outside of US (%) - White
Place of birth - Native, outside of US (%) - Black or African American
Place of birth - Native, outside of US (%) - Asian
Place of birth - Native, outside of US (%) - Hispanic or Latino
Place of birth - Native, outside of US (%) - American Indian and Alaska Native
Place of birth - Native, outside of US (%) - Multirace
Place of birth - Native, outside of US (%) - Other Race
Place of birth - Foreign born (%)
Place of birth - Foreign born (%) - White
Place of birth - Foreign born (%) - Black or African American
Place of birth - Foreign born (%) - Asian
Place of birth - Foreign born (%) - Hispanic or Latino
Place of birth - Foreign born (%) - American Indian and Alaska Native
Place of birth - Foreign born (%) - Multirace
Place of birth - Foreign born (%) - Other Race
Residents speaking English at home (%)
Residents speaking English at home - Born in the United States (%)
Residents speaking English at home - Native, born elsewhere (%)
Residents speaking English at home - Foreign born (%)
Residents speaking Spanish at home (%)
Residents speaking Spanish at home - Born in the United States (%)
Residents speaking Spanish at home - Native, born elsewhere (%)
Residents speaking Spanish at home - Foreign born (%)
Residents speaking other language at home (%)
Residents speaking other language at home - Born in the United States (%)
Residents speaking other language at home - Native, born elsewhere (%)
Residents speaking other language at home - Foreign born (%)
Marital status - Never married (%)
Marital status - Now married (%)
Marital status - Separated (%)
Marital status - Widowed (%)
Marital status - Divorced (%)
Ancestries Reported - Arab (%)
Ancestries Reported - Czech (%)
Ancestries Reported - Danish (%)
Ancestries Reported - Dutch (%)
Ancestries Reported - English (%)
Ancestries Reported - French (%)
Ancestries Reported - French Canadian (%)
Ancestries Reported - German (%)
Ancestries Reported - Greek (%)
Ancestries Reported - Hungarian (%)
Ancestries Reported - Irish (%)
Ancestries Reported - Italian (%)
Ancestries Reported - Lithuanian (%)
Ancestries Reported - Norwegian (%)
Ancestries Reported - Polish (%)
Ancestries Reported - Portuguese (%)
Ancestries Reported - Russian (%)
Ancestries Reported - Scotch-Irish (%)
Ancestries Reported - Scottish (%)
Ancestries Reported - Slovak (%)
Ancestries Reported - Subsaharan African (%)
Ancestries Reported - Swedish (%)
Ancestries Reported - Swiss (%)
Ancestries Reported - Ukrainian (%)
Ancestries Reported - United States (%)
Ancestries Reported - Welsh (%)
Ancestries Reported - West Indian (%)
Ancestries Reported - Other (%)
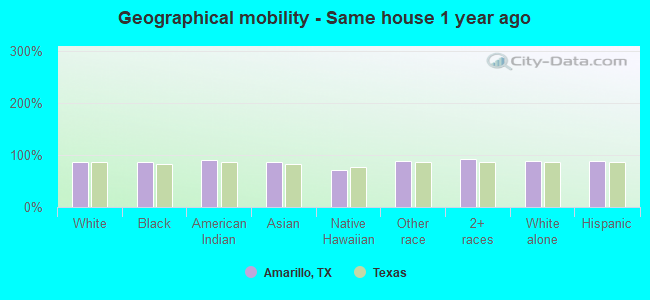
Geographical mobility - Same house 1 year ago (%)
Geographical mobility - Same house 1 year ago (%) - White
Geographical mobility - Same house 1 year ago (%) - Black or African American
Geographical mobility - Same house 1 year ago (%) - Asian
Geographical mobility - Same house 1 year ago (%) - Hispanic or Latino
Geographical mobility - Same house 1 year ago (%) - American Indian and Alaska Native
Geographical mobility - Same house 1 year ago (%) - Multirace
Geographical mobility - Same house 1 year ago (%) - Other Race
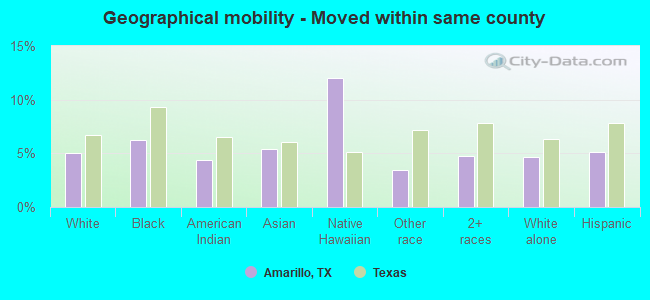
Geographical mobility - Moved within same county (%)
Geographical mobility - Moved within same county (%) - White
Geographical mobility - Moved within same county (%) - Black or African American
Geographical mobility - Moved within same county (%) - Asian
Geographical mobility - Moved within same county (%) - Hispanic or Latino
Geographical mobility - Moved within same county (%) - American Indian and Alaska Native
Geographical mobility - Moved within same county (%) - Multirace
Geographical mobility - Moved within same county (%) - Other Race
Geographical mobility - Moved from different county within same state (%)
Geographical mobility - Moved from different county within same state (%) - White
Geographical mobility - Moved from different county within same state (%) - Black or African American
Geographical mobility - Moved from different county within same state (%) - Asian
Geographical mobility - Moved from different county within same state (%) - Hispanic or Latino
Geographical mobility - Moved from different county within same state (%) - American Indian and Alaska Native
Geographical mobility - Moved from different county within same state (%) - Multirace
Geographical mobility - Moved from different county within same state (%) - Other Race
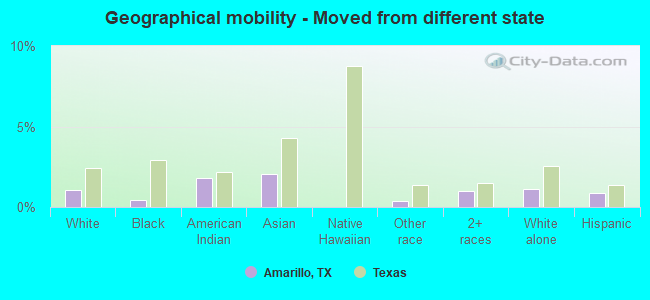
Geographical mobility - Moved from different state (%)
Geographical mobility - Moved from different state (%) - White
Geographical mobility - Moved from different state (%) - Black or African American
Geographical mobility - Moved from different state (%) - Asian
Geographical mobility - Moved from different state (%) - Hispanic or Latino
Geographical mobility - Moved from different state (%) - American Indian and Alaska Native
Geographical mobility - Moved from different state (%) - Multirace
Geographical mobility - Moved from different state (%) - Other Race
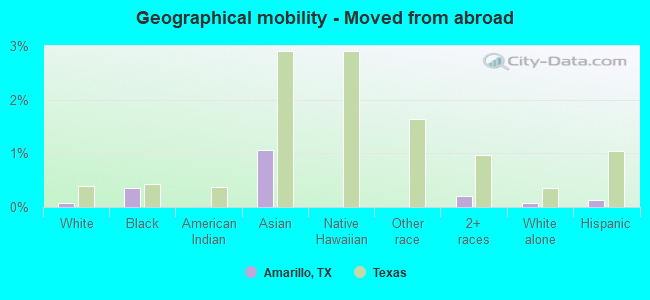
Geographical mobility - Moved from abroad (%)
Geographical mobility - Moved from abroad (%) - White
Geographical mobility - Moved from abroad (%) - Black or African American
Geographical mobility - Moved from abroad (%) - Asian
Geographical mobility - Moved from abroad (%) - Hispanic or Latino
Geographical mobility - Moved from abroad (%) - American Indian and Alaska Native
Geographical mobility - Moved from abroad (%) - Multirace
Geographical mobility - Moved from abroad (%) - Other Race
Place of birth for the foreign-born population - Ireland (%)
Place of birth for the foreign-born population - Denmark (%)
Place of birth for the foreign-born population - Norway (%)
Place of birth for the foreign-born population - Sweden (%)
Place of birth for the foreign-born population - United Kingdom (%)
Place of birth for the foreign-born population - England (%)
Place of birth for the foreign-born population - Scotland (%)
Place of birth for the foreign-born population - Other Northern Europe (%)
Place of birth for the foreign-born population - Austria (%)
Place of birth for the foreign-born population - Belgium (%)
Place of birth for the foreign-born population - France (%)
Place of birth for the foreign-born population - Germany (%)
Place of birth for the foreign-born population - Netherlands (%)
Place of birth for the foreign-born population - Switzerland (%)
Place of birth for the foreign-born population - Other Western Europe (%)
Place of birth for the foreign-born population - Greece (%)
Place of birth for the foreign-born population - Italy (%)
Place of birth for the foreign-born population - Portugal (%)
Place of birth for the foreign-born population - Spain (%)
Place of birth for the foreign-born population - Other Southern Europe (%)
Place of birth for the foreign-born population - Albania (%)
Place of birth for the foreign-born population - Belarus (%)
Place of birth for the foreign-born population - Bosnia and Herzegovina (%)
Place of birth for the foreign-born population - Bulgaria (%)
Place of birth for the foreign-born population - Croatia (%)
Place of birth for the foreign-born population - Czechoslovakia (%)
Place of birth for the foreign-born population - Hungary (%)
Place of birth for the foreign-born population - Latvia (%)
Place of birth for the foreign-born population - Lithuania (%)
Place of birth for the foreign-born population - North Macedonia (Macedonia) (%)
Place of birth for the foreign-born population - Moldova (%)
Place of birth for the foreign-born population - Poland (%)
Place of birth for the foreign-born population - Romania (%)
Place of birth for the foreign-born population - Russia (%)
Place of birth for the foreign-born population - Serbia (%)
Place of birth for the foreign-born population - Ukraine (%)
Place of birth for the foreign-born population - Other Eastern Europe (%)
Place of birth for the foreign-born population - China (%)
Place of birth for the foreign-born population - Hong Kong (%)
Place of birth for the foreign-born population - Taiwan (%)
Place of birth for the foreign-born population - Japan (%)
Place of birth for the foreign-born population - Korea (%)
Place of birth for the foreign-born population - Other Eastern Asia (%)
Place of birth for the foreign-born population - Afghanistan (%)
Place of birth for the foreign-born population - Bangladesh (%)
Place of birth for the foreign-born population - India (%)
Place of birth for the foreign-born population - Iran (%)
Place of birth for the foreign-born population - Kazakhstan (%)
Place of birth for the foreign-born population - Nepal (%)
Place of birth for the foreign-born population - Pakistan (%)
Place of birth for the foreign-born population - Sri Lanka (%)
Place of birth for the foreign-born population - Uzbekistan (%)
Place of birth for the foreign-born population - Other South Central Asia (%)
Place of birth for the foreign-born population - Burma (%)
Place of birth for the foreign-born population - Cambodia (%)
Place of birth for the foreign-born population - Indonesia (%)
Place of birth for the foreign-born population - Laos (%)
Place of birth for the foreign-born population - Malaysia (%)
Place of birth for the foreign-born population - Philippines (%)
Place of birth for the foreign-born population - Singapore (%)
Place of birth for the foreign-born population - Thailand (%)
Place of birth for the foreign-born population - Vietnam (%)
Place of birth for the foreign-born population - Other South Eastern Asia (%)
Place of birth for the foreign-born population - Armenia (%)
Place of birth for the foreign-born population - Iraq (%)
Place of birth for the foreign-born population - Israel (%)
Place of birth for the foreign-born population - Jordan (%)
Place of birth for the foreign-born population - Kuwait (%)
Place of birth for the foreign-born population - Lebanon (%)
Place of birth for the foreign-born population - Saudi Arabia (%)
Place of birth for the foreign-born population - Syria (%)
Place of birth for the foreign-born population - Turkey (%)
Place of birth for the foreign-born population - Yemen (%)
Place of birth for the foreign-born population - Other Western Asia (%)
Place of birth for the foreign-born population - Eritrea (%)
Place of birth for the foreign-born population - Ethiopia (%)
Place of birth for the foreign-born population - Kenya (%)
Place of birth for the foreign-born population - Somalia (%)
Place of birth for the foreign-born population - Uganda (%)
Place of birth for the foreign-born population - Zimbabwe (%)
Place of birth for the foreign-born population - Other Eastern Africa (%)
Place of birth for the foreign-born population - Cameroon (%)
Place of birth for the foreign-born population - Congo (%)
Place of birth for the foreign-born population - Democratic Republic of Congo (Zaire) (%)
Place of birth for the foreign-born population - Other Middle Africa (%)
Place of birth for the foreign-born population - Egypt (%)
Place of birth for the foreign-born population - Morocco (%)
Place of birth for the foreign-born population - Sudan (%)
Place of birth for the foreign-born population - Other Northern Africa (%)
Place of birth for the foreign-born population - South Africa (%)
Place of birth for the foreign-born population - Other Southern Africa (%)
Place of birth for the foreign-born population - Cabo Verde (%)
Place of birth for the foreign-born population - Ghana (%)
Place of birth for the foreign-born population - Liberia (%)
Place of birth for the foreign-born population - Nigeria (%)
Place of birth for the foreign-born population - Senegal (%)
Place of birth for the foreign-born population - Sierra Leone (%)
Place of birth for the foreign-born population - Other Western Africa (%)
Place of birth for the foreign-born population - Australia (%)
Place of birth for the foreign-born population - New Zealand (%)
Place of birth for the foreign-born population - Fiji (%)
Place of birth for the foreign-born population - Micronesia (%)
Place of birth for the foreign-born population - Bahamas (%)
Place of birth for the foreign-born population - Barbados (%)
Place of birth for the foreign-born population - Cuba (%)
Place of birth for the foreign-born population - Dominica (%)
Place of birth for the foreign-born population - Dominican Republic (%)
Place of birth for the foreign-born population - Grenada (%)
Place of birth for the foreign-born population - Haiti (%)
Place of birth for the foreign-born population - Jamaica (%)
Place of birth for the foreign-born population - St. Vincent and the Grenadines (%)
Place of birth for the foreign-born population - Trinidad and Tobago (%)
Place of birth for the foreign-born population - West Indies (%)
Place of birth for the foreign-born population - Other Caribbean (%)
Place of birth for the foreign-born population - Belize (%)
Place of birth for the foreign-born population - Costa Rica (%)
Place of birth for the foreign-born population - El Salvador (%)
Place of birth for the foreign-born population - Guatemala (%)
Place of birth for the foreign-born population - Honduras (%)
Place of birth for the foreign-born population - Mexico (%)
Place of birth for the foreign-born population - Nicaragua (%)
Place of birth for the foreign-born population - Panama (%)
Place of birth for the foreign-born population - Other Central America (%)
Place of birth for the foreign-born population - Argentina (%)
Place of birth for the foreign-born population - Bolivia (%)
Place of birth for the foreign-born population - Brazil (%)
Place of birth for the foreign-born population - Chile (%)
Place of birth for the foreign-born population - Colombia (%)
Place of birth for the foreign-born population - Ecuador (%)
Place of birth for the foreign-born population - Guyana (%)
Place of birth for the foreign-born population - Peru (%)
Place of birth for the foreign-born population - Uruguay (%)
Place of birth for the foreign-born population - Venezuela (%)
Place of birth for the foreign-born population - Other South America (%)
Place of birth for the foreign-born population - Canada (%)
Place of birth for the foreign-born population - Other Northern America (%)
Place of birth for the foreign-born population - Other (%)
Latest news about races in Amarillo, TX collected exclusively by city-data.com from local newspapers, TV, and radio stations
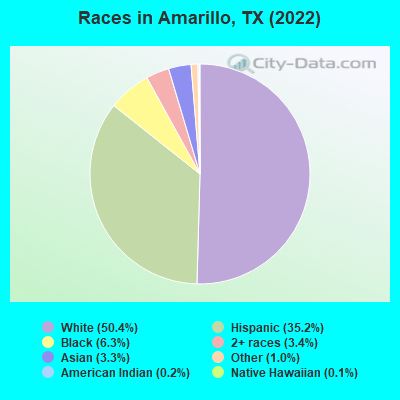
According to 2022 data, the most numerous races in Amarillo, TX are Hispanic (71,703 residents), White alone (102,643 residents), and Black alone (12,870 residents). 77.6% of Amarillo residents speak English at home. 12.0% of Amarillo, TX residents are foreign-born (6.5% born in Latin America, 2.9% born in Asia, 1.3% born in Africa), which is 41.7% less than the foreign-born rate of 17.0% across the entire state of Texas.
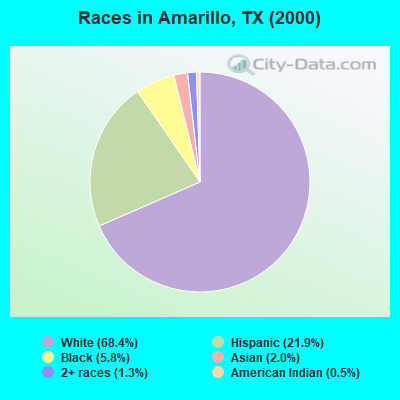
Race distribution in Amarillo
2000 2022
118,821 68.4% White alone 37,947 21.9% Hispanic 10,067 5.8% Black alone 3,484 2.0% Asian alone 2,201 1.3% Two or more races 948 0.5% American Indian alone 117 0.07% Other race alone 42 0.02% Native Hawaiian and Other
102,643 50.4% White alone 71,703 35.2% Hispanic 12,870 6.3% Black alone 6,997 3.4% Two or more races 6,728 3.3% Asian alone 2,001 1.0% Other race alone 312 0.2% American Indian alone 223 0.1% Native Hawaiian and Other
2000 2022
10,933,313 52.4% White alone 6,669,666 32.0% Hispanic 2,364,255 11.3% Black alone 554,445 2.7% Asian alone 230,567 1.1% Two or more races 68,859 0.3% American Indian alone 19,958 0.10% Other race alone 10,757 0.05% Native Hawaiian and Other
12,070,642 40.2% Hispanic 11,683,430 38.9% White alone 3,508,706 11.7% Black alone 1,608,173 5.4% Asian alone 956,560 3.2% Two or more races 125,763 0.4% Other race alone 47,023 0.2% American Indian alone 29,275 0.10% Native Hawaiian and Other
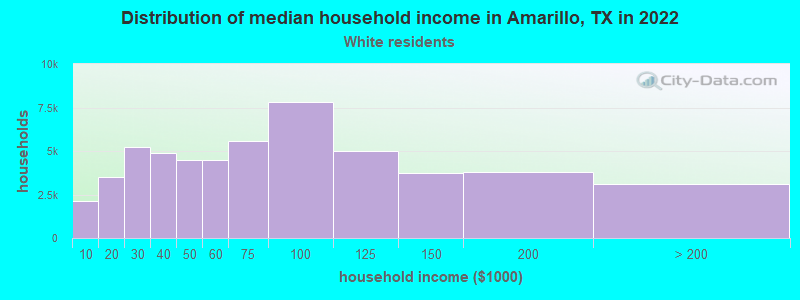
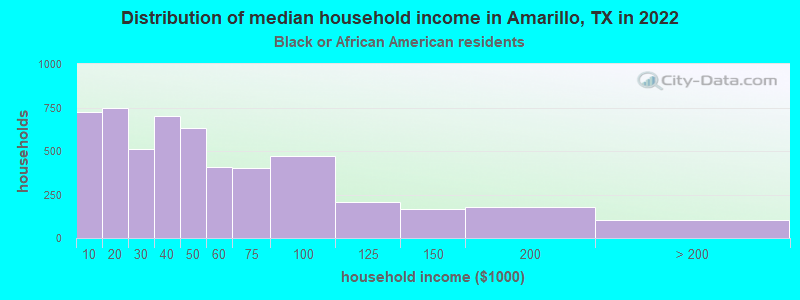
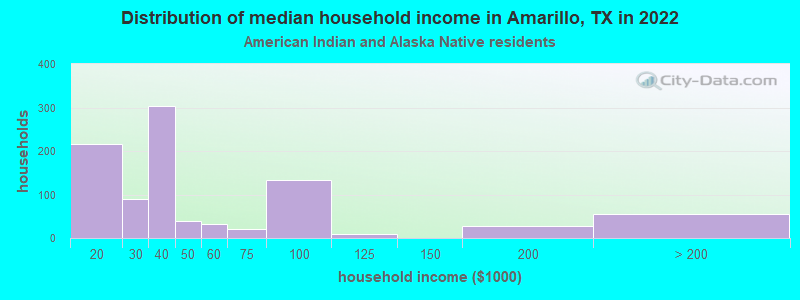
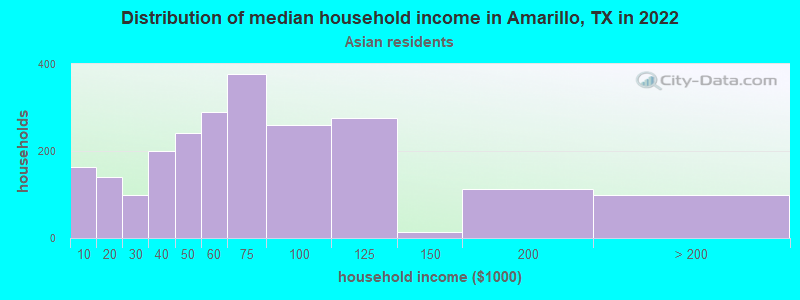
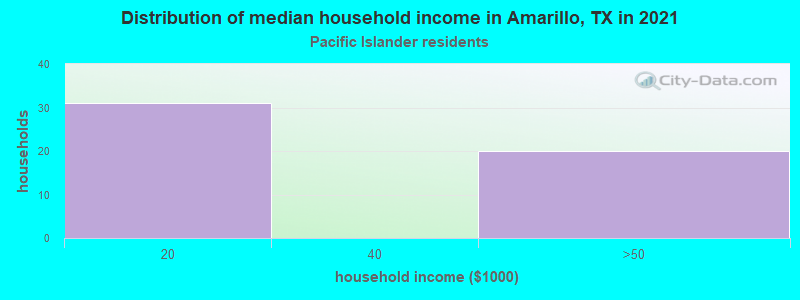
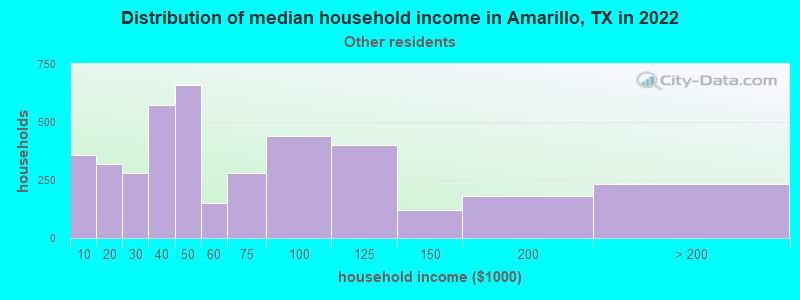
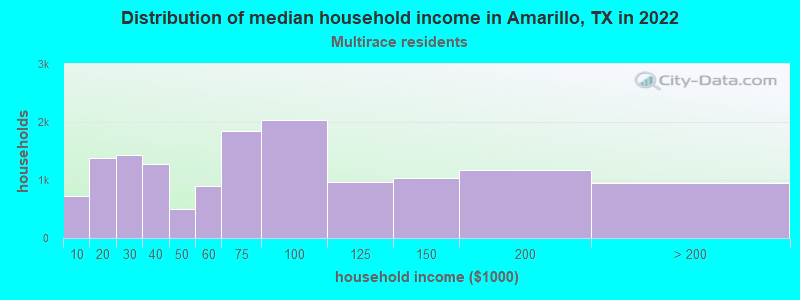
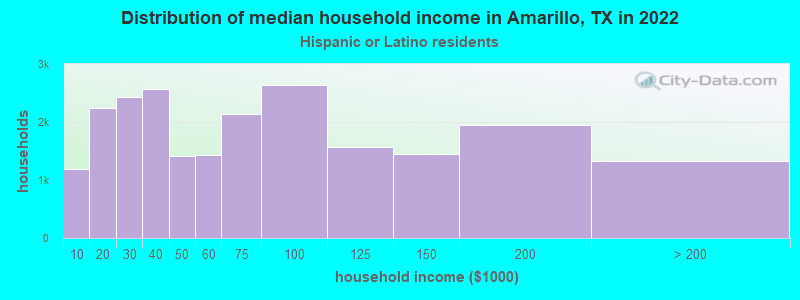
Income and house value in Amarillo Median household income in 2022 $63,780 White non-Hispanic householders$31,493 Black householders$55,778 American Indian and Alaska Native householders$76,680 Asian householders$40,922 Some other race householders$63,480 Two or more races householders$58,432 Hispanic or Latino race householdersMedian 2022 house value $222,761 White Non-Hispanic householders$109,080 Black or African American householders$211,664 American Indian or Alaska Native householders $142,913 Asian householders$120,718 Some other race householders$166,732 Two or more races householders$121,260 Hispanic or Latino householders
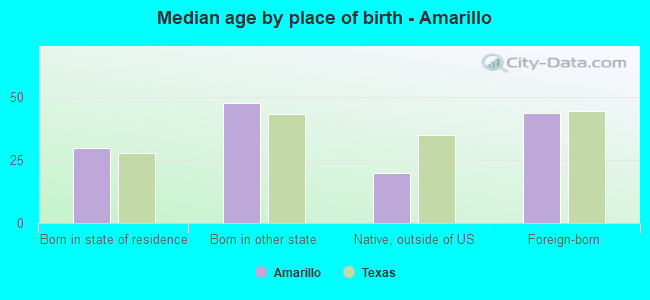
Median age by race in Amarillo
40.0 Median age for White residents38.7 41.7 26.8 Median age for Black or African American residents23.6 29.5 22.1 Median age for American Indian / Alaska Native residents19.2 19.9 22.2 Median age for Asian residents23.5 21.7 9.0 Median age for Native Hawaiian / Pacific Islander residents-666,666,666.0 7.5 32.4 Median age for Other race residents29.6 34.2 30.1 Median age for Two or more races residents30.7 29.6 42.7 Median age for White alone residents40.9 45.1 28.3 Median age for Hispanic or Latino residents26.9 29.3
Owner/renter occupied households by race in Amarillo
House owners and renters - White residents 34,412 64.2% Owner occupied19,179 35.8% Renter occupiedHouse owners and renters - Black or African American residents 1,572 38.2% Owner occupied2,538 61.8% Renter occupiedHouse owners and renters - American Indian / Alaska Native residents 351 40.0% Owner occupied527 60.0% Renter occupiedHouse owners and renters - Asian residents 1,504 71.5% Owner occupied600 28.5% Renter occupiedHouse owners and renters - Native Hawaiian / Pacific Islander residents 69 72.5% Owner occupied26 27.5% Renter occupiedHouse owners and renters - Other race residents 2,531 57.3% Owner occupied1,889 42.7% Renter occupiedHouse owners and renters - Two or more races residents 8,834 62.2% Owner occupied5,363 37.8% Renter occupiedHouse owners and renters - White alone residents 31,587 66.0% Owner occupied16,278 34.0% Renter occupiedHouse owners and renters - Hispanic or Latino residents 12,550 56.2% Owner occupied9,798 43.8% Renter occupied
Language usage in Amarillo
English speakers - Total 77.6% of residents of Amarillo speak English at home.
18.1% of residents speak Spanish at home 26,188 76.4% Speak English very well8,087 23.6% Speak English less than very well4.3% of residents speak other language at home 6,284 77.4% Speak English very well1,840 22.6% Speak English less than very well
English speakers - Born in the United States 90.6% of residents of Amarillo speak English at home.
8.7% of residents speak Spanish at home 3,637 92.5% Speak English very well295 7.5% Speak English less than very well0.8% of residents speak other language at home 345 100.0% Speak English very well
English speakers - Native, born elsewhere 57.4% of residents of Amarillo speak English at home.
13.1% of residents speak Spanish at home 341 100.0% Speak English very well29.5% of residents speak other language at home 566 73.4% Speak English very well205 26.6% Speak English less than very well
English speakers - Foreign-born 5.4% of residents of Amarillo speak English at home.
64.0% of residents speak Spanish at home 6,767 52.8% Speak English very well6,058 47.2% Speak English less than very well30.6% of residents speak other language at home 4,642 75.7% Speak English very well1,490 24.3% Speak English less than very well
White (Caucasian) - Speak only English Native:
95.8% (105,985)Foreign-born:
11.2% (316)
White (Caucasian) - Speak another language Native:
4.2% (4,672)Foreign-born:
88.8% (2,494)
Black or African American - Speak only English Native:
93.7% (10,148)Foreign-born:
17.8% (412)
Black or African American - Speak another language Native:
6.2% (674)Foreign-born:
84.5% (1,959)
American Indian / Alaska Native - Speak only English Native:
71.6% (1,175)Foreign-born:
5.4% (19)
American Indian / Alaska Native - Speak another language Native:
21.4% (351)Foreign-born:
94.3% (335)
Asian - Speak only English Native:
58.3% (1,240)Foreign-born:
6.2% (260)
Asian - Speak another language Native:
41.7% (887)Foreign-born:
93.8% (3,943)
Native Hawaiian / Pacific Islander - Speak only English Native:
78.0% (324)Foreign-born:
51.5% (3)
Other race - Speak only English Native:
51.9% (5,577)Foreign-born:
1.3% (43)
Other race - Speak another language Native:
48.1% (5,163)Foreign-born:
98.7% (3,229)
Two or more races - Speak only English Native:
64.5% (21,328)Foreign-born:
2.0% (165)
Two or more races - Speak another language Native:
35.5% (11,737)Foreign-born:
98.0% (7,964)
White alone - Speak only English Native:
98.5% (95,487)Foreign-born:
26.6% (536)
White alone - Speak another language Native:
1.6% (1,540)Foreign-born:
73.3% (1,475)
Hispanic or Latino - Speak only English Native:
60.7% (31,610)Foreign-born:
3.6% (475)
Hispanic or Latino - Speak another language Native:
39.3% (20,449)Foreign-born:
96.4% (12,603)
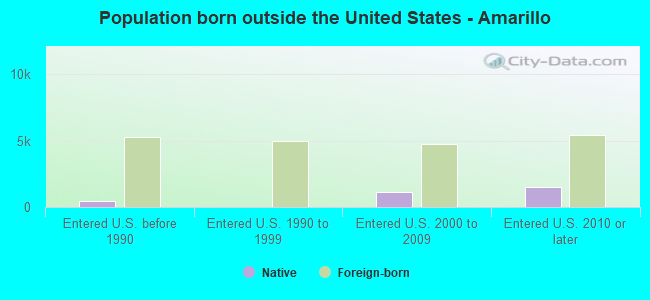
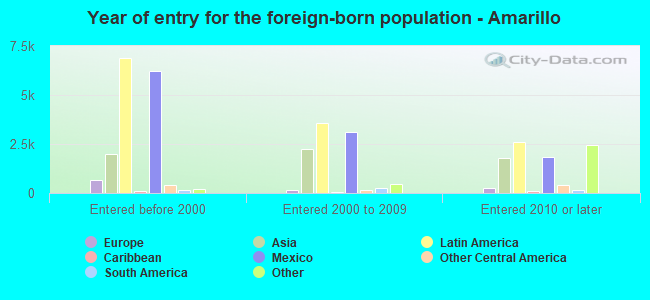
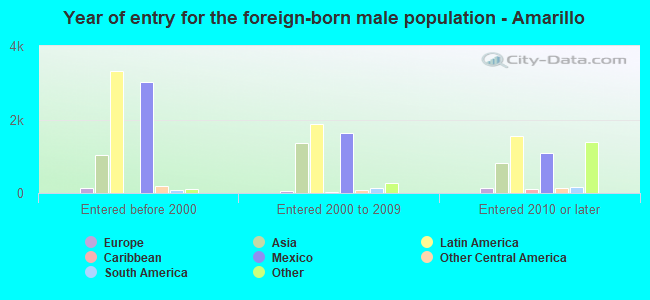
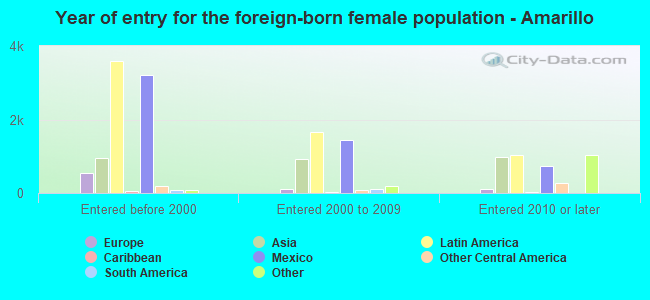
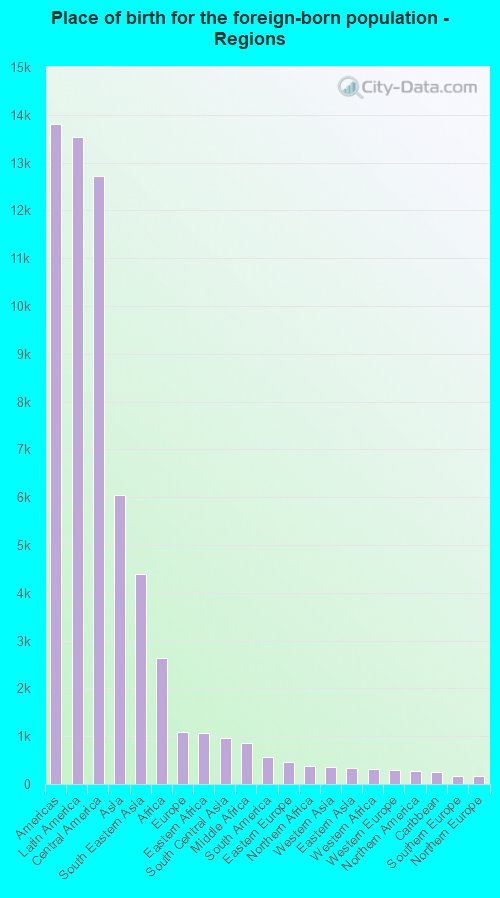
Foreign-born residents in Amarillo 23,576 residents are foreign born (6.5% Latin America , 2.9% Asia , 1.3% Africa ).
This city:
12.0%Texas:
17.1%
Marital status for residents in Amarillo Marital status - White (Caucasian) population 15 years and over
Males 29.8% Never married54.7% Now married0.8% Separated3.0% Widowed11.7% DivorcedFemales 21.1% Never married48.0% Now married2.1% Separated11.0% Widowed17.9% DivorcedWomen who gave birth in the past 12 months Now married:
95.7% (1,529)Unmarried:
4.3% (69)
Women who did not give birth in the past 12 months Now married:
44.0% (11,716)Unmarried:
56.0% (14,937)
Marital status - Black or African American population 15 years and over
Males 43.7% Never married31.2% Now married5.2% Separated3.8% Widowed16.0% DivorcedFemales 57.1% Never married26.5% Now married0.9% Separated8.3% Widowed7.2% DivorcedWomen who gave birth in the past 12 months Now married:
75.7% (305)Unmarried:
24.3% (98)
Women who did not give birth in the past 12 months Now married:
24.8% (769)Unmarried:
75.2% (2,326)
Marital status - American Indian / Alaska Native population 15 years and over
Males 51.2% Never married17.0% Now married6.4% Separated11.6% Widowed13.7% DivorcedFemales 35.9% Never married49.4% Now married5.0% Separated7.1% Widowed2.6% DivorcedWomen who gave birth in the past 12 months Now married:
50.0% (14)Unmarried:
50.0% (14)
Women who did not give birth in the past 12 months Now married:
45.9% (211)Unmarried:
54.1% (248)
Marital status - Asian population 15 years and over
Males 36.7% Never married53.5% Now married2.2% Separated4.0% Widowed3.5% DivorcedFemales 25.0% Never married58.3% Now married0.0% Separated6.6% Widowed10.1% DivorcedWomen who gave birth in the past 12 months Now married:
100.0% (56)Unmarried:
0.0% (0)
Women who did not give birth in the past 12 months Now married:
57.7% (1,228)Unmarried:
42.3% (901)
Marital status - Native Hawaiian / Pacific Islander population 15 years and over
Males 0.0% Never married100.0% Now married0.0% Separated0.0% Widowed0.0% DivorcedFemales 12.5% Never married58.0% Now married0.0% Separated18.8% Widowed10.7% DivorcedWomen who did not give birth in the past 12 months Now married:
100.0% (41)Unmarried:
0.0% (0)
Marital status - Other race population 15 years and over
Males 40.9% Never married48.7% Now married0.7% Separated0.0% Widowed9.6% DivorcedFemales 33.3% Never married43.1% Now married7.4% Separated7.7% Widowed8.6% DivorcedWomen who gave birth in the past 12 months Now married:
100.0% (633)Unmarried:
0.0% (0)
Women who did not give birth in the past 12 months Now married:
45.8% (1,602)Unmarried:
54.2% (1,899)
Marital status - Two or more races population 15 years and over
Males 36.6% Never married49.5% Now married0.0% Separated3.7% Widowed10.2% DivorcedFemales 34.4% Never married44.3% Now married3.7% Separated5.1% Widowed12.4% DivorcedWomen who gave birth in the past 12 months Now married:
42.1% (138)Unmarried:
57.9% (190)
Women who did not give birth in the past 12 months Now married:
42.1% (4,468)Unmarried:
57.9% (6,138)
Marital status - White alone, not Hispanic / Latino population 15 years and over
Males 27.9% Never married55.2% Now married0.9% Separated3.4% Widowed12.6% DivorcedFemales 18.8% Never married50.1% Now married2.0% Separated11.9% Widowed17.2% DivorcedWomen who gave birth in the past 12 months Now married:
100.0% (933)Unmarried:
0.0% (0)
Women who did not give birth in the past 12 months Now married:
47.4% (10,150)Unmarried:
52.6% (11,274)
Marital status - Hispanic or Latino population 15 years and over
Males 39.9% Never married49.6% Now married0.7% Separated1.1% Widowed8.8% DivorcedFemales 33.0% Never married42.1% Now married4.3% Separated5.9% Widowed14.7% DivorcedWomen who gave birth in the past 12 months Now married:
85.4% (1,517)Unmarried:
14.6% (259)
Women who did not give birth in the past 12 months Now married:
39.7% (6,858)Unmarried:
60.3% (10,430)
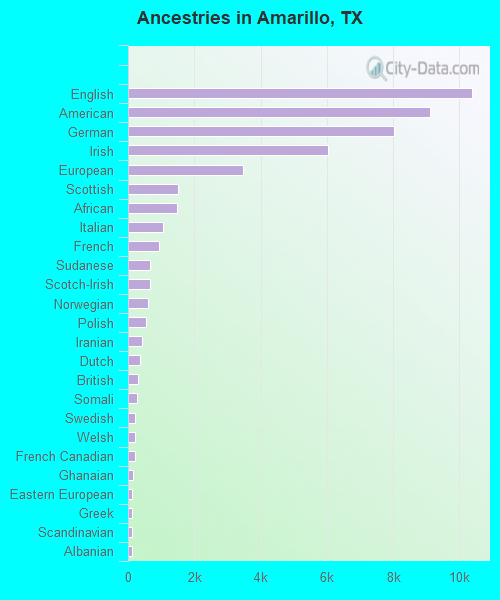
Ancestries in Amarillo
10,378 8.8% English9,110 7.7% American8,029 6.8% German6,042 5.1% Irish3,463 2.9% European1,514 1.3% Scottish1,494 1.3% African1,050 0.9% Italian948 0.8% French671 0.6% Sudanese662 0.6% Scotch-Irish604 0.5% Norwegian530 0.5% Polish414 0.4% Iranian349 0.3% Dutch295 0.3% British267 0.2% Somali223 0.2% Swedish215 0.2% Welsh210 0.2% French Canadian148 0.1% Ghanaian131 0.1% Eastern European120 0.1% Greek118 0.1% Scandinavian111 0.09% Albanian110 0.09% Russian97 0.08% Ethiopian96 0.08% Lebanese89 0.08% Romanian87 0.07% Iraqi82 0.07% Austrian79 0.07% Jamaican78 0.07% Afghan76 0.06% Basque74 0.06% Hungarian66 0.06% Czech63 0.05% Nigerian56 0.05% Croatian43 0.04% Arab40 0.03% Canadian34 0.03% Danish30 0.03% Slavic29 0.02% Ugandan27 0.02% Northern European23 0.02% Yugoslavian22 0.02% Turkish21 0.02% Czechoslovakian19 0.02% Syrian16 0.01% Swiss14 0.01% Cajun12 0.01% British West Indian10 0.01% Armenian9 0.01% Celtic8 0.01% Portuguese8 0.01% West Indian6 0.01% Sierra Leonean
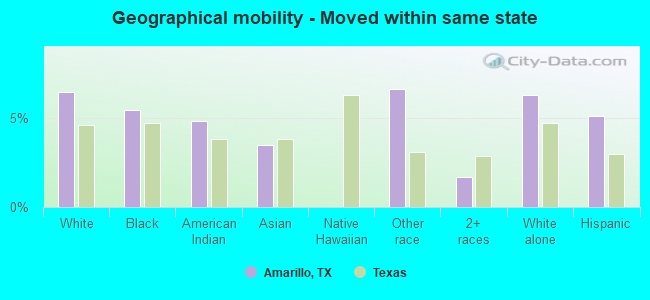
Geographical mobility in Amarillo Same house 1 year ago 103,967 87.4% White (Caucasian)12,448 87.6% Black or African American2,072 89.8% American Indian / Alaska Native7,760 87.4% Asian304 71.7% Native Hawaiian / Pacific Islander12,752 89.6% Other race40,694 92.3% Two or more races89,286 87.9% White alone, not Hispanic / Latino61,896 88.8% Hispanic or LatinoMoved within same county 5,981 5.0% White / Caucasian882 6.2% Black or African American100 4.3% American Indian / Alaska Native480 5.4% Asian51 12.0% Native Hawaiian / Pacific Islander484 3.4% Other race2,115 4.8% Two or more races4,713 4.6% White alone, not Hispanic / Latino3,578 5.1% Hispanic or LatinoMoved within same state 7,626 6.4% White / Caucasian773 5.4% Black or African American111 4.8% American Indian / Alaska Native309 3.5% Asian941 6.6% Other race748 1.7% Two or more races6,361 6.3% White alone, not Hispanic / Latino3,543 5.1% Hispanic or LatinoMoved from different state 1,287 1.1% White / Caucasian64 0.4% Black or African American41 1.8% American Indian / Alaska Native183 2.1% Asian56 0.4% Other race432 1.0% Two or more races1,166 1.1% White alone, not Hispanic / Latino609 0.9% Hispanic or LatinoMoved from abroad 84 0.1% White51 0.4% Black or African American95 1.1% Asian93 0.2% Two or more races84 0.1% White alone, not Hispanic / Latino93 0.1% Hispanic or Latino
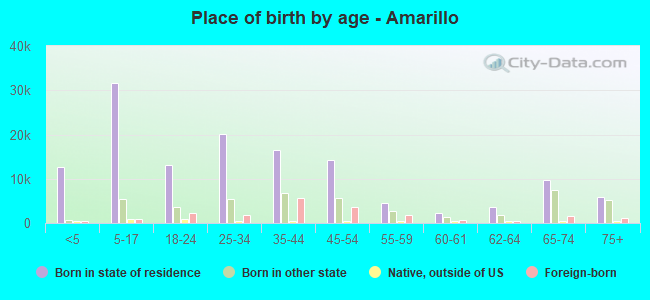
Children Nativity (place of birth) in Amarillo
Children under 6 years - Living with two parents Both parents native 8,895 100.0% NativeBoth parents foreign-born 280 100.0% NativeOne native, one foreign-born parent 1,131 100.0% NativeChildren under 6 years - Living with one parent Native parent 5,087 100.0% NativeChildren 6 to 17 years - Living with two parents Both parents native 16,423 100.0% NativeBoth parents foreign-born 2,548 86.4% Native401 13.6% Foreign-bornOne native, one foreign-born parent 3,523 100.0% NativeChildren 6 to 17 years - Living with one parent Native parent 10,939 100.0% NativeForeign-born parent 1,449 54.9% Native1,189 45.1% Foreign-born
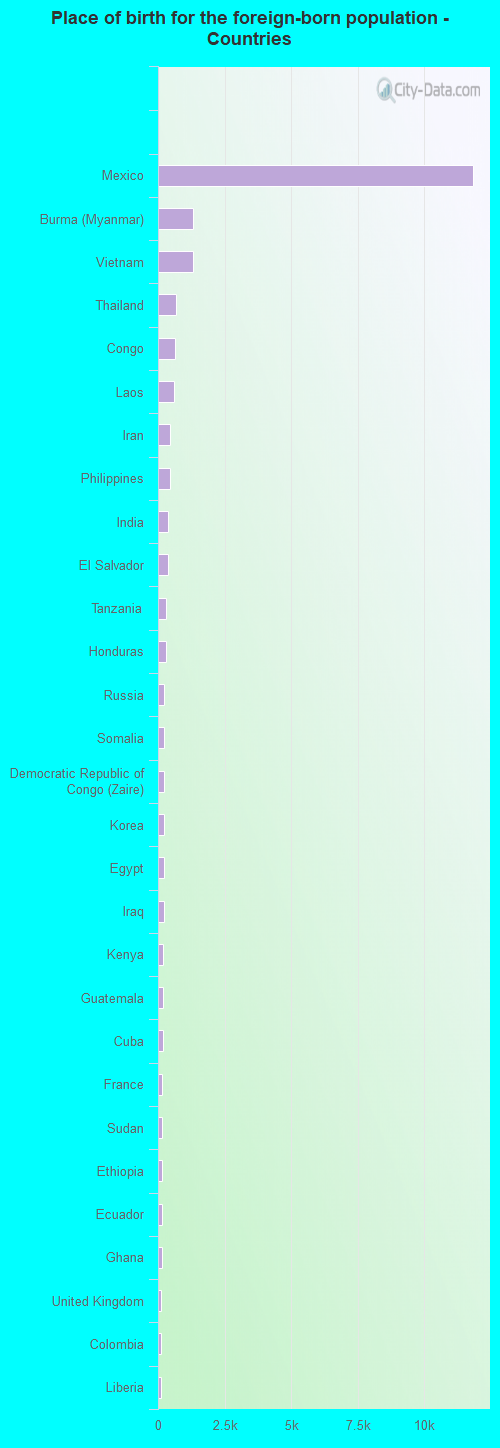
Place of birth for residents in Amarillo 13,812 Americas13,529 Latin America12,714 Central America6,046 Asia4,384 South Eastern Asia2,637 Africa1,080 Europe1,067 Eastern Africa963 South Central Asia865 Middle Africa560 South America450 Eastern Europe373 Northern Africa357 Western Asia339 Eastern Asia311 Western Africa292 Western Europe282 Northern America253 Caribbean170 Southern Europe166 Northern Europe110 China11,829 Mexico1,313 Burma (Myanmar)1,296 Vietnam678 Thailand641 Congo613 Laos464 Iran455 Philippines374 India373 El Salvador318 Tanzania302 Honduras236 Russia234 Somalia223 Democratic Republic of Congo (Zaire)219 Korea218 Egypt209 Iraq203 Kenya196 Guatemala181 Cuba168 France154 Sudan147 Ethiopia145 Ecuador135 Ghana128 United Kingdom128 Colombia119 Liberia96 Germany87 Bosnia and Herzegovina87 Spain78 Brazil77 Peru75 Greece70 Argentina67 Canada63 Hong Kong55 Poland49 Pakistan48 Nigeria47 China41 Venezuela40 Yemen38 Bangladesh37 Afghanistan35 Dominican Republic32 Uganda26 Dominica24 England23 Jordan22 Azerbaijan21 Syria20 Turkey18 Lebanon16 Hungary14 Cambodia14 Austria13 Ukraine13 Ireland12 Malaysia12 Belgium10 Jamaica10 Romania10 Panama9 Japan8 Sierra Leone8 Italy2 Nicaragua
Grandparents responsible for own grandchildren in Amarillo
Grandparents (30 to 59 years) White / Caucasian 291 62.6% Responsible for grandchildren174 37.4% Not responsible for grandchildrenBlack or African American 85 42.9% Responsible for grandchildren113 57.1% Not responsible for grandchildrenAmerican Indian / Alaska Native 8 100.0% Not responsible for grandchildrenAsian 259 100.0% Responsible for grandchildrenOther race 26 31.9% Responsible for grandchildren56 68.1% Not responsible for grandchildrenTwo or more races 369 67.7% Responsible for grandchildren177 32.3% Not responsible for grandchildrenWhite alone, not Hispanic / Latino 110 60.4% Responsible for grandchildren72 39.6% Not responsible for grandchildrenHispanic or Latino 679 68.8% Responsible for grandchildren308 31.2% Not responsible for grandchildrenGrandparents (60 years and over) White / Caucasian 225 33.2% Responsible for grandchildren452 66.8% Not responsible for grandchildrenBlack or African American 80 41.1% Responsible for grandchildren115 58.9% Not responsible for grandchildrenAmerican Indian / Alaska Native 4 32.9% Responsible for grandchildren8 67.1% Not responsible for grandchildrenAsian 21 18.2% Responsible for grandchildren96 81.8% Not responsible for grandchildrenOther race 255 87.0% Responsible for grandchildren38 13.0% Not responsible for grandchildrenTwo or more races 124 51.4% Responsible for grandchildren117 48.6% Not responsible for grandchildrenWhite alone, not Hispanic / Latino 225 40.2% Responsible for grandchildren335 59.8% Not responsible for grandchildrenHispanic or Latino 390 60.7% Responsible for grandchildren252 39.3% Not responsible for grandchildren
Zip codes: 79101 , 79102 , 79103 , 79104 , 79106 , 79107 , 79108 , 79109 , 79110 , 79111 , 79118 , 79119 , 79121 , 79124 .