Races in American Fork, Utah (UT) Detailed Stats
Data:
Races - White alone (%)
Races - White alone (% change since 2000)
Races - Black alone (%)
Races - Black alone (% change since 2000)
Races - American Indian alone (%)
Races - American Indian alone (% change since 2000)
Races - Asian alone (%)
Races - Asian alone (% change since 2000)
Races - Hispanic (%)
Races - Hispanic (% change since 2000)
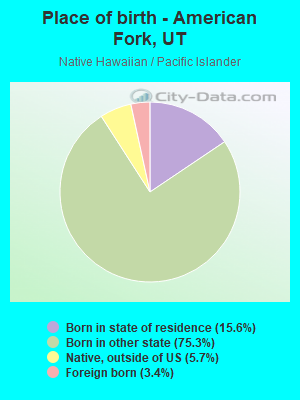
Races - Native Hawaiian and Other Pacific Islander alone (%)
Races - Native Hawaiian and Other Pacific Islander alone (% change since 2000)
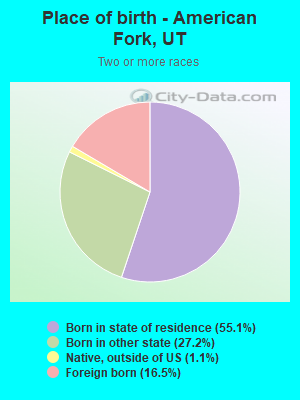
Races - Two or more races(%)
Races - Two or more races(% change since 2000)
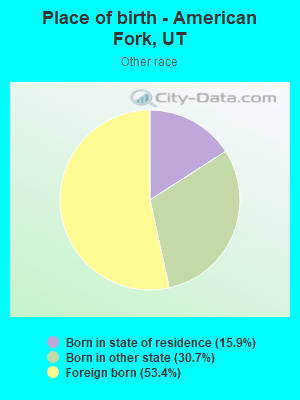
Races - Other race alone (%)
Races - Other race alone (% change since 2000)
Racial diversity
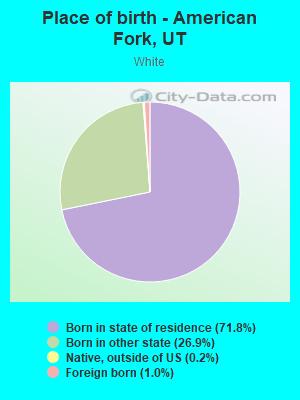
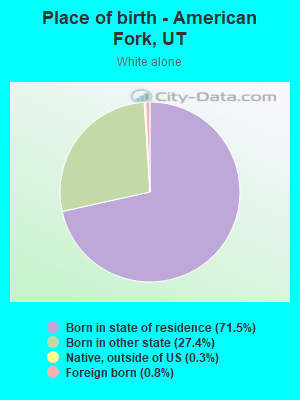
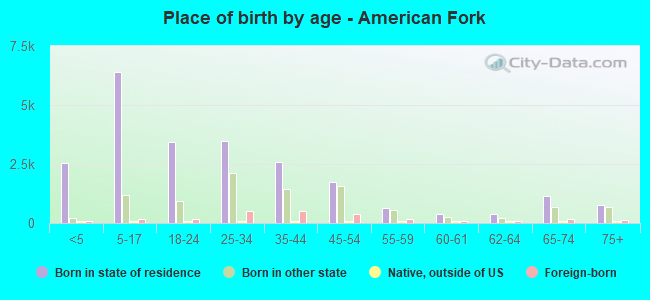
Place of birth - Born in state of residence (%)
Place of birth - Born in state of residence (%) - White
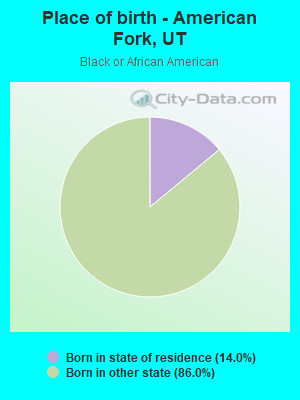
Place of birth - Born in state of residence (%) - Black or African American
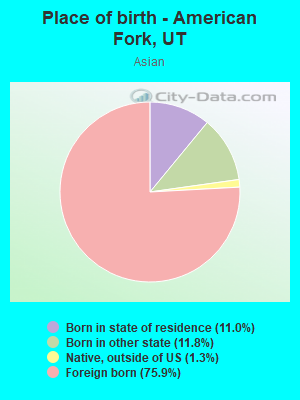
Place of birth - Born in state of residence (%) - Asian
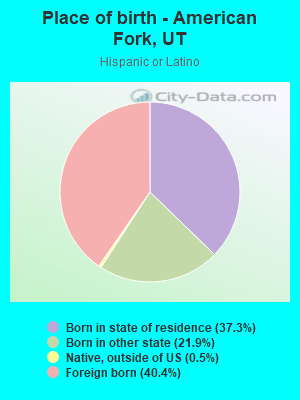
Place of birth - Born in state of residence (%) - Hispanic or Latino
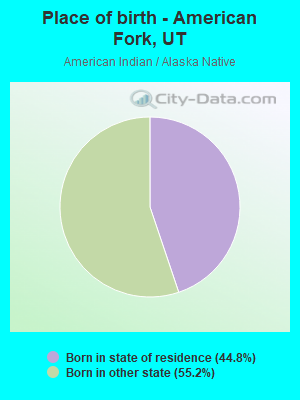
Place of birth - Born in state of residence (%) - American Indian and Alaska Native
Place of birth - Born in state of residence (%) - Multirace
Place of birth - Born in state of residence (%) - Other Race
Place of birth - Born in other state (%)
Place of birth - Born in other state (%) - White
Place of birth - Born in other state (%) - Black or African American
Place of birth - Born in other state (%) - Asian
Place of birth - Born in other state (%) - Hispanic or Latino
Place of birth - Born in other state (%) - American Indian and Alaska Native
Place of birth - Born in other state (%) - Multirace
Place of birth - Born in other state (%) - Other Race
Place of birth - Native, outside of US (%)
Place of birth - Native, outside of US (%) - White
Place of birth - Native, outside of US (%) - Black or African American
Place of birth - Native, outside of US (%) - Asian
Place of birth - Native, outside of US (%) - Hispanic or Latino
Place of birth - Native, outside of US (%) - American Indian and Alaska Native
Place of birth - Native, outside of US (%) - Multirace
Place of birth - Native, outside of US (%) - Other Race
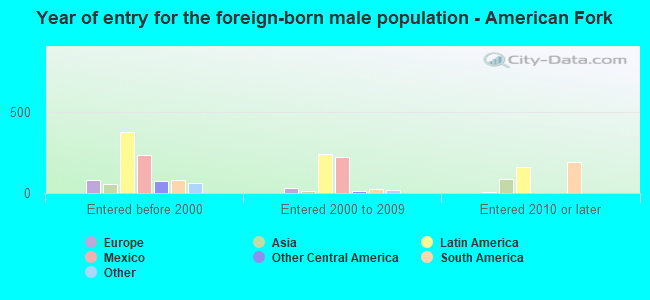
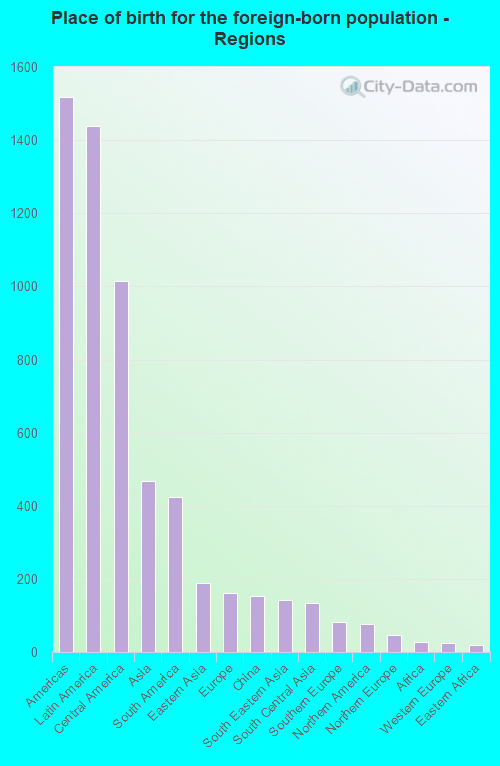
Place of birth - Foreign born (%)
Place of birth - Foreign born (%) - White
Place of birth - Foreign born (%) - Black or African American
Place of birth - Foreign born (%) - Asian
Place of birth - Foreign born (%) - Hispanic or Latino
Place of birth - Foreign born (%) - American Indian and Alaska Native
Place of birth - Foreign born (%) - Multirace
Place of birth - Foreign born (%) - Other Race
Residents speaking English at home (%)
Residents speaking English at home - Born in the United States (%)
Residents speaking English at home - Native, born elsewhere (%)
Residents speaking English at home - Foreign born (%)
Residents speaking Spanish at home (%)
Residents speaking Spanish at home - Born in the United States (%)
Residents speaking Spanish at home - Native, born elsewhere (%)
Residents speaking Spanish at home - Foreign born (%)
Residents speaking other language at home (%)
Residents speaking other language at home - Born in the United States (%)
Residents speaking other language at home - Native, born elsewhere (%)
Residents speaking other language at home - Foreign born (%)
Marital status - Never married (%)
Marital status - Now married (%)
Marital status - Separated (%)
Marital status - Widowed (%)
Marital status - Divorced (%)
Ancestries Reported - Arab (%)
Ancestries Reported - Czech (%)
Ancestries Reported - Danish (%)
Ancestries Reported - Dutch (%)
Ancestries Reported - English (%)
Ancestries Reported - French (%)
Ancestries Reported - French Canadian (%)
Ancestries Reported - German (%)
Ancestries Reported - Greek (%)
Ancestries Reported - Hungarian (%)
Ancestries Reported - Irish (%)
Ancestries Reported - Italian (%)
Ancestries Reported - Lithuanian (%)
Ancestries Reported - Norwegian (%)
Ancestries Reported - Polish (%)
Ancestries Reported - Portuguese (%)
Ancestries Reported - Russian (%)
Ancestries Reported - Scotch-Irish (%)
Ancestries Reported - Scottish (%)
Ancestries Reported - Slovak (%)
Ancestries Reported - Subsaharan African (%)
Ancestries Reported - Swedish (%)
Ancestries Reported - Swiss (%)
Ancestries Reported - Ukrainian (%)
Ancestries Reported - United States (%)
Ancestries Reported - Welsh (%)
Ancestries Reported - West Indian (%)
Ancestries Reported - Other (%)
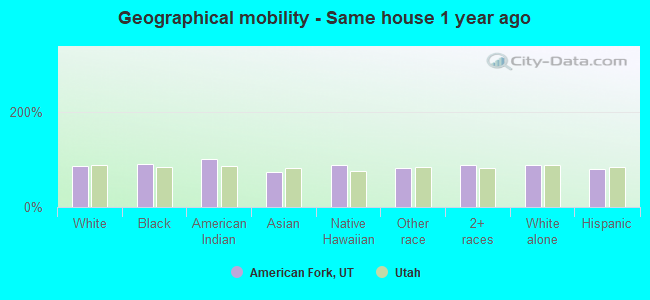
Geographical mobility - Same house 1 year ago (%)
Geographical mobility - Same house 1 year ago (%) - White
Geographical mobility - Same house 1 year ago (%) - Black or African American
Geographical mobility - Same house 1 year ago (%) - Asian
Geographical mobility - Same house 1 year ago (%) - Hispanic or Latino
Geographical mobility - Same house 1 year ago (%) - American Indian and Alaska Native
Geographical mobility - Same house 1 year ago (%) - Multirace
Geographical mobility - Same house 1 year ago (%) - Other Race
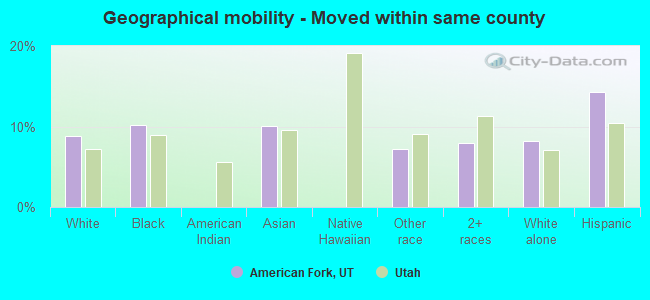
Geographical mobility - Moved within same county (%)
Geographical mobility - Moved within same county (%) - White
Geographical mobility - Moved within same county (%) - Black or African American
Geographical mobility - Moved within same county (%) - Asian
Geographical mobility - Moved within same county (%) - Hispanic or Latino
Geographical mobility - Moved within same county (%) - American Indian and Alaska Native
Geographical mobility - Moved within same county (%) - Multirace
Geographical mobility - Moved within same county (%) - Other Race
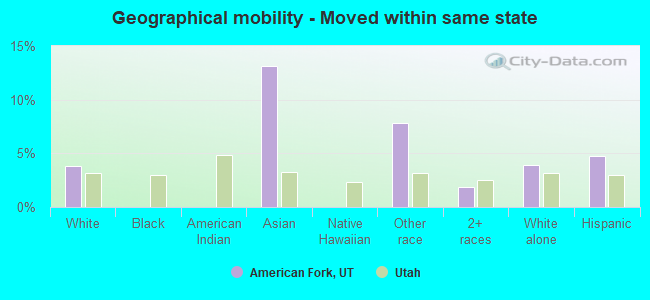
Geographical mobility - Moved from different county within same state (%)
Geographical mobility - Moved from different county within same state (%) - White
Geographical mobility - Moved from different county within same state (%) - Black or African American
Geographical mobility - Moved from different county within same state (%) - Asian
Geographical mobility - Moved from different county within same state (%) - Hispanic or Latino
Geographical mobility - Moved from different county within same state (%) - American Indian and Alaska Native
Geographical mobility - Moved from different county within same state (%) - Multirace
Geographical mobility - Moved from different county within same state (%) - Other Race
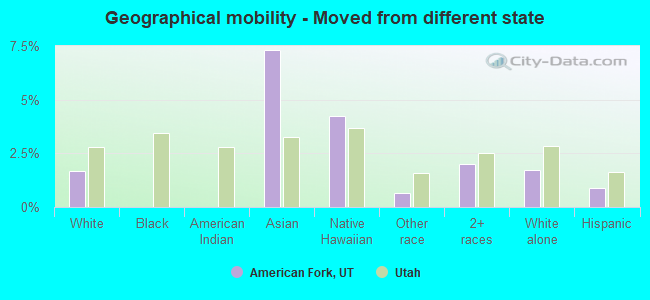
Geographical mobility - Moved from different state (%)
Geographical mobility - Moved from different state (%) - White
Geographical mobility - Moved from different state (%) - Black or African American
Geographical mobility - Moved from different state (%) - Asian
Geographical mobility - Moved from different state (%) - Hispanic or Latino
Geographical mobility - Moved from different state (%) - American Indian and Alaska Native
Geographical mobility - Moved from different state (%) - Multirace
Geographical mobility - Moved from different state (%) - Other Race
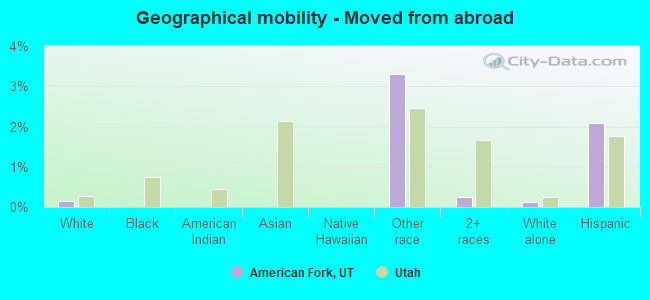
Geographical mobility - Moved from abroad (%)
Geographical mobility - Moved from abroad (%) - White
Geographical mobility - Moved from abroad (%) - Black or African American
Geographical mobility - Moved from abroad (%) - Asian
Geographical mobility - Moved from abroad (%) - Hispanic or Latino
Geographical mobility - Moved from abroad (%) - American Indian and Alaska Native
Geographical mobility - Moved from abroad (%) - Multirace
Geographical mobility - Moved from abroad (%) - Other Race
Place of birth for the foreign-born population - Ireland (%)
Place of birth for the foreign-born population - Denmark (%)
Place of birth for the foreign-born population - Norway (%)
Place of birth for the foreign-born population - Sweden (%)
Place of birth for the foreign-born population - United Kingdom (%)
Place of birth for the foreign-born population - England (%)
Place of birth for the foreign-born population - Scotland (%)
Place of birth for the foreign-born population - Other Northern Europe (%)
Place of birth for the foreign-born population - Austria (%)
Place of birth for the foreign-born population - Belgium (%)
Place of birth for the foreign-born population - France (%)
Place of birth for the foreign-born population - Germany (%)
Place of birth for the foreign-born population - Netherlands (%)
Place of birth for the foreign-born population - Switzerland (%)
Place of birth for the foreign-born population - Other Western Europe (%)
Place of birth for the foreign-born population - Greece (%)
Place of birth for the foreign-born population - Italy (%)
Place of birth for the foreign-born population - Portugal (%)
Place of birth for the foreign-born population - Spain (%)
Place of birth for the foreign-born population - Other Southern Europe (%)
Place of birth for the foreign-born population - Albania (%)
Place of birth for the foreign-born population - Belarus (%)
Place of birth for the foreign-born population - Bosnia and Herzegovina (%)
Place of birth for the foreign-born population - Bulgaria (%)
Place of birth for the foreign-born population - Croatia (%)
Place of birth for the foreign-born population - Czechoslovakia (%)
Place of birth for the foreign-born population - Hungary (%)
Place of birth for the foreign-born population - Latvia (%)
Place of birth for the foreign-born population - Lithuania (%)
Place of birth for the foreign-born population - North Macedonia (Macedonia) (%)
Place of birth for the foreign-born population - Moldova (%)
Place of birth for the foreign-born population - Poland (%)
Place of birth for the foreign-born population - Romania (%)
Place of birth for the foreign-born population - Russia (%)
Place of birth for the foreign-born population - Serbia (%)
Place of birth for the foreign-born population - Ukraine (%)
Place of birth for the foreign-born population - Other Eastern Europe (%)
Place of birth for the foreign-born population - China (%)
Place of birth for the foreign-born population - Hong Kong (%)
Place of birth for the foreign-born population - Taiwan (%)
Place of birth for the foreign-born population - Japan (%)
Place of birth for the foreign-born population - Korea (%)
Place of birth for the foreign-born population - Other Eastern Asia (%)
Place of birth for the foreign-born population - Afghanistan (%)
Place of birth for the foreign-born population - Bangladesh (%)
Place of birth for the foreign-born population - India (%)
Place of birth for the foreign-born population - Iran (%)
Place of birth for the foreign-born population - Kazakhstan (%)
Place of birth for the foreign-born population - Nepal (%)
Place of birth for the foreign-born population - Pakistan (%)
Place of birth for the foreign-born population - Sri Lanka (%)
Place of birth for the foreign-born population - Uzbekistan (%)
Place of birth for the foreign-born population - Other South Central Asia (%)
Place of birth for the foreign-born population - Burma (%)
Place of birth for the foreign-born population - Cambodia (%)
Place of birth for the foreign-born population - Indonesia (%)
Place of birth for the foreign-born population - Laos (%)
Place of birth for the foreign-born population - Malaysia (%)
Place of birth for the foreign-born population - Philippines (%)
Place of birth for the foreign-born population - Singapore (%)
Place of birth for the foreign-born population - Thailand (%)
Place of birth for the foreign-born population - Vietnam (%)
Place of birth for the foreign-born population - Other South Eastern Asia (%)
Place of birth for the foreign-born population - Armenia (%)
Place of birth for the foreign-born population - Iraq (%)
Place of birth for the foreign-born population - Israel (%)
Place of birth for the foreign-born population - Jordan (%)
Place of birth for the foreign-born population - Kuwait (%)
Place of birth for the foreign-born population - Lebanon (%)
Place of birth for the foreign-born population - Saudi Arabia (%)
Place of birth for the foreign-born population - Syria (%)
Place of birth for the foreign-born population - Turkey (%)
Place of birth for the foreign-born population - Yemen (%)
Place of birth for the foreign-born population - Other Western Asia (%)
Place of birth for the foreign-born population - Eritrea (%)
Place of birth for the foreign-born population - Ethiopia (%)
Place of birth for the foreign-born population - Kenya (%)
Place of birth for the foreign-born population - Somalia (%)
Place of birth for the foreign-born population - Uganda (%)
Place of birth for the foreign-born population - Zimbabwe (%)
Place of birth for the foreign-born population - Other Eastern Africa (%)
Place of birth for the foreign-born population - Cameroon (%)
Place of birth for the foreign-born population - Congo (%)
Place of birth for the foreign-born population - Democratic Republic of Congo (Zaire) (%)
Place of birth for the foreign-born population - Other Middle Africa (%)
Place of birth for the foreign-born population - Egypt (%)
Place of birth for the foreign-born population - Morocco (%)
Place of birth for the foreign-born population - Sudan (%)
Place of birth for the foreign-born population - Other Northern Africa (%)
Place of birth for the foreign-born population - South Africa (%)
Place of birth for the foreign-born population - Other Southern Africa (%)
Place of birth for the foreign-born population - Cabo Verde (%)
Place of birth for the foreign-born population - Ghana (%)
Place of birth for the foreign-born population - Liberia (%)
Place of birth for the foreign-born population - Nigeria (%)
Place of birth for the foreign-born population - Senegal (%)
Place of birth for the foreign-born population - Sierra Leone (%)
Place of birth for the foreign-born population - Other Western Africa (%)
Place of birth for the foreign-born population - Australia (%)
Place of birth for the foreign-born population - New Zealand (%)
Place of birth for the foreign-born population - Fiji (%)
Place of birth for the foreign-born population - Micronesia (%)
Place of birth for the foreign-born population - Bahamas (%)
Place of birth for the foreign-born population - Barbados (%)
Place of birth for the foreign-born population - Cuba (%)
Place of birth for the foreign-born population - Dominica (%)
Place of birth for the foreign-born population - Dominican Republic (%)
Place of birth for the foreign-born population - Grenada (%)
Place of birth for the foreign-born population - Haiti (%)
Place of birth for the foreign-born population - Jamaica (%)
Place of birth for the foreign-born population - St. Vincent and the Grenadines (%)
Place of birth for the foreign-born population - Trinidad and Tobago (%)
Place of birth for the foreign-born population - West Indies (%)
Place of birth for the foreign-born population - Other Caribbean (%)
Place of birth for the foreign-born population - Belize (%)
Place of birth for the foreign-born population - Costa Rica (%)
Place of birth for the foreign-born population - El Salvador (%)
Place of birth for the foreign-born population - Guatemala (%)
Place of birth for the foreign-born population - Honduras (%)
Place of birth for the foreign-born population - Mexico (%)
Place of birth for the foreign-born population - Nicaragua (%)
Place of birth for the foreign-born population - Panama (%)
Place of birth for the foreign-born population - Other Central America (%)
Place of birth for the foreign-born population - Argentina (%)
Place of birth for the foreign-born population - Bolivia (%)
Place of birth for the foreign-born population - Brazil (%)
Place of birth for the foreign-born population - Chile (%)
Place of birth for the foreign-born population - Colombia (%)
Place of birth for the foreign-born population - Ecuador (%)
Place of birth for the foreign-born population - Guyana (%)
Place of birth for the foreign-born population - Peru (%)
Place of birth for the foreign-born population - Uruguay (%)
Place of birth for the foreign-born population - Venezuela (%)
Place of birth for the foreign-born population - Other South America (%)
Place of birth for the foreign-born population - Canada (%)
Place of birth for the foreign-born population - Other Northern America (%)
Place of birth for the foreign-born population - Other (%)
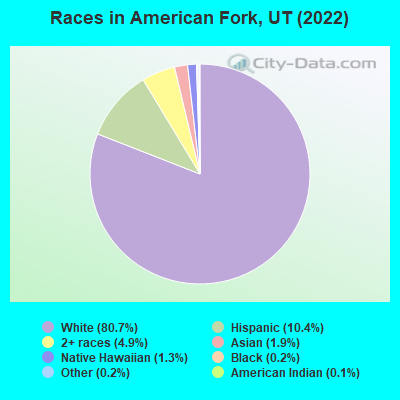
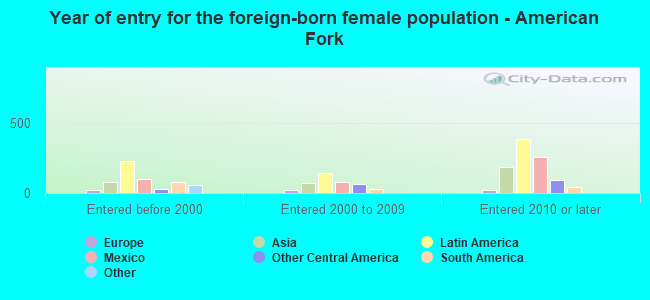
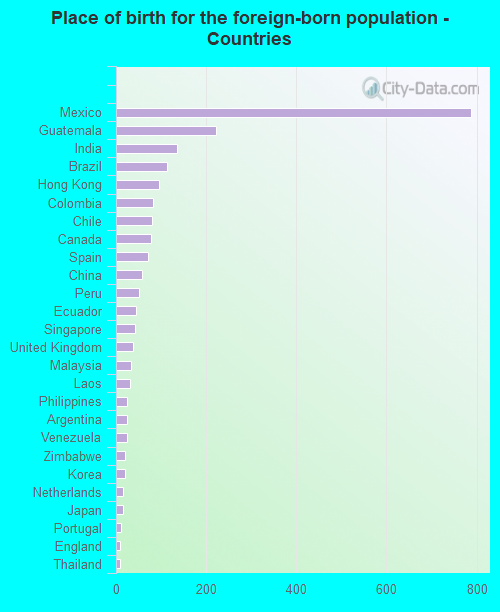
According to 2022 data, the most numerous races in American Fork, UT are White alone (28,923 residents), Hispanic (3,731 residents), and Two or more races (1,756 residents). 88.8% of American Fork residents speak English at home. 6.1% of American Fork, UT residents are foreign-born (4.0% born in Latin America, 1.3% born in Asia), which is 31.2% less than the foreign-born rate of 8.0% across the entire state of Utah.
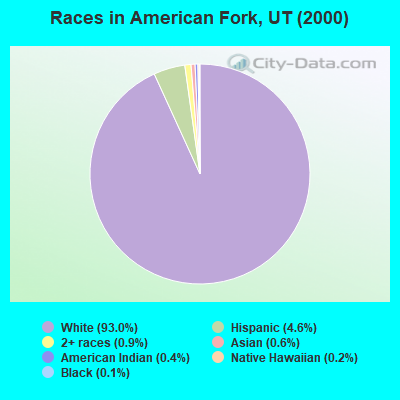
Race distribution in American Fork
2000 2022
1,904,265 85.3% White alone 201,559 9.0% Hispanic 36,483 1.6% Asian alone 31,308 1.4% Two or more races 26,663 1.2% American Indian alone 14,806 0.7% Native Hawaiian and Other 16,137 0.7% Black alone 1,948 0.09% Other race alone
2,557,466 75.6% White alone 512,086 15.1% Hispanic 119,308 3.5% Two or more races 82,388 2.4% Asian alone 36,978 1.1% Native Hawaiian and Other 34,873 1.0% Black alone 22,803 0.7% American Indian alone 14,898 0.4% Other race alone
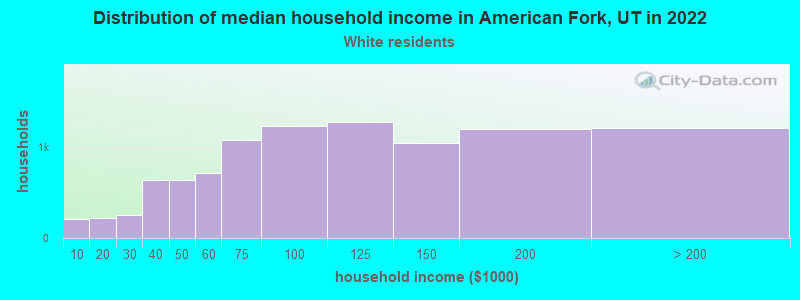
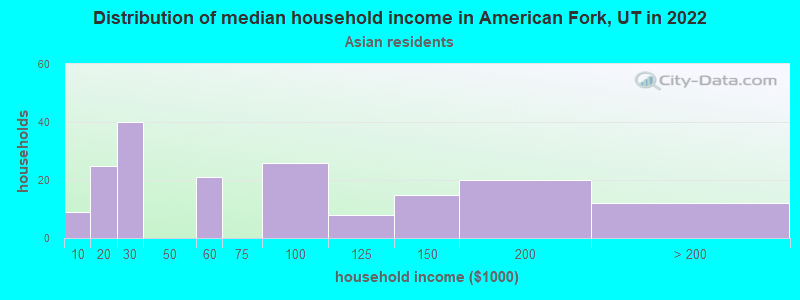
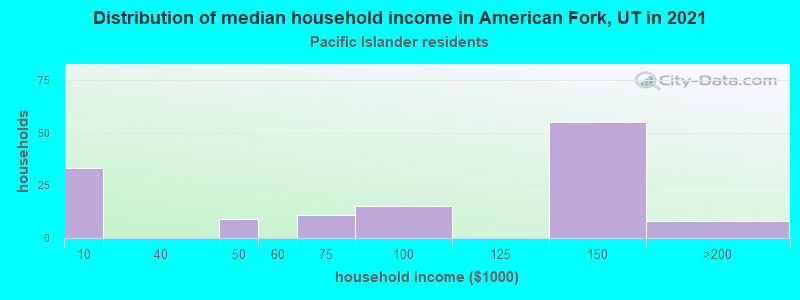
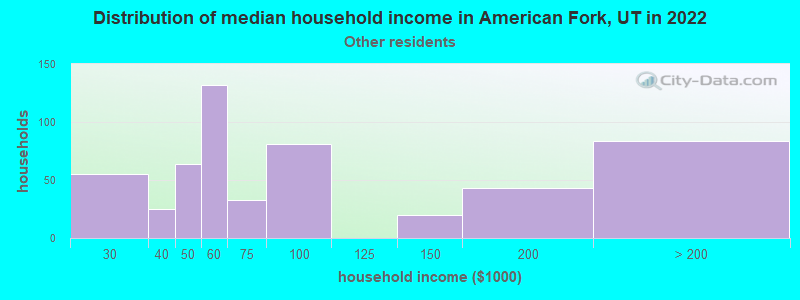
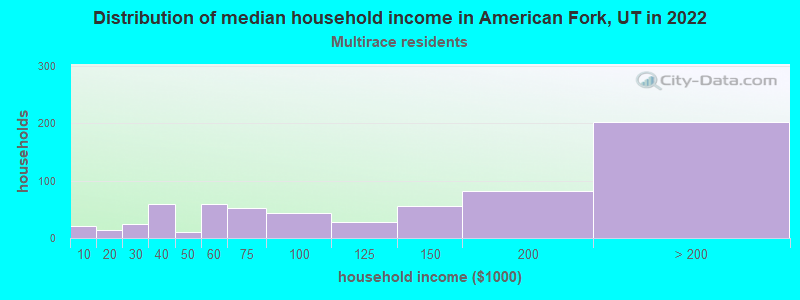
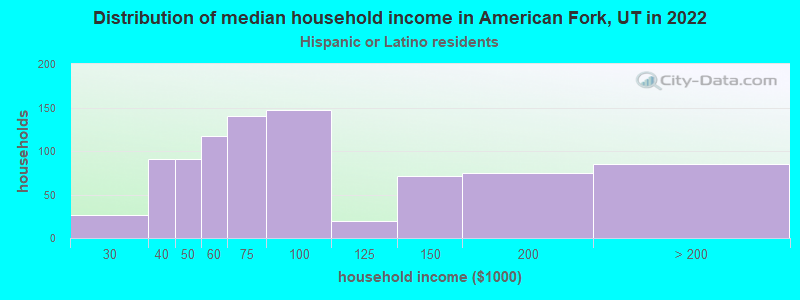
Income and house value in American Fork Median household income in 2022 $96,708 White non-Hispanic householders$107,983 Asian householders$60,532 Some other race householders$116,483 Two or more races householders$77,823 Hispanic or Latino race householdersMedian 2022 house value $503,435 White Non-Hispanic householders$457,517 Black or African American householders$509,424 American Indian or Alaska Native householders $623,887 Asian householders$586,620 Some other race householders$420,250 Two or more races householders$469,828 Hispanic or Latino householders
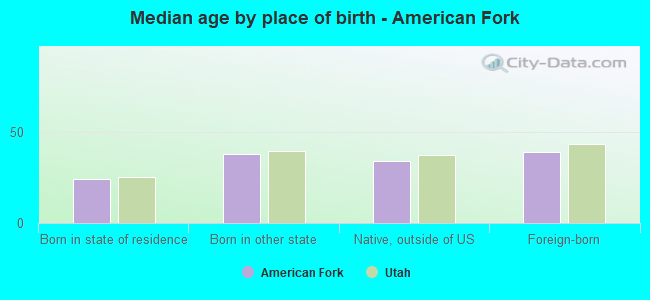
Median age by race in American Fork
29.0 Median age for White residents28.3 30.3 24.7 Median age for Black or African American residents22.8 -640,650,405.9 26.9 Median age for American Indian / Alaska Native residents25.8 -706,192,357.7 38.5 Median age for Asian residents39.7 39.5 18.7 Median age for Native Hawaiian / Pacific Islander residents15.3 25.7 31.7 Median age for Other race residents35.0 18.9 21.0 Median age for Two or more races residents24.5 17.3 29.9 Median age for White alone residents28.8 31.6 26.2 Median age for Hispanic or Latino residents32.3 21.4
Owner/renter occupied households by race in American Fork
House owners and renters - White residents 7,021 72.7% Owner occupied2,642 27.3% Renter occupiedHouse owners and renters - American Indian / Alaska Native residents 7 100.0% Owner occupiedHouse owners and renters - Asian residents 157 84.7% Owner occupied28 15.3% Renter occupiedHouse owners and renters - Native Hawaiian / Pacific Islander residents 132 79.5% Owner occupied34 20.5% Renter occupiedHouse owners and renters - Other race residents 397 68.7% Owner occupied181 31.3% Renter occupiedHouse owners and renters - Two or more races residents 326 50.3% Owner occupied321 49.7% Renter occupiedHouse owners and renters - White alone residents 7,011 72.7% Owner occupied2,636 27.3% Renter occupiedHouse owners and renters - Hispanic or Latino residents 547 63.6% Owner occupied313 36.4% Renter occupied
Language usage in American Fork
English speakers - Total 88.8% of residents of American Fork speak English at home.
7.8% of residents speak Spanish at home 1,342 52.4% Speak English very well1,221 47.6% Speak English less than very well3.5% of residents speak other language at home 917 79.4% Speak English very well238 20.6% Speak English less than very well
English speakers - Born in the United States 91.2% of residents of American Fork speak English at home.
5.6% of residents speak Spanish at home 487 89.9% Speak English very well55 10.1% Speak English less than very well3.2% of residents speak other language at home 297 97.1% Speak English very well9 2.9% Speak English less than very well
English speakers - Native, born elsewhere 94.8% of residents of American Fork speak English at home.
6.5% of residents speak Spanish at home 10 100.0% Speak English very well2.6% of residents speak other language at home 4 100.0% Speak English very well
English speakers - Foreign-born 19.7% of residents of American Fork speak English at home.
61.3% of residents speak Spanish at home 516 36.3% Speak English very well905 63.7% Speak English less than very well19.1% of residents speak other language at home 246 55.7% Speak English very well196 44.3% Speak English less than very well
White (Caucasian) - Speak only English Native:
97.9% (26,423)Foreign-born:
47.8% (139)
White (Caucasian) - Speak another language Native:
2.8% (762)Foreign-born:
57.2% (167)
Asian - Speak only English Native:
60.9% (95)Foreign-born:
32.1% (157)
Asian - Speak another language Native:
36.1% (56)Foreign-born:
69.0% (338)
Native Hawaiian / Pacific Islander - Speak another language Native:
29.0% (96)Foreign-born:
90.6% (13)
Other race - Speak only English Native:
23.4% (273)Foreign-born:
5.8% (75)
Other race - Speak another language Native:
78.9% (922)Foreign-born:
93.1% (1,201)
Two or more races - Speak only English Native:
88.3% (1,775)Foreign-born:
16.9% (84)
Two or more races - Speak another language Native:
5.8% (117)Foreign-born:
82.7% (409)
White alone - Speak only English Native:
97.0% (26,074)Foreign-born:
66.8% (148)
White alone - Speak another language Native:
3.1% (820)Foreign-born:
34.7% (77)
Hispanic or Latino - Speak only English Native:
54.8% (919)Foreign-born:
5.0% (73)
Hispanic or Latino - Speak another language Native:
45.3% (760)Foreign-born:
94.0% (1,379)
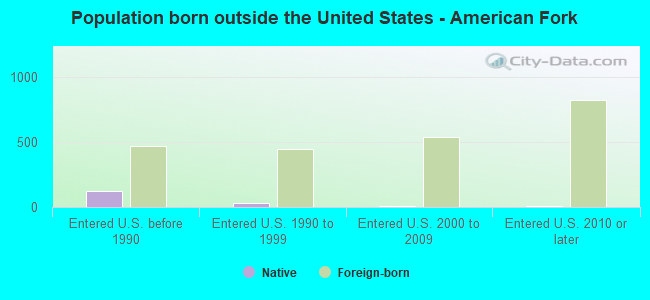
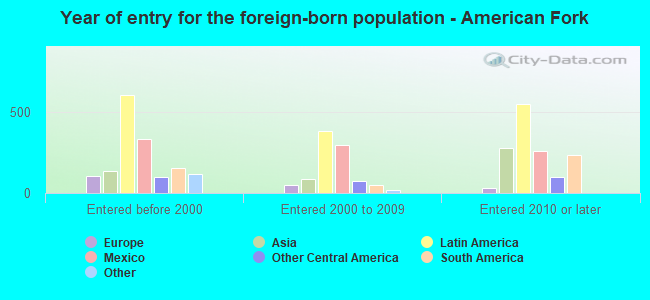
Foreign-born residents in American Fork 2,185 residents are foreign born (4.0% Latin America , 1.3% Asia ).
Marital status for residents in American Fork Marital status - White (Caucasian) population 15 years and over
Males 31.2% Never married61.8% Now married0.3% Separated0.9% Widowed5.8% DivorcedFemales 26.8% Never married60.1% Now married1.1% Separated5.5% Widowed6.4% DivorcedWomen who gave birth in the past 12 months Now married:
99.5% (610)Unmarried:
0.5% (3)
Women who did not give birth in the past 12 months Now married:
55.4% (4,036)Unmarried:
44.6% (3,245)
Marital status - Black or African American population 15 years and over
Males 83.6% Never married16.4% Now married0.0% Separated0.0% Widowed0.0% DivorcedFemales 100.0% Never married0.0% Now married0.0% Separated0.0% Widowed0.0% DivorcedWomen who did not give birth in the past 12 months Now married:
0.0% (0)Unmarried:
100.0% (14)
Marital status - American Indian / Alaska Native population 15 years and over
Males 0.0% Never married61.1% Now married0.0% Separated0.0% Widowed38.9% DivorcedFemales 0.0% Never married100.0% Now married0.0% Separated0.0% Widowed0.0% DivorcedWomen who did not give birth in the past 12 months Now married:
100.0% (70)Unmarried:
0.0% (0)
Marital status - Asian population 15 years and over
Males 17.2% Never married82.8% Now married0.0% Separated0.0% Widowed0.0% DivorcedFemales 25.5% Never married70.3% Now married0.0% Separated4.2% Widowed0.0% DivorcedWomen who did not give birth in the past 12 months Now married:
58.0% (128)Unmarried:
42.0% (93)
Marital status - Native Hawaiian / Pacific Islander population 15 years and over
Males 11.3% Never married88.7% Now married0.0% Separated0.0% Widowed0.0% DivorcedFemales 39.7% Never married38.2% Now married22.1% Separated0.0% Widowed0.0% DivorcedWomen who did not give birth in the past 12 months Now married:
66.1% (67)Unmarried:
33.9% (35)
Marital status - Other race population 15 years and over
Males 27.3% Never married70.9% Now married0.0% Separated0.0% Widowed1.8% DivorcedFemales 35.9% Never married59.0% Now married2.6% Separated1.1% Widowed1.5% DivorcedWomen who gave birth in the past 12 months Now married:
100.0% (29)Unmarried:
0.0% (0)
Women who did not give birth in the past 12 months Now married:
54.2% (338)Unmarried:
45.8% (285)
Marital status - Two or more races population 15 years and over
Males 44.5% Never married45.3% Now married4.5% Separated0.0% Widowed5.7% DivorcedFemales 37.1% Never married47.1% Now married0.9% Separated3.4% Widowed11.4% DivorcedWomen who gave birth in the past 12 months Now married:
77.2% (57)Unmarried:
22.8% (17)
Women who did not give birth in the past 12 months Now married:
41.1% (229)Unmarried:
58.9% (329)
Marital status - White alone, not Hispanic / Latino population 15 years and over
Males 30.8% Never married62.0% Now married0.3% Separated0.9% Widowed6.0% DivorcedFemales 27.1% Never married59.6% Now married1.2% Separated5.5% Widowed6.6% DivorcedWomen who gave birth in the past 12 months Now married:
99.5% (611)Unmarried:
0.5% (3)
Women who did not give birth in the past 12 months Now married:
54.6% (3,944)Unmarried:
45.4% (3,285)
Marital status - Hispanic or Latino population 15 years and over
Males 32.4% Never married64.3% Now married0.0% Separated0.0% Widowed3.3% DivorcedFemales 24.7% Never married68.2% Now married1.4% Separated3.8% Widowed2.0% DivorcedWomen who gave birth in the past 12 months Now married:
100.0% (39)Unmarried:
0.0% (0)
Women who did not give birth in the past 12 months Now married:
68.0% (603)Unmarried:
32.0% (284)
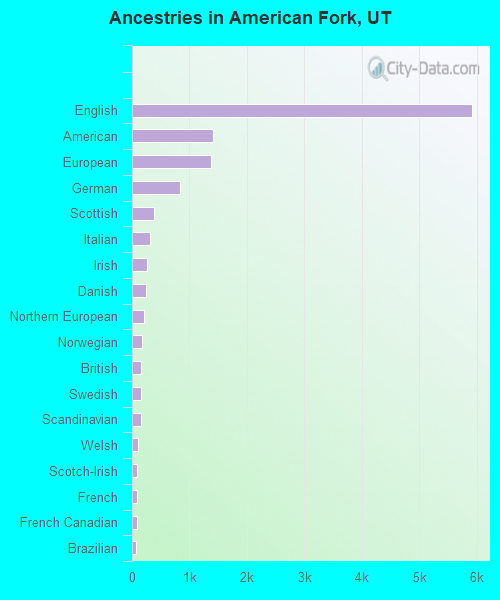
Ancestries in American Fork
5,920 37.5% English1,414 9.0% American1,371 8.7% European841 5.3% German390 2.5% Scottish319 2.0% Italian260 1.6% Irish244 1.5% Danish214 1.4% Northern European172 1.1% Norwegian154 1.0% British154 1.0% Swedish153 1.0% Scandinavian100 0.6% Welsh94 0.6% Scotch-Irish85 0.5% French81 0.5% French Canadian66 0.4% Brazilian52 0.3% Canadian44 0.3% Polish38 0.2% Dutch19 0.1% Swiss15 0.09% Basque12 0.08% Belgian11 0.07% Portuguese8 0.05% Croatian7 0.04% Icelander7 0.04% Russian5 0.03% Hungarian
Geographical mobility in American Fork Same house 1 year ago 24,679 86.1% White (Caucasian)62 91.4% Black or African American125 100.0% American Indian / Alaska Native494 73.0% Asian353 89.2% Native Hawaiian / Pacific Islander2,161 81.4% Other race2,604 87.7% Two or more races24,710 86.7% White alone, not Hispanic / Latino2,901 78.9% Hispanic or LatinoMoved within same county 2,518 8.8% White / Caucasian7 10.2% Black or African American68 10.0% Asian191 7.2% Other race236 8.0% Two or more races2,338 8.2% White alone, not Hispanic / Latino525 14.3% Hispanic or LatinoMoved within same state 1,108 3.9% White / Caucasian89 13.2% Asian207 7.8% Other race56 1.9% Two or more races1,127 4.0% White alone, not Hispanic / Latino176 4.8% Hispanic or LatinoMoved from different state 485 1.7% White / Caucasian50 7.3% Asian17 4.2% Native Hawaiian / Pacific Islander18 0.7% Other race59 2.0% Two or more races488 1.7% White alone, not Hispanic / Latino33 0.9% Hispanic or LatinoMoved from abroad 41 0.1% White88 3.3% Other race8 0.3% Two or more races37 0.1% White alone, not Hispanic / Latino77 2.1% Hispanic or Latino
Children Nativity (place of birth) in American Fork
Children under 6 years - Living with two parents Both parents native 2,286 99.2% Native18 0.8% Foreign-bornBoth parents foreign-born 138 86.8% Native21 13.2% Foreign-bornOne native, one foreign-born parent 443 100.0% NativeChildren under 6 years - Living with one parent Native parent 377 100.0% NativeForeign-born parent 7 100.0% NativeChildren 6 to 17 years - Living with two parents Both parents native 5,322 99.2% Native43 0.8% Foreign-bornBoth parents foreign-born 424 87.7% Native59 12.3% Foreign-bornOne native, one foreign-born parent 340 100.0% NativeChildren 6 to 17 years - Living with one parent Native parent 708 100.0% NativeForeign-born parent 86 58.3% Native62 41.7% Foreign-born
Grandparents responsible for own grandchildren in American Fork
Grandparents (30 to 59 years) White / Caucasian 60 26.1% Responsible for grandchildren170 73.9% Not responsible for grandchildrenNative Hawaiian / Pacific Islander 7 100.0% Not responsible for grandchildrenOther race 5 100.0% Not responsible for grandchildrenTwo or more races 55 85.5% Responsible for grandchildren9 14.5% Not responsible for grandchildrenWhite alone, not Hispanic / Latino 50 20.4% Responsible for grandchildren196 79.6% Not responsible for grandchildrenHispanic or Latino 11 67.3% Responsible for grandchildren6 32.7% Not responsible for grandchildrenGrandparents (60 years and over) White / Caucasian 72 35.4% Responsible for grandchildren133 64.6% Not responsible for grandchildrenOther race 50 100.0% Not responsible for grandchildrenTwo or more races 20 38.3% Responsible for grandchildren32 61.7% Not responsible for grandchildrenWhite alone, not Hispanic / Latino 74 36.4% Responsible for grandchildren130 63.6% Not responsible for grandchildrenHispanic or Latino 72 100.0% Not responsible for grandchildren