Races in Amityville, New York (NY) Detailed Stats
Data:
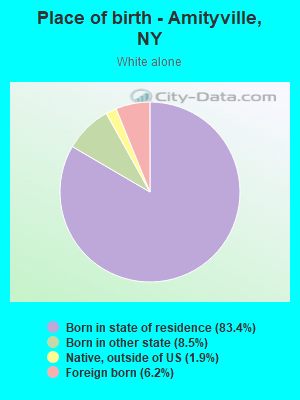
Races - White alone (%)
Races - White alone (% change since 2000)
Races - Black alone (%)
Races - Black alone (% change since 2000)
Races - American Indian alone (%)
Races - American Indian alone (% change since 2000)
Races - Asian alone (%)
Races - Asian alone (% change since 2000)
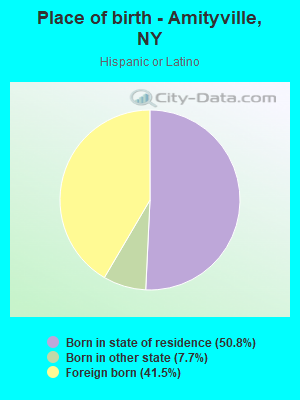
Races - Hispanic (%)
Races - Hispanic (% change since 2000)
Races - Native Hawaiian and Other Pacific Islander alone (%)
Races - Native Hawaiian and Other Pacific Islander alone (% change since 2000)
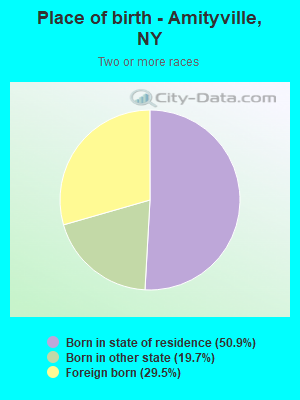
Races - Two or more races(%)
Races - Two or more races(% change since 2000)
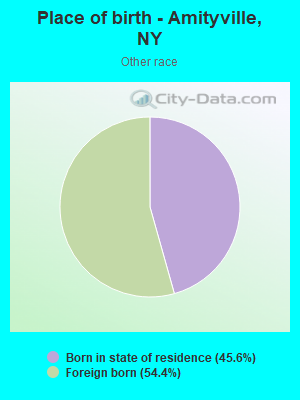
Races - Other race alone (%)
Races - Other race alone (% change since 2000)
Racial diversity
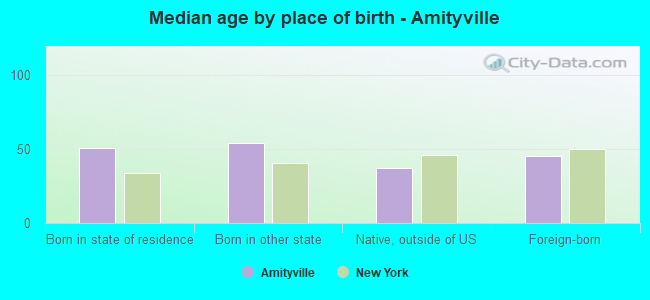
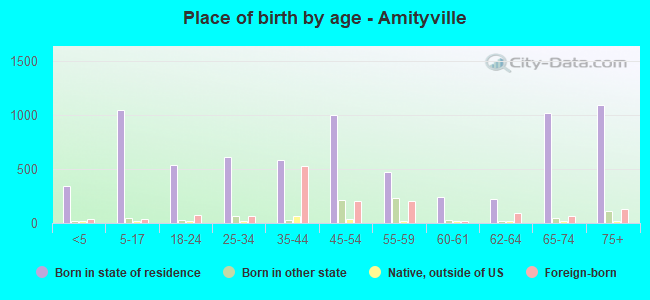
Place of birth - Born in state of residence (%)
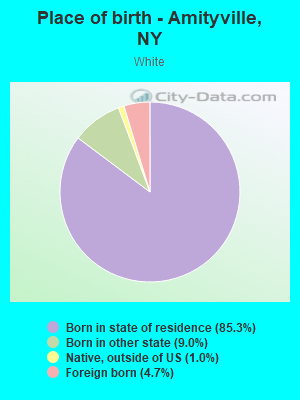
Place of birth - Born in state of residence (%) - White
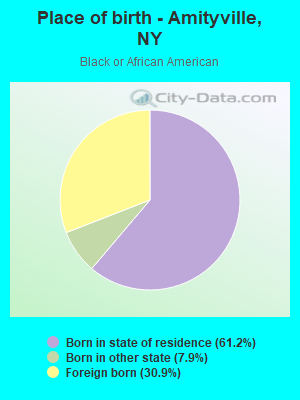
Place of birth - Born in state of residence (%) - Black or African American
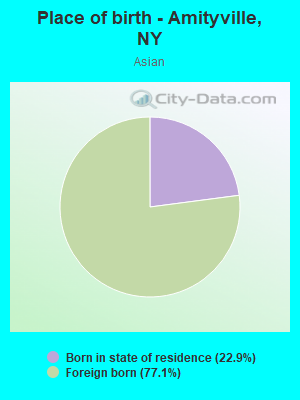
Place of birth - Born in state of residence (%) - Asian
Place of birth - Born in state of residence (%) - Hispanic or Latino
Place of birth - Born in state of residence (%) - American Indian and Alaska Native
Place of birth - Born in state of residence (%) - Multirace
Place of birth - Born in state of residence (%) - Other Race
Place of birth - Born in other state (%)
Place of birth - Born in other state (%) - White
Place of birth - Born in other state (%) - Black or African American
Place of birth - Born in other state (%) - Asian
Place of birth - Born in other state (%) - Hispanic or Latino
Place of birth - Born in other state (%) - American Indian and Alaska Native
Place of birth - Born in other state (%) - Multirace
Place of birth - Born in other state (%) - Other Race
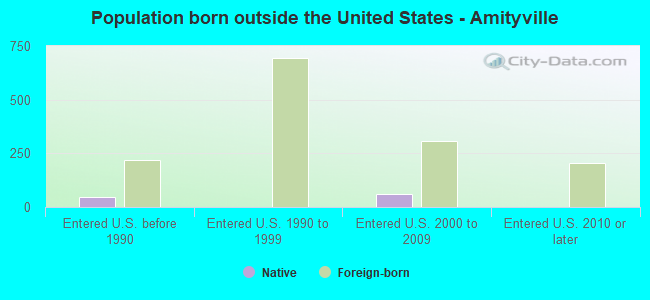
Place of birth - Native, outside of US (%)
Place of birth - Native, outside of US (%) - White
Place of birth - Native, outside of US (%) - Black or African American
Place of birth - Native, outside of US (%) - Asian
Place of birth - Native, outside of US (%) - Hispanic or Latino
Place of birth - Native, outside of US (%) - American Indian and Alaska Native
Place of birth - Native, outside of US (%) - Multirace
Place of birth - Native, outside of US (%) - Other Race
Place of birth - Foreign born (%)
Place of birth - Foreign born (%) - White
Place of birth - Foreign born (%) - Black or African American
Place of birth - Foreign born (%) - Asian
Place of birth - Foreign born (%) - Hispanic or Latino
Place of birth - Foreign born (%) - American Indian and Alaska Native
Place of birth - Foreign born (%) - Multirace
Place of birth - Foreign born (%) - Other Race
Residents speaking English at home (%)
Residents speaking English at home - Born in the United States (%)
Residents speaking English at home - Native, born elsewhere (%)
Residents speaking English at home - Foreign born (%)
Residents speaking Spanish at home (%)
Residents speaking Spanish at home - Born in the United States (%)
Residents speaking Spanish at home - Native, born elsewhere (%)
Residents speaking Spanish at home - Foreign born (%)
Residents speaking other language at home (%)
Residents speaking other language at home - Born in the United States (%)
Residents speaking other language at home - Native, born elsewhere (%)
Residents speaking other language at home - Foreign born (%)
Marital status - Never married (%)
Marital status - Now married (%)
Marital status - Separated (%)
Marital status - Widowed (%)
Marital status - Divorced (%)
Ancestries Reported - Arab (%)
Ancestries Reported - Czech (%)
Ancestries Reported - Danish (%)
Ancestries Reported - Dutch (%)
Ancestries Reported - English (%)
Ancestries Reported - French (%)
Ancestries Reported - French Canadian (%)
Ancestries Reported - German (%)
Ancestries Reported - Greek (%)
Ancestries Reported - Hungarian (%)
Ancestries Reported - Irish (%)
Ancestries Reported - Italian (%)
Ancestries Reported - Lithuanian (%)
Ancestries Reported - Norwegian (%)
Ancestries Reported - Polish (%)
Ancestries Reported - Portuguese (%)
Ancestries Reported - Russian (%)
Ancestries Reported - Scotch-Irish (%)
Ancestries Reported - Scottish (%)
Ancestries Reported - Slovak (%)
Ancestries Reported - Subsaharan African (%)
Ancestries Reported - Swedish (%)
Ancestries Reported - Swiss (%)
Ancestries Reported - Ukrainian (%)
Ancestries Reported - United States (%)
Ancestries Reported - Welsh (%)
Ancestries Reported - West Indian (%)
Ancestries Reported - Other (%)
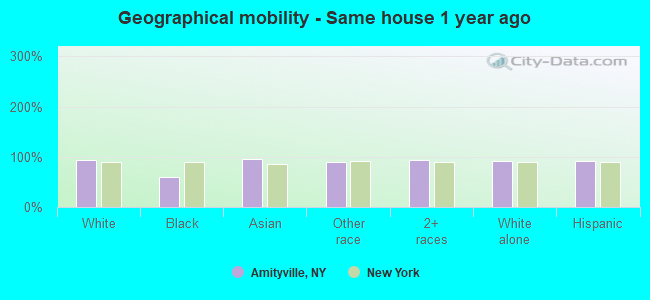
Geographical mobility - Same house 1 year ago (%)
Geographical mobility - Same house 1 year ago (%) - White
Geographical mobility - Same house 1 year ago (%) - Black or African American
Geographical mobility - Same house 1 year ago (%) - Asian
Geographical mobility - Same house 1 year ago (%) - Hispanic or Latino
Geographical mobility - Same house 1 year ago (%) - American Indian and Alaska Native
Geographical mobility - Same house 1 year ago (%) - Multirace
Geographical mobility - Same house 1 year ago (%) - Other Race
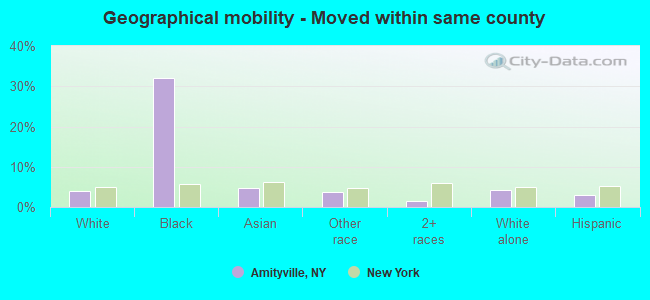
Geographical mobility - Moved within same county (%)
Geographical mobility - Moved within same county (%) - White
Geographical mobility - Moved within same county (%) - Black or African American
Geographical mobility - Moved within same county (%) - Asian
Geographical mobility - Moved within same county (%) - Hispanic or Latino
Geographical mobility - Moved within same county (%) - American Indian and Alaska Native
Geographical mobility - Moved within same county (%) - Multirace
Geographical mobility - Moved within same county (%) - Other Race
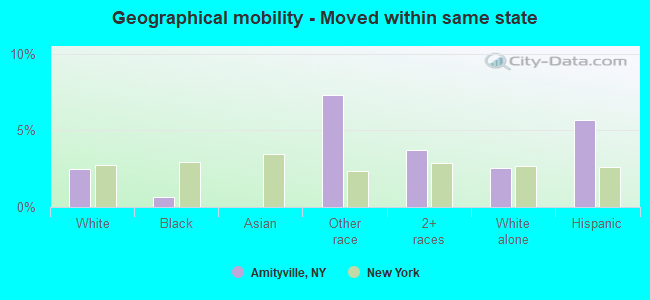
Geographical mobility - Moved from different county within same state (%)
Geographical mobility - Moved from different county within same state (%) - White
Geographical mobility - Moved from different county within same state (%) - Black or African American
Geographical mobility - Moved from different county within same state (%) - Asian
Geographical mobility - Moved from different county within same state (%) - Hispanic or Latino
Geographical mobility - Moved from different county within same state (%) - American Indian and Alaska Native
Geographical mobility - Moved from different county within same state (%) - Multirace
Geographical mobility - Moved from different county within same state (%) - Other Race
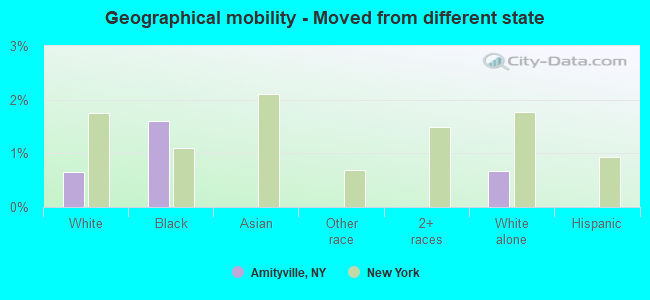
Geographical mobility - Moved from different state (%)
Geographical mobility - Moved from different state (%) - White
Geographical mobility - Moved from different state (%) - Black or African American
Geographical mobility - Moved from different state (%) - Asian
Geographical mobility - Moved from different state (%) - Hispanic or Latino
Geographical mobility - Moved from different state (%) - American Indian and Alaska Native
Geographical mobility - Moved from different state (%) - Multirace
Geographical mobility - Moved from different state (%) - Other Race
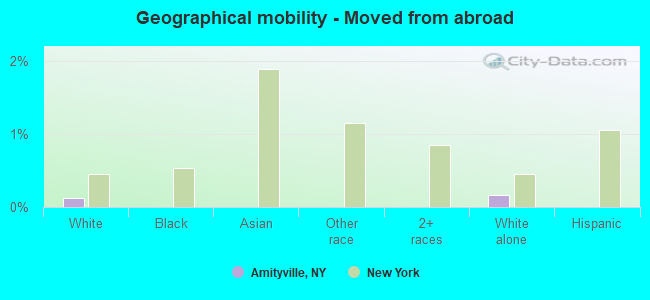
Geographical mobility - Moved from abroad (%)
Geographical mobility - Moved from abroad (%) - White
Geographical mobility - Moved from abroad (%) - Black or African American
Geographical mobility - Moved from abroad (%) - Asian
Geographical mobility - Moved from abroad (%) - Hispanic or Latino
Geographical mobility - Moved from abroad (%) - American Indian and Alaska Native
Geographical mobility - Moved from abroad (%) - Multirace
Geographical mobility - Moved from abroad (%) - Other Race
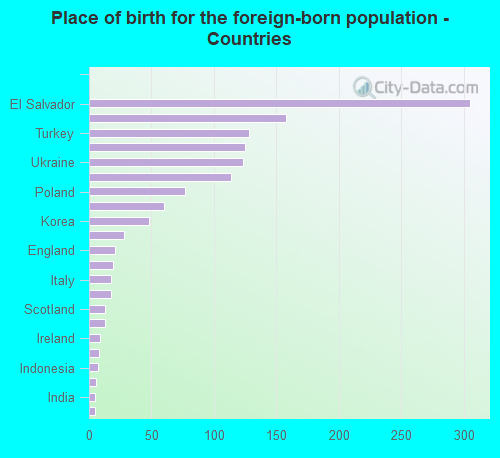
Place of birth for the foreign-born population - Ireland (%)
Place of birth for the foreign-born population - Denmark (%)
Place of birth for the foreign-born population - Norway (%)
Place of birth for the foreign-born population - Sweden (%)
Place of birth for the foreign-born population - United Kingdom (%)
Place of birth for the foreign-born population - England (%)
Place of birth for the foreign-born population - Scotland (%)
Place of birth for the foreign-born population - Other Northern Europe (%)
Place of birth for the foreign-born population - Austria (%)
Place of birth for the foreign-born population - Belgium (%)
Place of birth for the foreign-born population - France (%)
Place of birth for the foreign-born population - Germany (%)
Place of birth for the foreign-born population - Netherlands (%)
Place of birth for the foreign-born population - Switzerland (%)
Place of birth for the foreign-born population - Other Western Europe (%)
Place of birth for the foreign-born population - Greece (%)
Place of birth for the foreign-born population - Italy (%)
Place of birth for the foreign-born population - Portugal (%)
Place of birth for the foreign-born population - Spain (%)
Place of birth for the foreign-born population - Other Southern Europe (%)
Place of birth for the foreign-born population - Albania (%)
Place of birth for the foreign-born population - Belarus (%)
Place of birth for the foreign-born population - Bosnia and Herzegovina (%)
Place of birth for the foreign-born population - Bulgaria (%)
Place of birth for the foreign-born population - Croatia (%)
Place of birth for the foreign-born population - Czechoslovakia (%)
Place of birth for the foreign-born population - Hungary (%)
Place of birth for the foreign-born population - Latvia (%)
Place of birth for the foreign-born population - Lithuania (%)
Place of birth for the foreign-born population - North Macedonia (Macedonia) (%)
Place of birth for the foreign-born population - Moldova (%)
Place of birth for the foreign-born population - Poland (%)
Place of birth for the foreign-born population - Romania (%)
Place of birth for the foreign-born population - Russia (%)
Place of birth for the foreign-born population - Serbia (%)
Place of birth for the foreign-born population - Ukraine (%)
Place of birth for the foreign-born population - Other Eastern Europe (%)
Place of birth for the foreign-born population - China (%)
Place of birth for the foreign-born population - Hong Kong (%)
Place of birth for the foreign-born population - Taiwan (%)
Place of birth for the foreign-born population - Japan (%)
Place of birth for the foreign-born population - Korea (%)
Place of birth for the foreign-born population - Other Eastern Asia (%)
Place of birth for the foreign-born population - Afghanistan (%)
Place of birth for the foreign-born population - Bangladesh (%)
Place of birth for the foreign-born population - India (%)
Place of birth for the foreign-born population - Iran (%)
Place of birth for the foreign-born population - Kazakhstan (%)
Place of birth for the foreign-born population - Nepal (%)
Place of birth for the foreign-born population - Pakistan (%)
Place of birth for the foreign-born population - Sri Lanka (%)
Place of birth for the foreign-born population - Uzbekistan (%)
Place of birth for the foreign-born population - Other South Central Asia (%)
Place of birth for the foreign-born population - Burma (%)
Place of birth for the foreign-born population - Cambodia (%)
Place of birth for the foreign-born population - Indonesia (%)
Place of birth for the foreign-born population - Laos (%)
Place of birth for the foreign-born population - Malaysia (%)
Place of birth for the foreign-born population - Philippines (%)
Place of birth for the foreign-born population - Singapore (%)
Place of birth for the foreign-born population - Thailand (%)
Place of birth for the foreign-born population - Vietnam (%)
Place of birth for the foreign-born population - Other South Eastern Asia (%)
Place of birth for the foreign-born population - Armenia (%)
Place of birth for the foreign-born population - Iraq (%)
Place of birth for the foreign-born population - Israel (%)
Place of birth for the foreign-born population - Jordan (%)
Place of birth for the foreign-born population - Kuwait (%)
Place of birth for the foreign-born population - Lebanon (%)
Place of birth for the foreign-born population - Saudi Arabia (%)
Place of birth for the foreign-born population - Syria (%)
Place of birth for the foreign-born population - Turkey (%)
Place of birth for the foreign-born population - Yemen (%)
Place of birth for the foreign-born population - Other Western Asia (%)
Place of birth for the foreign-born population - Eritrea (%)
Place of birth for the foreign-born population - Ethiopia (%)
Place of birth for the foreign-born population - Kenya (%)
Place of birth for the foreign-born population - Somalia (%)
Place of birth for the foreign-born population - Uganda (%)
Place of birth for the foreign-born population - Zimbabwe (%)
Place of birth for the foreign-born population - Other Eastern Africa (%)
Place of birth for the foreign-born population - Cameroon (%)
Place of birth for the foreign-born population - Congo (%)
Place of birth for the foreign-born population - Democratic Republic of Congo (Zaire) (%)
Place of birth for the foreign-born population - Other Middle Africa (%)
Place of birth for the foreign-born population - Egypt (%)
Place of birth for the foreign-born population - Morocco (%)
Place of birth for the foreign-born population - Sudan (%)
Place of birth for the foreign-born population - Other Northern Africa (%)
Place of birth for the foreign-born population - South Africa (%)
Place of birth for the foreign-born population - Other Southern Africa (%)
Place of birth for the foreign-born population - Cabo Verde (%)
Place of birth for the foreign-born population - Ghana (%)
Place of birth for the foreign-born population - Liberia (%)
Place of birth for the foreign-born population - Nigeria (%)
Place of birth for the foreign-born population - Senegal (%)
Place of birth for the foreign-born population - Sierra Leone (%)
Place of birth for the foreign-born population - Other Western Africa (%)
Place of birth for the foreign-born population - Australia (%)
Place of birth for the foreign-born population - New Zealand (%)
Place of birth for the foreign-born population - Fiji (%)
Place of birth for the foreign-born population - Micronesia (%)
Place of birth for the foreign-born population - Bahamas (%)
Place of birth for the foreign-born population - Barbados (%)
Place of birth for the foreign-born population - Cuba (%)
Place of birth for the foreign-born population - Dominica (%)
Place of birth for the foreign-born population - Dominican Republic (%)
Place of birth for the foreign-born population - Grenada (%)
Place of birth for the foreign-born population - Haiti (%)
Place of birth for the foreign-born population - Jamaica (%)
Place of birth for the foreign-born population - St. Vincent and the Grenadines (%)
Place of birth for the foreign-born population - Trinidad and Tobago (%)
Place of birth for the foreign-born population - West Indies (%)
Place of birth for the foreign-born population - Other Caribbean (%)
Place of birth for the foreign-born population - Belize (%)
Place of birth for the foreign-born population - Costa Rica (%)
Place of birth for the foreign-born population - El Salvador (%)
Place of birth for the foreign-born population - Guatemala (%)
Place of birth for the foreign-born population - Honduras (%)
Place of birth for the foreign-born population - Mexico (%)
Place of birth for the foreign-born population - Nicaragua (%)
Place of birth for the foreign-born population - Panama (%)
Place of birth for the foreign-born population - Other Central America (%)
Place of birth for the foreign-born population - Argentina (%)
Place of birth for the foreign-born population - Bolivia (%)
Place of birth for the foreign-born population - Brazil (%)
Place of birth for the foreign-born population - Chile (%)
Place of birth for the foreign-born population - Colombia (%)
Place of birth for the foreign-born population - Ecuador (%)
Place of birth for the foreign-born population - Guyana (%)
Place of birth for the foreign-born population - Peru (%)
Place of birth for the foreign-born population - Uruguay (%)
Place of birth for the foreign-born population - Venezuela (%)
Place of birth for the foreign-born population - Other South America (%)
Place of birth for the foreign-born population - Canada (%)
Place of birth for the foreign-born population - Other Northern America (%)
Place of birth for the foreign-born population - Other (%)
Latest news about races in Amityville, NY collected exclusively by city-data.com from local newspapers, TV, and radio stations
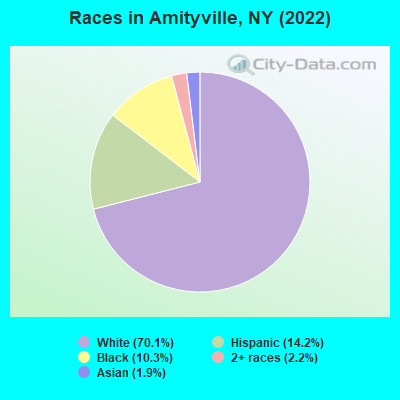
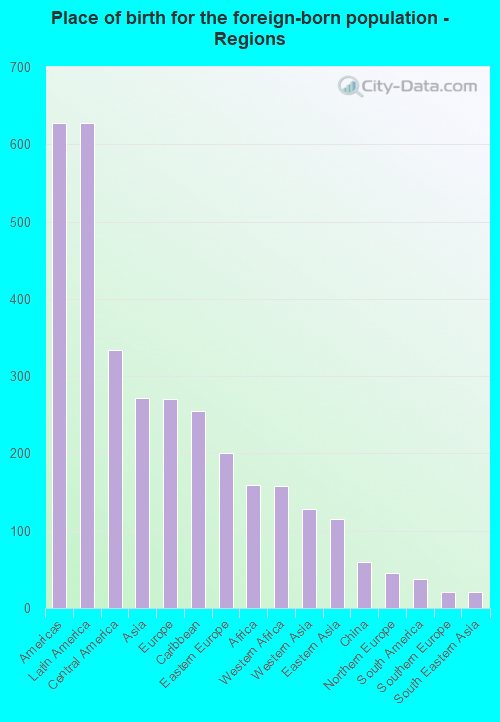
According to 2022 data, the most numerous races in Amityville, NY are White alone (6,666 residents), Hispanic (1,348 residents), and Black alone (976 residents). 78.0% of Amityville residents speak English at home. 14.0% of Amityville, NY residents are foreign-born (6.7% born in Latin America, 2.9% born in Asia, 2.9% born in Europe, 1.7% born in Africa), which is 57.4% less than the foreign-born rate of 22.0% across the entire state of New York.
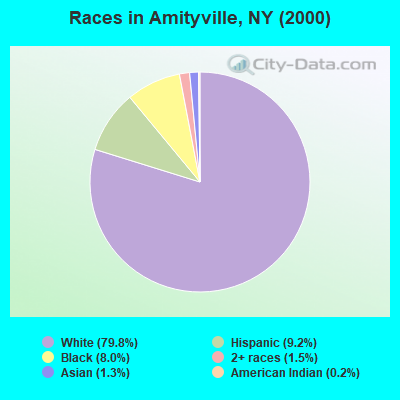
Race distribution in Amityville
2000 2022
11,760,981 62.0% White alone 2,867,583 15.1% Hispanic 2,812,623 14.8% Black alone 1,035,926 5.5% Asian alone 366,116 1.9% Two or more races 75,499 0.4% Other race alone 52,499 0.3% American Indian alone 5,230 0.03% Native Hawaiian and Other
10,408,933 52.9% White alone 3,867,299 19.7% Hispanic 2,633,840 13.4% Black alone 1,776,286 9.0% Asian alone 732,670 3.7% Two or more races 216,110 1.1% Other race alone 35,082 0.2% American Indian alone 6,931 0.04% Native Hawaiian and Other
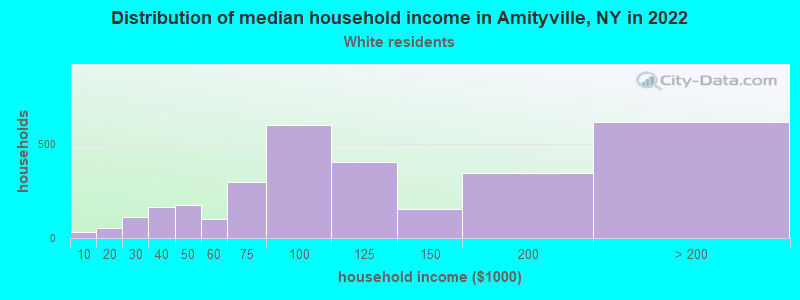
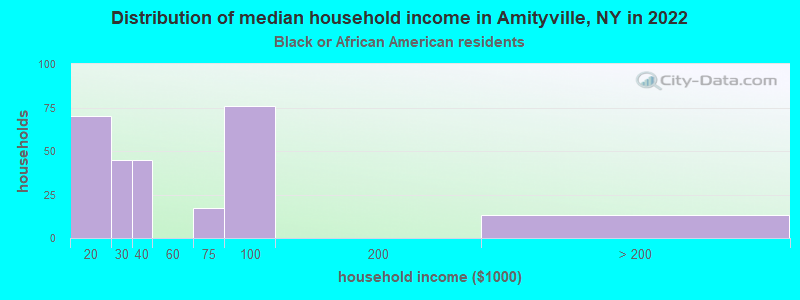
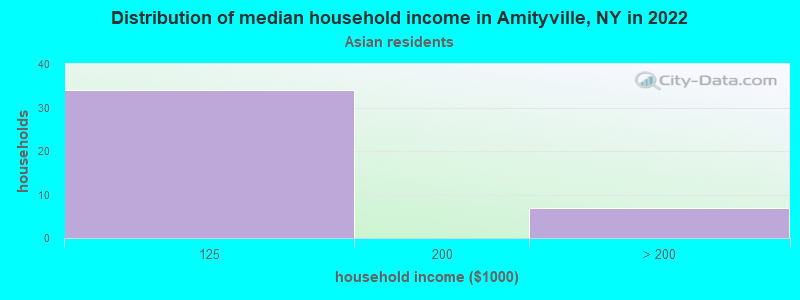
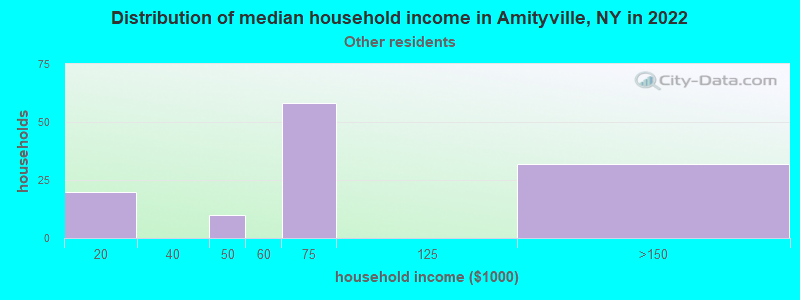
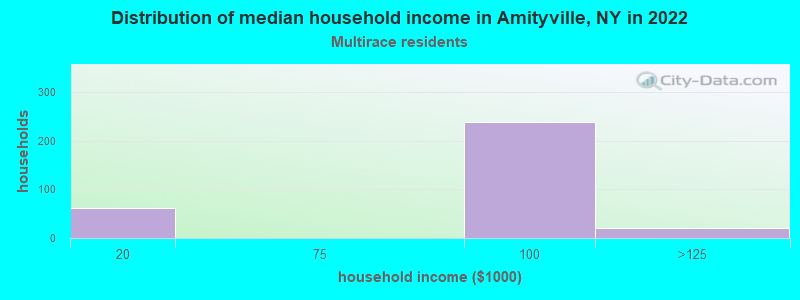
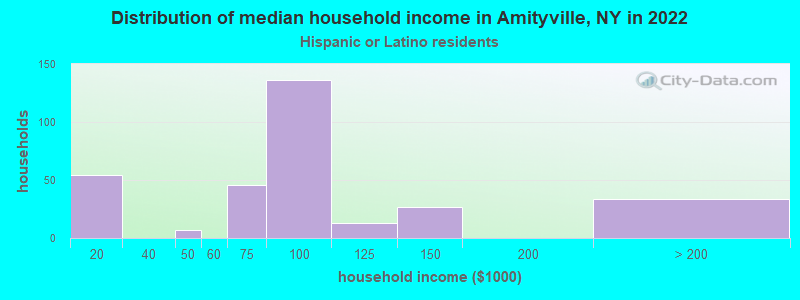
Income and house value in Amityville Median household income in 2022 $100,665 White non-Hispanic householders$36,244 Black householders$74,162 Some other race householders$80,533 Two or more races householders$79,237 Hispanic or Latino race householdersMedian 2022 house value $557,288 White Non-Hispanic householders$410,050 Black or African American householders$296,851 American Indian or Alaska Native householders $601,091 Asian householders$362,818 Some other race householders$395,010 Hispanic or Latino householders
Median age by race in Amityville
55.6 Median age for White residents57.9 54.8 38.6 Median age for Black or African American residents40.7 38.3 -748,832,865.7 Median age for American Indian / Alaska Native residents-807,017,543.1 -513,692,161.9 53.8 Median age for Asian residents54.5 44.6 -742,816,091.2 Median age for Native Hawaiian / Pacific Islander residents-831,187,409.8 -771,300,447.7 27.2 Median age for Other race residents26.8 23.2 41.1 Median age for Two or more races residents44.9 17.4 54.6 Median age for White alone residents57.1 53.8 33.2 Median age for Hispanic or Latino residents40.5 22.6
Owner/renter occupied households by race in Amityville
House owners and renters - White residents 2,324 76.9% Owner occupied699 23.1% Renter occupiedHouse owners and renters - Black or African American residents 33 11.3% Owner occupied259 88.7% Renter occupiedHouse owners and renters - Asian residents 43 100.0% Owner occupiedHouse owners and renters - Other race residents 159 100.0% Renter occupiedHouse owners and renters - Two or more races residents 215 89.1% Owner occupied26 10.9% Renter occupiedHouse owners and renters - White alone residents 2,334 75.4% Owner occupied760 24.6% Renter occupiedHouse owners and renters - Hispanic or Latino residents 202 64.1% Owner occupied113 35.9% Renter occupied
Language usage in Amityville
English speakers - Total 78.0% of residents of Amityville speak English at home.
9.3% of residents speak Spanish at home 592 69.6% Speak English very well258 30.4% Speak English less than very well12.5% of residents speak other language at home 884 77.3% Speak English very well260 22.7% Speak English less than very well
English speakers - Born in the United States 92.1% of residents of Amityville speak English at home.
7.7% of residents speak Spanish at home 62 100.0% Speak English very well
All residents speak only English at home
English speakers - Foreign-born 10.9% of residents of Amityville speak English at home.
36.1% of residents speak Spanish at home 253 50.1% Speak English very well252 49.9% Speak English less than very well51.1% of residents speak other language at home 450 62.9% Speak English very well265 37.1% Speak English less than very well
White (Caucasian) - Speak only English Native:
96.1% (5,951)Foreign-born:
18.6% (57)
White (Caucasian) - Speak another language Native:
4.2% (262)Foreign-born:
78.0% (237)
Black or African American - Speak only English Native:
97.0% (512)Foreign-born:
32.3% (100)
Asian - Speak only English Native:
63.8% (25)Foreign-born:
2.8% (4)
Asian - Speak another language Native:
32.8% (13)Foreign-born:
100.0% (134)
Other race - Speak another language Native:
94.6% (310)Foreign-born:
100.0% (405)
Two or more races - Speak another language Native:
24.8% (125)Foreign-born:
100.0% (247)
White alone - Speak only English Native:
94.1% (5,855)Foreign-born:
15.0% (62)
White alone - Speak another language Native:
6.1% (377)Foreign-born:
85.0% (350)
Hispanic or Latino - Speak another language Native:
45.6% (324)Foreign-born:
100.0% (515)
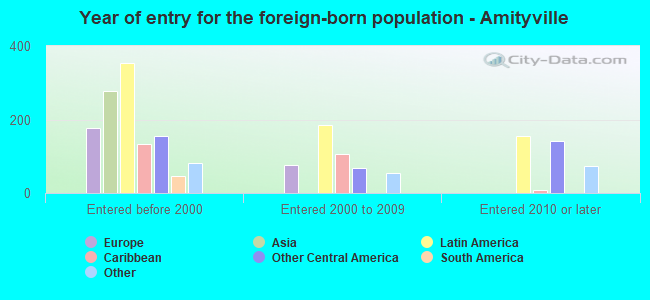
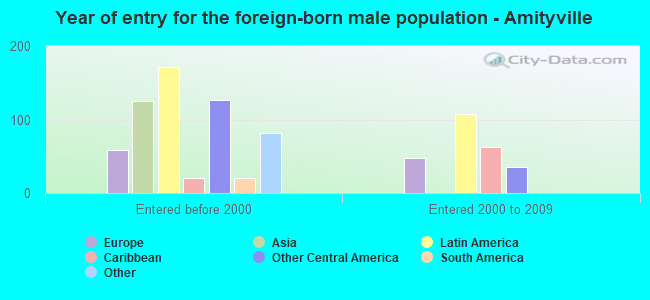
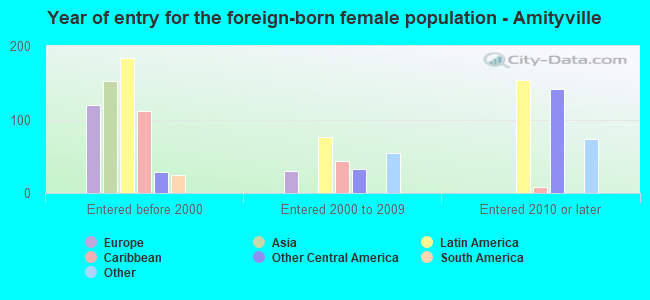
Foreign-born residents in Amityville 1,330 residents are foreign born (6.7% Latin America , 2.9% Asia , 2.9% Europe , 1.7% Africa ).
This city:
14.0%New York:
22.6%
Marital status for residents in Amityville Marital status - White (Caucasian) population 15 years and over
Males 26.4% Never married58.0% Now married0.6% Separated8.0% Widowed6.9% DivorcedFemales 29.2% Never married48.9% Now married0.0% Separated10.2% Widowed11.7% DivorcedWomen who did not give birth in the past 12 months Now married:
37.2% (446)Unmarried:
62.8% (753)
Marital status - Black or African American population 15 years and over
Males 40.8% Never married58.1% Now married0.0% Separated0.0% Widowed1.1% DivorcedFemales 26.1% Never married36.2% Now married11.7% Separated12.7% Widowed13.3% DivorcedWomen who did not give birth in the past 12 months Now married:
61.1% (164)Unmarried:
38.9% (104)
Marital status - Asian population 15 years and over
Males 42.9% Never married57.1% Now married0.0% Separated0.0% Widowed0.0% DivorcedFemales 0.0% Never married100.0% Now married0.0% Separated0.0% Widowed0.0% DivorcedWomen who did not give birth in the past 12 months Now married:
100.0% (51)Unmarried:
0.0% (0)
Marital status - Other race population 15 years and over
Males 59.7% Never married40.3% Now married0.0% Separated0.0% Widowed0.0% DivorcedFemales 44.6% Never married15.1% Now married4.7% Separated17.8% Widowed17.8% DivorcedWomen who did not give birth in the past 12 months Now married:
26.8% (61)Unmarried:
73.2% (168)
Marital status - Two or more races population 15 years and over
Males 74.4% Never married25.6% Now married0.0% Separated0.0% Widowed0.0% DivorcedFemales 56.1% Never married10.5% Now married0.0% Separated6.4% Widowed26.9% DivorcedWomen who did not give birth in the past 12 months Now married:
5.3% (10)Unmarried:
94.7% (181)
Marital status - White alone, not Hispanic / Latino population 15 years and over
Males 26.4% Never married58.0% Now married0.6% Separated8.1% Widowed7.0% DivorcedFemales 29.4% Never married48.9% Now married0.0% Separated9.7% Widowed12.1% DivorcedWomen who did not give birth in the past 12 months Now married:
36.7% (458)Unmarried:
63.3% (790)
Marital status - Hispanic or Latino population 15 years and over
Males 63.9% Never married36.1% Now married0.0% Separated0.0% Widowed0.0% DivorcedFemales 44.6% Never married20.8% Now married2.4% Separated17.1% Widowed15.1% DivorcedWomen who did not give birth in the past 12 months Now married:
22.7% (70)Unmarried:
77.3% (240)
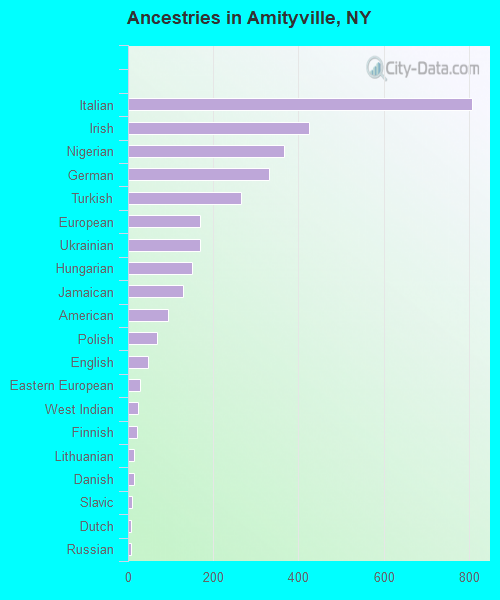
Ancestries in Amityville
807 18.6% Italian424 9.8% Irish367 8.4% Nigerian332 7.6% German265 6.1% Turkish168 3.9% European168 3.9% Ukrainian150 3.5% Hungarian129 3.0% Jamaican93 2.1% American69 1.6% Polish47 1.1% English27 0.6% Eastern European23 0.5% West Indian22 0.5% Finnish15 0.3% Lithuanian14 0.3% Danish10 0.2% Slavic8 0.2% Dutch8 0.2% Russian6 0.1% Guyanese6 0.1% Haitian5 0.1% British2 0.05% Greek1 0.02% Egyptian
Children Nativity (place of birth) in Amityville
Children under 6 years - Living with two parents Both parents native 135 100.0% NativeBoth parents foreign-born 168 100.0% NativeOne native, one foreign-born parent 31 100.0% NativeChildren under 6 years - Living with one parent Native parent 29 92.2% Native2 7.8% Foreign-bornForeign-born parent 20 48.4% Native21 51.6% Foreign-bornChildren 6 to 17 years - Living with two parents Both parents native 279 100.0% NativeBoth parents foreign-born 343 100.0% NativeOne native, one foreign-born parent 89 100.0% NativeChildren 6 to 17 years - Living with one parent Native parent 58 64.6% Native32 35.4% Foreign-bornForeign-born parent 57 79.3% Native15 20.7% Foreign-born