Races in Amsterdam, New York (NY) Detailed Stats
Data:
Races - White alone (%)
Races - White alone (% change since 2000)
Races - Black alone (%)
Races - Black alone (% change since 2000)
Races - American Indian alone (%)
Races - American Indian alone (% change since 2000)
Races - Asian alone (%)
Races - Asian alone (% change since 2000)
Races - Hispanic (%)
Races - Hispanic (% change since 2000)
Races - Native Hawaiian and Other Pacific Islander alone (%)
Races - Native Hawaiian and Other Pacific Islander alone (% change since 2000)
Races - Two or more races(%)
Races - Two or more races(% change since 2000)
Races - Other race alone (%)
Races - Other race alone (% change since 2000)
Racial diversity
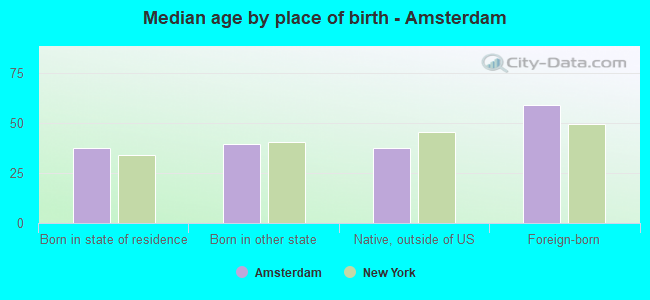
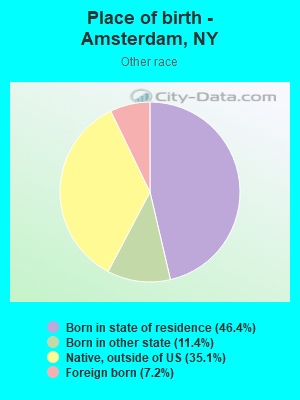
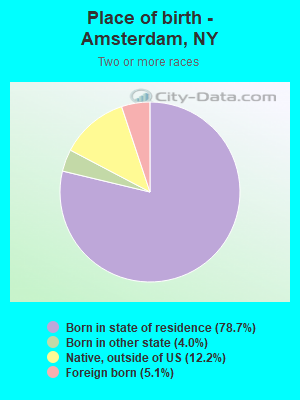
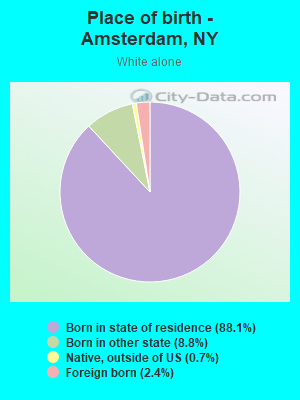
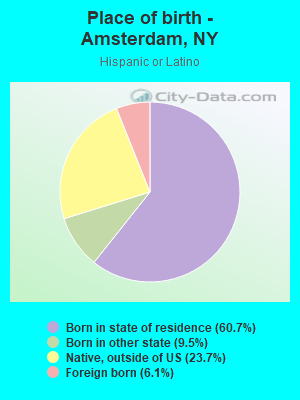
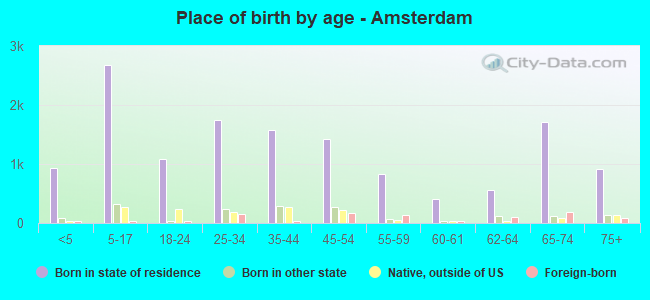
Place of birth - Born in state of residence (%)
Place of birth - Born in state of residence (%) - White
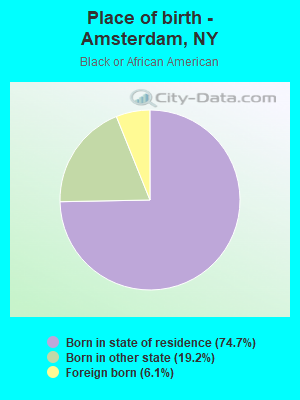
Place of birth - Born in state of residence (%) - Black or African American
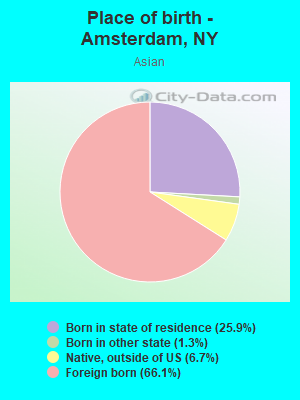
Place of birth - Born in state of residence (%) - Asian
Place of birth - Born in state of residence (%) - Hispanic or Latino
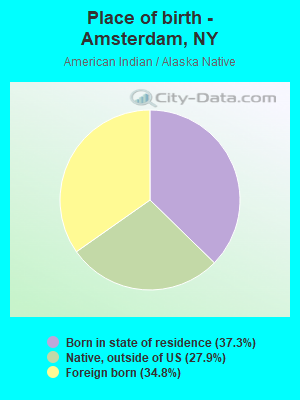
Place of birth - Born in state of residence (%) - American Indian and Alaska Native
Place of birth - Born in state of residence (%) - Multirace
Place of birth - Born in state of residence (%) - Other Race
Place of birth - Born in other state (%)
Place of birth - Born in other state (%) - White
Place of birth - Born in other state (%) - Black or African American
Place of birth - Born in other state (%) - Asian
Place of birth - Born in other state (%) - Hispanic or Latino
Place of birth - Born in other state (%) - American Indian and Alaska Native
Place of birth - Born in other state (%) - Multirace
Place of birth - Born in other state (%) - Other Race
Place of birth - Native, outside of US (%)
Place of birth - Native, outside of US (%) - White
Place of birth - Native, outside of US (%) - Black or African American
Place of birth - Native, outside of US (%) - Asian
Place of birth - Native, outside of US (%) - Hispanic or Latino
Place of birth - Native, outside of US (%) - American Indian and Alaska Native
Place of birth - Native, outside of US (%) - Multirace
Place of birth - Native, outside of US (%) - Other Race
Place of birth - Foreign born (%)
Place of birth - Foreign born (%) - White
Place of birth - Foreign born (%) - Black or African American
Place of birth - Foreign born (%) - Asian
Place of birth - Foreign born (%) - Hispanic or Latino
Place of birth - Foreign born (%) - American Indian and Alaska Native
Place of birth - Foreign born (%) - Multirace
Place of birth - Foreign born (%) - Other Race
Residents speaking English at home (%)
Residents speaking English at home - Born in the United States (%)
Residents speaking English at home - Native, born elsewhere (%)
Residents speaking English at home - Foreign born (%)
Residents speaking Spanish at home (%)
Residents speaking Spanish at home - Born in the United States (%)
Residents speaking Spanish at home - Native, born elsewhere (%)
Residents speaking Spanish at home - Foreign born (%)
Residents speaking other language at home (%)
Residents speaking other language at home - Born in the United States (%)
Residents speaking other language at home - Native, born elsewhere (%)
Residents speaking other language at home - Foreign born (%)
Marital status - Never married (%)
Marital status - Now married (%)
Marital status - Separated (%)
Marital status - Widowed (%)
Marital status - Divorced (%)
Ancestries Reported - Arab (%)
Ancestries Reported - Czech (%)
Ancestries Reported - Danish (%)
Ancestries Reported - Dutch (%)
Ancestries Reported - English (%)
Ancestries Reported - French (%)
Ancestries Reported - French Canadian (%)
Ancestries Reported - German (%)
Ancestries Reported - Greek (%)
Ancestries Reported - Hungarian (%)
Ancestries Reported - Irish (%)
Ancestries Reported - Italian (%)
Ancestries Reported - Lithuanian (%)
Ancestries Reported - Norwegian (%)
Ancestries Reported - Polish (%)
Ancestries Reported - Portuguese (%)
Ancestries Reported - Russian (%)
Ancestries Reported - Scotch-Irish (%)
Ancestries Reported - Scottish (%)
Ancestries Reported - Slovak (%)
Ancestries Reported - Subsaharan African (%)
Ancestries Reported - Swedish (%)
Ancestries Reported - Swiss (%)
Ancestries Reported - Ukrainian (%)
Ancestries Reported - United States (%)
Ancestries Reported - Welsh (%)
Ancestries Reported - West Indian (%)
Ancestries Reported - Other (%)
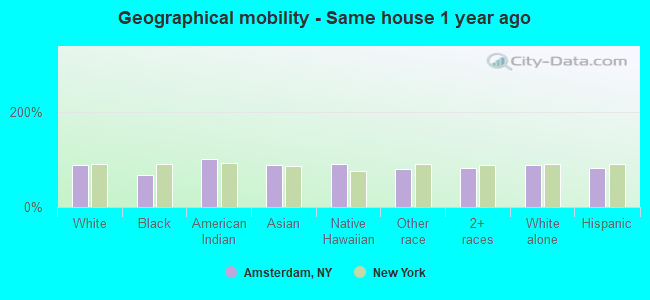
Geographical mobility - Same house 1 year ago (%)
Geographical mobility - Same house 1 year ago (%) - White
Geographical mobility - Same house 1 year ago (%) - Black or African American
Geographical mobility - Same house 1 year ago (%) - Asian
Geographical mobility - Same house 1 year ago (%) - Hispanic or Latino
Geographical mobility - Same house 1 year ago (%) - American Indian and Alaska Native
Geographical mobility - Same house 1 year ago (%) - Multirace
Geographical mobility - Same house 1 year ago (%) - Other Race
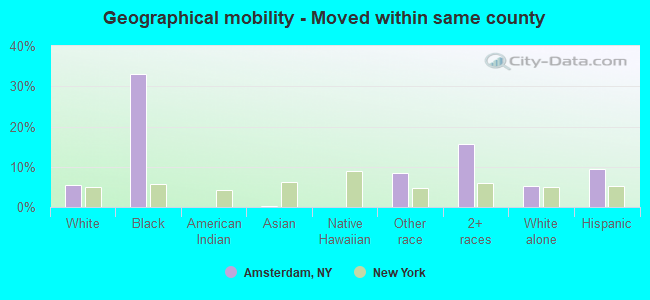
Geographical mobility - Moved within same county (%)
Geographical mobility - Moved within same county (%) - White
Geographical mobility - Moved within same county (%) - Black or African American
Geographical mobility - Moved within same county (%) - Asian
Geographical mobility - Moved within same county (%) - Hispanic or Latino
Geographical mobility - Moved within same county (%) - American Indian and Alaska Native
Geographical mobility - Moved within same county (%) - Multirace
Geographical mobility - Moved within same county (%) - Other Race
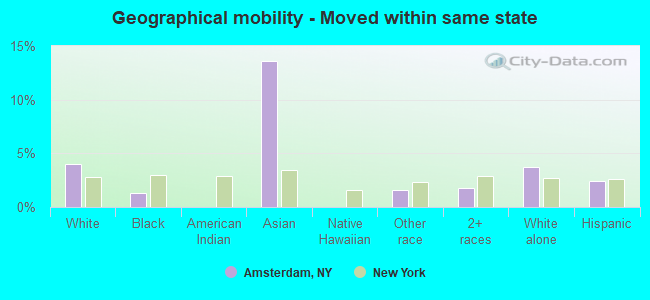
Geographical mobility - Moved from different county within same state (%)
Geographical mobility - Moved from different county within same state (%) - White
Geographical mobility - Moved from different county within same state (%) - Black or African American
Geographical mobility - Moved from different county within same state (%) - Asian
Geographical mobility - Moved from different county within same state (%) - Hispanic or Latino
Geographical mobility - Moved from different county within same state (%) - American Indian and Alaska Native
Geographical mobility - Moved from different county within same state (%) - Multirace
Geographical mobility - Moved from different county within same state (%) - Other Race
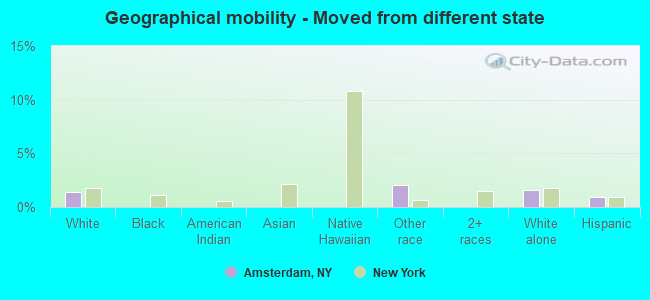
Geographical mobility - Moved from different state (%)
Geographical mobility - Moved from different state (%) - White
Geographical mobility - Moved from different state (%) - Black or African American
Geographical mobility - Moved from different state (%) - Asian
Geographical mobility - Moved from different state (%) - Hispanic or Latino
Geographical mobility - Moved from different state (%) - American Indian and Alaska Native
Geographical mobility - Moved from different state (%) - Multirace
Geographical mobility - Moved from different state (%) - Other Race
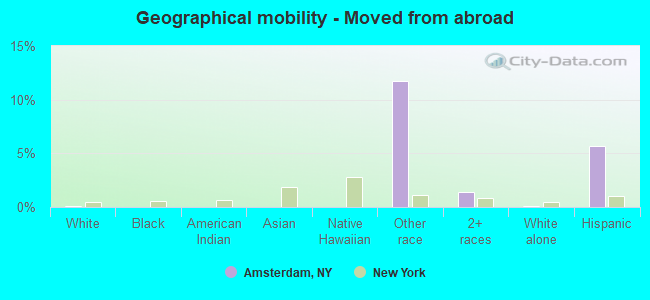
Geographical mobility - Moved from abroad (%)
Geographical mobility - Moved from abroad (%) - White
Geographical mobility - Moved from abroad (%) - Black or African American
Geographical mobility - Moved from abroad (%) - Asian
Geographical mobility - Moved from abroad (%) - Hispanic or Latino
Geographical mobility - Moved from abroad (%) - American Indian and Alaska Native
Geographical mobility - Moved from abroad (%) - Multirace
Geographical mobility - Moved from abroad (%) - Other Race
Place of birth for the foreign-born population - Ireland (%)
Place of birth for the foreign-born population - Denmark (%)
Place of birth for the foreign-born population - Norway (%)
Place of birth for the foreign-born population - Sweden (%)
Place of birth for the foreign-born population - United Kingdom (%)
Place of birth for the foreign-born population - England (%)
Place of birth for the foreign-born population - Scotland (%)
Place of birth for the foreign-born population - Other Northern Europe (%)
Place of birth for the foreign-born population - Austria (%)
Place of birth for the foreign-born population - Belgium (%)
Place of birth for the foreign-born population - France (%)
Place of birth for the foreign-born population - Germany (%)
Place of birth for the foreign-born population - Netherlands (%)
Place of birth for the foreign-born population - Switzerland (%)
Place of birth for the foreign-born population - Other Western Europe (%)
Place of birth for the foreign-born population - Greece (%)
Place of birth for the foreign-born population - Italy (%)
Place of birth for the foreign-born population - Portugal (%)
Place of birth for the foreign-born population - Spain (%)
Place of birth for the foreign-born population - Other Southern Europe (%)
Place of birth for the foreign-born population - Albania (%)
Place of birth for the foreign-born population - Belarus (%)
Place of birth for the foreign-born population - Bosnia and Herzegovina (%)
Place of birth for the foreign-born population - Bulgaria (%)
Place of birth for the foreign-born population - Croatia (%)
Place of birth for the foreign-born population - Czechoslovakia (%)
Place of birth for the foreign-born population - Hungary (%)
Place of birth for the foreign-born population - Latvia (%)
Place of birth for the foreign-born population - Lithuania (%)
Place of birth for the foreign-born population - North Macedonia (Macedonia) (%)
Place of birth for the foreign-born population - Moldova (%)
Place of birth for the foreign-born population - Poland (%)
Place of birth for the foreign-born population - Romania (%)
Place of birth for the foreign-born population - Russia (%)
Place of birth for the foreign-born population - Serbia (%)
Place of birth for the foreign-born population - Ukraine (%)
Place of birth for the foreign-born population - Other Eastern Europe (%)
Place of birth for the foreign-born population - China (%)
Place of birth for the foreign-born population - Hong Kong (%)
Place of birth for the foreign-born population - Taiwan (%)
Place of birth for the foreign-born population - Japan (%)
Place of birth for the foreign-born population - Korea (%)
Place of birth for the foreign-born population - Other Eastern Asia (%)
Place of birth for the foreign-born population - Afghanistan (%)
Place of birth for the foreign-born population - Bangladesh (%)
Place of birth for the foreign-born population - India (%)
Place of birth for the foreign-born population - Iran (%)
Place of birth for the foreign-born population - Kazakhstan (%)
Place of birth for the foreign-born population - Nepal (%)
Place of birth for the foreign-born population - Pakistan (%)
Place of birth for the foreign-born population - Sri Lanka (%)
Place of birth for the foreign-born population - Uzbekistan (%)
Place of birth for the foreign-born population - Other South Central Asia (%)
Place of birth for the foreign-born population - Burma (%)
Place of birth for the foreign-born population - Cambodia (%)
Place of birth for the foreign-born population - Indonesia (%)
Place of birth for the foreign-born population - Laos (%)
Place of birth for the foreign-born population - Malaysia (%)
Place of birth for the foreign-born population - Philippines (%)
Place of birth for the foreign-born population - Singapore (%)
Place of birth for the foreign-born population - Thailand (%)
Place of birth for the foreign-born population - Vietnam (%)
Place of birth for the foreign-born population - Other South Eastern Asia (%)
Place of birth for the foreign-born population - Armenia (%)
Place of birth for the foreign-born population - Iraq (%)
Place of birth for the foreign-born population - Israel (%)
Place of birth for the foreign-born population - Jordan (%)
Place of birth for the foreign-born population - Kuwait (%)
Place of birth for the foreign-born population - Lebanon (%)
Place of birth for the foreign-born population - Saudi Arabia (%)
Place of birth for the foreign-born population - Syria (%)
Place of birth for the foreign-born population - Turkey (%)
Place of birth for the foreign-born population - Yemen (%)
Place of birth for the foreign-born population - Other Western Asia (%)
Place of birth for the foreign-born population - Eritrea (%)
Place of birth for the foreign-born population - Ethiopia (%)
Place of birth for the foreign-born population - Kenya (%)
Place of birth for the foreign-born population - Somalia (%)
Place of birth for the foreign-born population - Uganda (%)
Place of birth for the foreign-born population - Zimbabwe (%)
Place of birth for the foreign-born population - Other Eastern Africa (%)
Place of birth for the foreign-born population - Cameroon (%)
Place of birth for the foreign-born population - Congo (%)
Place of birth for the foreign-born population - Democratic Republic of Congo (Zaire) (%)
Place of birth for the foreign-born population - Other Middle Africa (%)
Place of birth for the foreign-born population - Egypt (%)
Place of birth for the foreign-born population - Morocco (%)
Place of birth for the foreign-born population - Sudan (%)
Place of birth for the foreign-born population - Other Northern Africa (%)
Place of birth for the foreign-born population - South Africa (%)
Place of birth for the foreign-born population - Other Southern Africa (%)
Place of birth for the foreign-born population - Cabo Verde (%)
Place of birth for the foreign-born population - Ghana (%)
Place of birth for the foreign-born population - Liberia (%)
Place of birth for the foreign-born population - Nigeria (%)
Place of birth for the foreign-born population - Senegal (%)
Place of birth for the foreign-born population - Sierra Leone (%)
Place of birth for the foreign-born population - Other Western Africa (%)
Place of birth for the foreign-born population - Australia (%)
Place of birth for the foreign-born population - New Zealand (%)
Place of birth for the foreign-born population - Fiji (%)
Place of birth for the foreign-born population - Micronesia (%)
Place of birth for the foreign-born population - Bahamas (%)
Place of birth for the foreign-born population - Barbados (%)
Place of birth for the foreign-born population - Cuba (%)
Place of birth for the foreign-born population - Dominica (%)
Place of birth for the foreign-born population - Dominican Republic (%)
Place of birth for the foreign-born population - Grenada (%)
Place of birth for the foreign-born population - Haiti (%)
Place of birth for the foreign-born population - Jamaica (%)
Place of birth for the foreign-born population - St. Vincent and the Grenadines (%)
Place of birth for the foreign-born population - Trinidad and Tobago (%)
Place of birth for the foreign-born population - West Indies (%)
Place of birth for the foreign-born population - Other Caribbean (%)
Place of birth for the foreign-born population - Belize (%)
Place of birth for the foreign-born population - Costa Rica (%)
Place of birth for the foreign-born population - El Salvador (%)
Place of birth for the foreign-born population - Guatemala (%)
Place of birth for the foreign-born population - Honduras (%)
Place of birth for the foreign-born population - Mexico (%)
Place of birth for the foreign-born population - Nicaragua (%)
Place of birth for the foreign-born population - Panama (%)
Place of birth for the foreign-born population - Other Central America (%)
Place of birth for the foreign-born population - Argentina (%)
Place of birth for the foreign-born population - Bolivia (%)
Place of birth for the foreign-born population - Brazil (%)
Place of birth for the foreign-born population - Chile (%)
Place of birth for the foreign-born population - Colombia (%)
Place of birth for the foreign-born population - Ecuador (%)
Place of birth for the foreign-born population - Guyana (%)
Place of birth for the foreign-born population - Peru (%)
Place of birth for the foreign-born population - Uruguay (%)
Place of birth for the foreign-born population - Venezuela (%)
Place of birth for the foreign-born population - Other South America (%)
Place of birth for the foreign-born population - Canada (%)
Place of birth for the foreign-born population - Other Northern America (%)
Place of birth for the foreign-born population - Other (%)
Latest news about races in Amsterdam, NY collected exclusively by city-data.com from local newspapers, TV, and radio stations
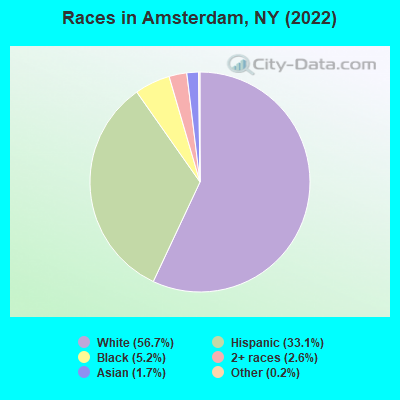
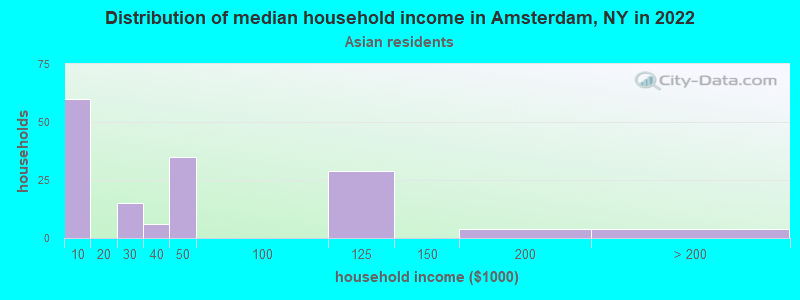
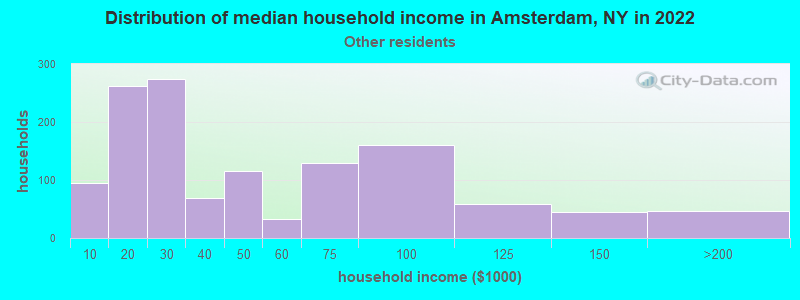
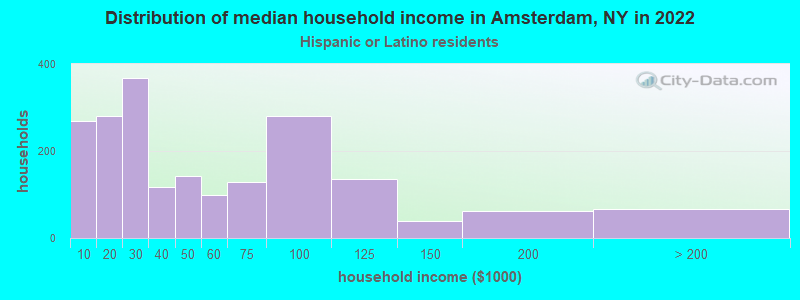
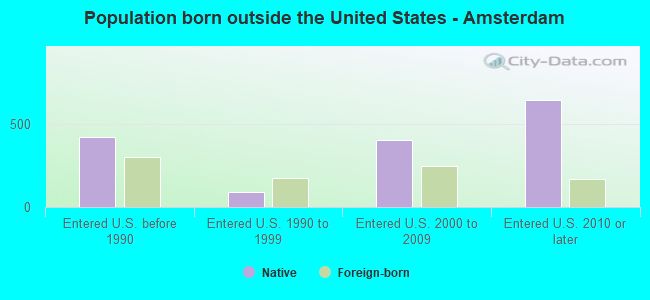
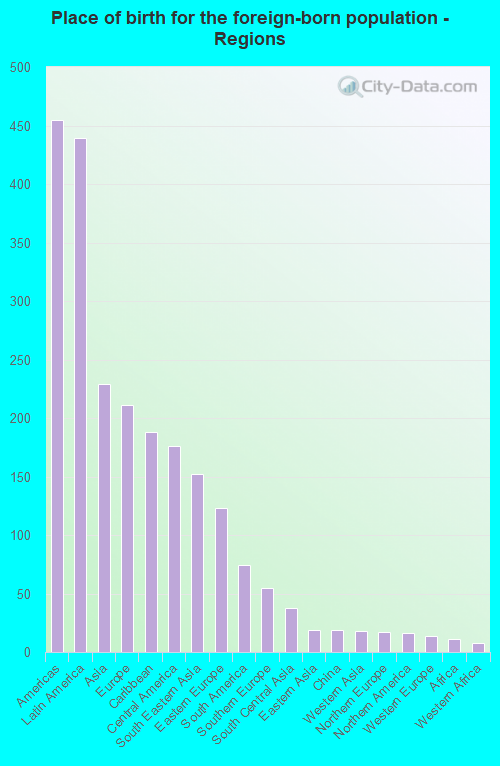
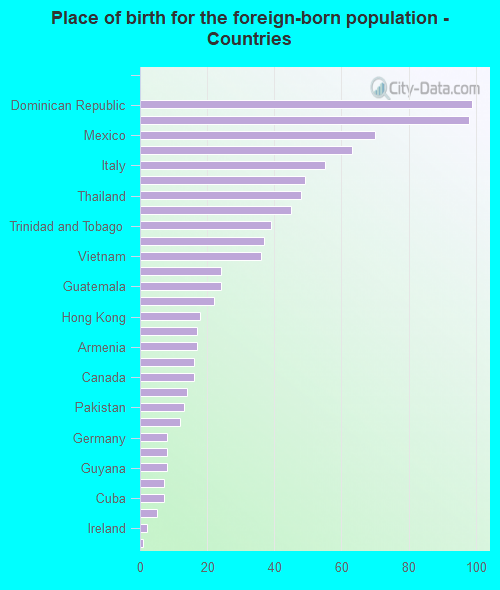
According to 2022 data, the most numerous races in Amsterdam, NY are White alone (10,179 residents), Hispanic (5,942 residents), and Black alone (940 residents). 80.0% of Amsterdam residents speak English at home. 5.1% of Amsterdam, NY residents are foreign-born (2.4% born in Latin America, 1.3% born in Asia, 1.2% born in Europe), which is 335.0% less than the foreign-born rate of 22.0% across the entire state of New York.
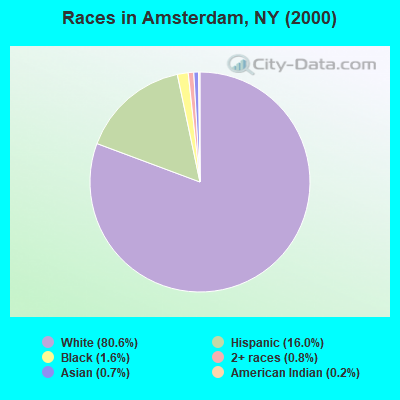
Race distribution in Amsterdam
2000 2022
11,760,981 62.0% White alone 2,867,583 15.1% Hispanic 2,812,623 14.8% Black alone 1,035,926 5.5% Asian alone 366,116 1.9% Two or more races 75,499 0.4% Other race alone 52,499 0.3% American Indian alone 5,230 0.03% Native Hawaiian and Other
10,408,933 52.9% White alone 3,867,299 19.7% Hispanic 2,633,840 13.4% Black alone 1,776,286 9.0% Asian alone 732,670 3.7% Two or more races 216,110 1.1% Other race alone 35,082 0.2% American Indian alone 6,931 0.04% Native Hawaiian and Other
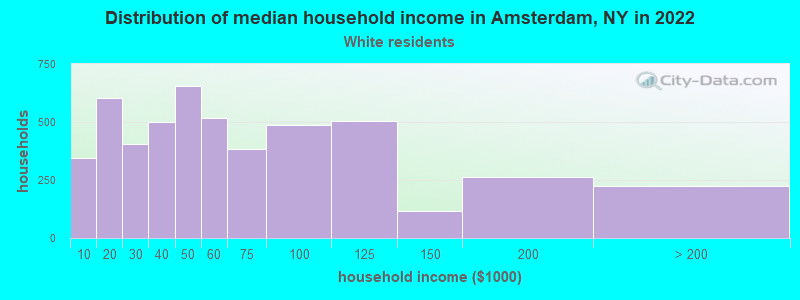
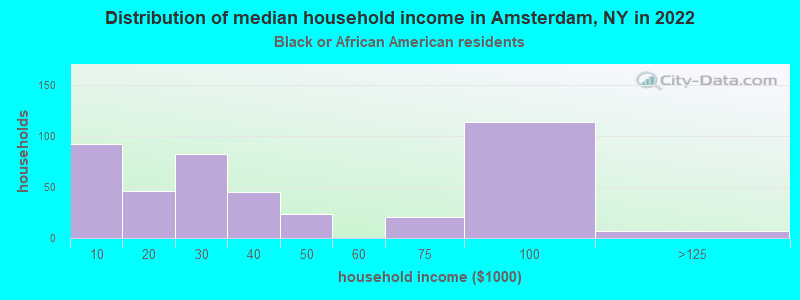
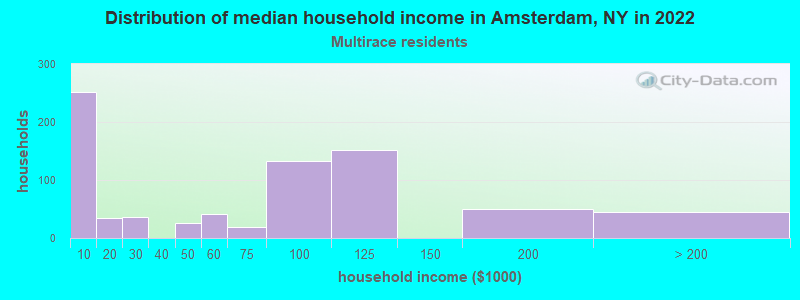
Income and house value in Amsterdam Median household income in 2022 $49,770 White non-Hispanic householders$29,660 Black householders$34,252 Asian householders$30,383 Some other race householders$77,185 Two or more races householders$37,777 Hispanic or Latino race householdersMedian 2022 house value $123,103 White Non-Hispanic householders$171,466 Black or African American householders $180,625 Asian householders$119,073 Some other race householders$137,392 Two or more races householders$118,157 Hispanic or Latino householders
Median age by race in Amsterdam
49.0 Median age for White residents46.5 50.6 28.2 Median age for Black or African American residents28.2 26.4 45.1 Median age for American Indian / Alaska Native residents-707,843,136.5 43.2 42.4 Median age for Asian residents34.3 48.3 -487,992,314.6 Median age for Native Hawaiian / Pacific Islander residents-477,502,295.2 -497,387,669.3 28.0 Median age for Other race residents33.7 24.0 27.9 Median age for Two or more races residents19.8 29.3 51.3 Median age for White alone residents51.5 51.1 27.1 Median age for Hispanic or Latino residents24.6 27.9
Owner/renter occupied households by race in Amsterdam
House owners and renters - White residents 2,996 60.0% Owner occupied1,998 40.0% Renter occupiedHouse owners and renters - Black or African American residents 47 11.4% Owner occupied368 88.6% Renter occupiedHouse owners and renters - American Indian / Alaska Native residents 17 15.2% Owner occupied94 84.8% Renter occupiedHouse owners and renters - Asian residents 60 39.3% Owner occupied92 60.7% Renter occupiedHouse owners and renters - Native Hawaiian / Pacific Islander residents 6 100.0% Renter occupiedHouse owners and renters - Other race residents 291 22.0% Owner occupied1,032 78.0% Renter occupiedHouse owners and renters - Two or more races residents 363 50.1% Owner occupied362 49.9% Renter occupiedHouse owners and renters - White alone residents 2,998 61.3% Owner occupied1,896 38.7% Renter occupiedHouse owners and renters - Hispanic or Latino residents 441 22.2% Owner occupied1,547 77.8% Renter occupied
Language usage in Amsterdam
English speakers - Total 80.0% of residents of Amsterdam speak English at home.
16.6% of residents speak Spanish at home 1,704 60.6% Speak English very well1,108 39.4% Speak English less than very well3.2% of residents speak other language at home 152 28.5% Speak English very well382 71.5% Speak English less than very well
English speakers - Born in the United States 80.4% of residents of Amsterdam speak English at home.
16.7% of residents speak Spanish at home 195 72.2% Speak English very well75 27.8% Speak English less than very well1.7% of residents speak other language at home 13 48.1% Speak English very well14 51.9% Speak English less than very well
English speakers - Native, born elsewhere 15.8% of residents of Amsterdam speak English at home.
78.3% of residents speak Spanish at home 541 45.8% Speak English very well641 54.2% Speak English less than very well2.9% of residents speak other language at home 7 15.9% Speak English very well37 84.1% Speak English less than very well
English speakers - Foreign-born 30.7% of residents of Amsterdam speak English at home.
38.0% of residents speak Spanish at home 118 34.3% Speak English very well226 65.7% Speak English less than very well30.6% of residents speak other language at home 62 22.4% Speak English very well215 77.6% Speak English less than very well
White (Caucasian) - Speak only English Native:
95.6% (9,945)Foreign-born:
50.1% (104)
White (Caucasian) - Speak another language Native:
5.0% (523)Foreign-born:
54.1% (112)
Black or African American - Speak only English Native:
98.3% (944)Foreign-born:
94.9% (66)
Black or African American - Speak another language Native:
2.1% (21)Foreign-born:
2.8% (2)
American Indian / Alaska Native - Speak another language Native:
100.0% (241)Foreign-born:
100.0% (108)
Asian - Speak only English Native:
26.1% (23)Foreign-born:
36.5% (79)
Asian - Speak another language Native:
73.6% (66)Foreign-born:
61.3% (133)
Other race - Speak another language Native:
61.4% (1,681)Foreign-born:
99.8% (226)
Two or more races - Speak only English Native:
80.4% (1,572)Foreign-born:
18.9% (22)
Two or more races - Speak another language Native:
18.6% (363)Foreign-born:
81.3% (97)
White alone - Speak only English Native:
97.1% (9,392)Foreign-born:
43.8% (108)
White alone - Speak another language Native:
3.0% (291)Foreign-born:
56.4% (139)
Hispanic or Latino - Speak only English Native:
54.0% (2,666)Foreign-born:
2.4% (8)
Hispanic or Latino - Speak another language Native:
47.0% (2,318)Foreign-born:
97.4% (346)
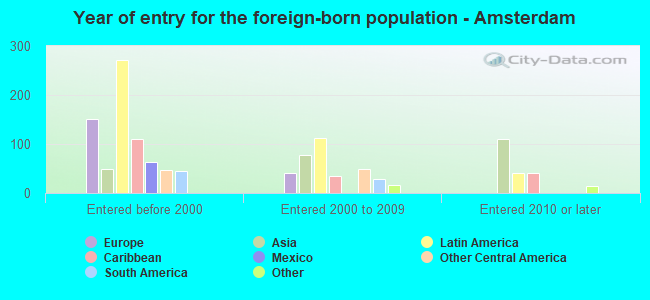
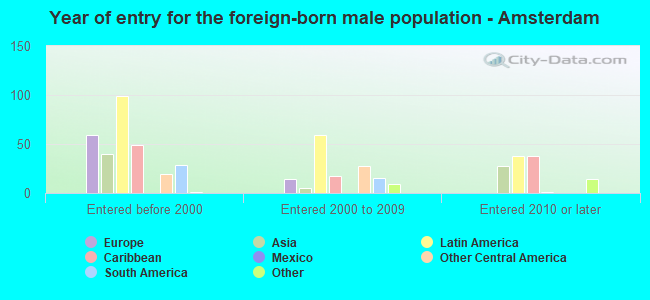
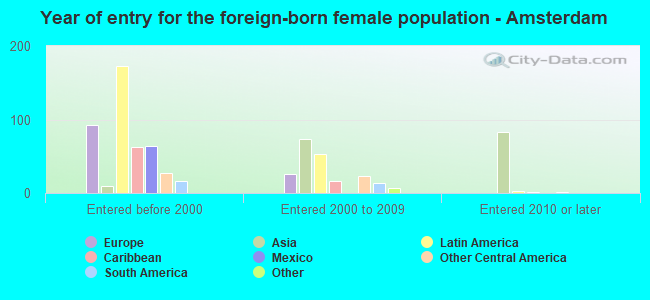
Foreign-born residents in Amsterdam 908 residents are foreign born (2.4% Latin America , 1.3% Asia , 1.2% Europe ).
This city:
5.1%New York:
22.6%
Marital status for residents in Amsterdam Marital status - White (Caucasian) population 15 years and over
Males 39.2% Never married35.3% Now married1.6% Separated4.2% Widowed19.8% DivorcedFemales 36.5% Never married35.5% Now married1.5% Separated12.8% Widowed13.7% DivorcedWomen who gave birth in the past 12 months Now married:
77.8% (38)Unmarried:
22.2% (11)
Women who did not give birth in the past 12 months Now married:
26.4% (541)Unmarried:
73.6% (1,508)
Marital status - Black or African American population 15 years and over
Males 64.5% Never married31.7% Now married0.0% Separated0.4% Widowed3.5% DivorcedFemales 47.3% Never married13.6% Now married17.2% Separated17.2% Widowed4.6% DivorcedWomen who gave birth in the past 12 months Now married:
100.0% (18)Unmarried:
0.0% (0)
Women who did not give birth in the past 12 months Now married:
29.2% (76)Unmarried:
70.8% (183)
Marital status - American Indian / Alaska Native population 15 years and over
Males 86.5% Never married13.5% Now married0.0% Separated0.0% Widowed0.0% DivorcedFemales 60.2% Never married0.0% Now married0.0% Separated0.0% Widowed39.8% DivorcedWomen who did not give birth in the past 12 months Now married:
0.0% (0)Unmarried:
100.0% (152)
Marital status - Asian population 15 years and over
Males 21.0% Never married79.0% Now married0.0% Separated0.0% Widowed0.0% DivorcedFemales 22.5% Never married35.9% Now married34.5% Separated6.3% Widowed0.7% DivorcedWomen who gave birth in the past 12 months Now married:
100.0% (39)Unmarried:
0.0% (0)
Women who did not give birth in the past 12 months Now married:
74.2% (49)Unmarried:
25.8% (17)
Marital status - Other race population 15 years and over
Males 53.0% Never married34.1% Now married3.4% Separated1.0% Widowed8.4% DivorcedFemales 55.1% Never married18.5% Now married13.0% Separated3.1% Widowed10.2% DivorcedWomen who gave birth in the past 12 months Now married:
0.0% (0)Unmarried:
100.0% (49)
Women who did not give birth in the past 12 months Now married:
25.5% (218)Unmarried:
74.5% (638)
Marital status - Two or more races population 15 years and over
Males 65.6% Never married32.3% Now married0.0% Separated0.0% Widowed2.1% DivorcedFemales 44.8% Never married25.9% Now married1.0% Separated12.3% Widowed16.0% DivorcedWomen who did not give birth in the past 12 months Now married:
24.3% (146)Unmarried:
75.7% (457)
Marital status - White alone, not Hispanic / Latino population 15 years and over
Males 36.8% Never married38.1% Now married1.8% Separated4.6% Widowed18.7% DivorcedFemales 35.3% Never married36.3% Now married1.5% Separated13.0% Widowed13.9% DivorcedWomen who gave birth in the past 12 months Now married:
77.8% (40)Unmarried:
22.2% (11)
Women who did not give birth in the past 12 months Now married:
27.0% (520)Unmarried:
73.0% (1,409)
Marital status - Hispanic or Latino population 15 years and over
Males 58.4% Never married27.2% Now married1.6% Separated0.7% Widowed12.1% DivorcedFemales 52.3% Never married19.8% Now married7.3% Separated6.3% Widowed14.3% DivorcedWomen who gave birth in the past 12 months Now married:
0.0% (0)Unmarried:
100.0% (43)
Women who did not give birth in the past 12 months Now married:
23.2% (338)Unmarried:
76.8% (1,122)
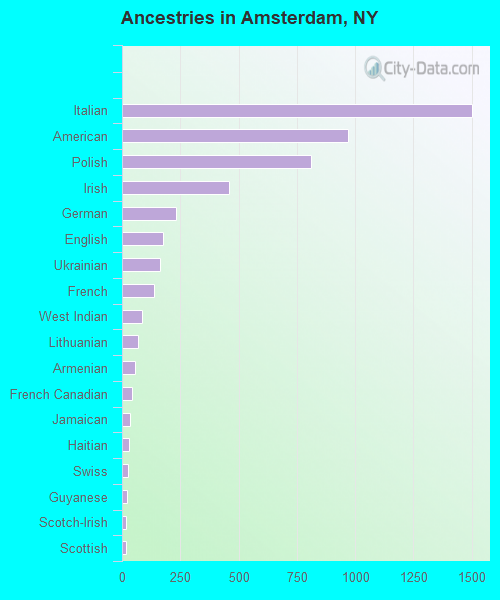
Ancestries in Amsterdam
1,500 16.2% Italian972 10.5% American810 8.8% Polish458 4.9% Irish230 2.5% German175 1.9% English161 1.7% Ukrainian137 1.5% French86 0.9% West Indian67 0.7% Lithuanian56 0.6% Armenian43 0.5% French Canadian33 0.4% Jamaican32 0.3% Haitian26 0.3% Swiss21 0.2% Guyanese18 0.2% Scotch-Irish17 0.2% Scottish12 0.1% Portuguese11 0.1% African9 0.10% Dutch9 0.10% Nigerian7 0.08% Greek
Geographical mobility in Amsterdam Same house 1 year ago 9,665 89.0% White (Caucasian)748 66.8% Black or African American363 100.0% American Indian / Alaska Native279 87.2% Asian5 89.7% Native Hawaiian / Pacific Islander2,392 78.7% Other race1,936 81.2% Two or more races9,048 89.3% White alone, not Hispanic / Latino4,818 82.4% Hispanic or LatinoMoved within same county 598 5.5% White / Caucasian370 33.1% Black or African American1 0.3% Asian256 8.4% Other race372 15.6% Two or more races529 5.2% White alone, not Hispanic / Latino558 9.5% Hispanic or LatinoMoved within same state 431 4.0% White / Caucasian15 1.3% Black or African American44 13.6% Asian49 1.6% Other race42 1.8% Two or more races381 3.8% White alone, not Hispanic / Latino140 2.4% Hispanic or LatinoMoved from different state 153 1.4% White / Caucasian63 2.1% Other race160 1.6% White alone, not Hispanic / Latino52 0.9% Hispanic or LatinoMoved from abroad 8 0.1% White357 11.7% Other race32 1.4% Two or more races9 0.1% White alone, not Hispanic / Latino331 5.7% Hispanic or Latino
Children Nativity (place of birth) in Amsterdam
Children under 6 years - Living with two parents Both parents native 432 100.0% Native0 0.0% Foreign-bornBoth parents foreign-born 25 90.9% Native3 9.1% Foreign-bornOne native, one foreign-born parent 87 100.0% NativeChildren under 6 years - Living with one parent Native parent 663 100.0% NativeForeign-born parent 7 100.0% NativeChildren 6 to 17 years - Living with two parents Both parents native 681 100.0% NativeBoth parents foreign-born 40 100.0% NativeOne native, one foreign-born parent 111 100.0% NativeChildren 6 to 17 years - Living with one parent Native parent 1,919 100.0% NativeForeign-born parent 176 50.4% Native174 49.6% Foreign-born
Grandparents responsible for own grandchildren in Amsterdam
Grandparents (30 to 59 years) White / Caucasian 73 77.4% Responsible for grandchildren21 22.6% Not responsible for grandchildrenOther race 16 100.0% Not responsible for grandchildrenTwo or more races 14 100.0% Responsible for grandchildrenWhite alone, not Hispanic / Latino 78 100.0% Responsible for grandchildrenHispanic or Latino 14 23.9% Responsible for grandchildren43 76.1% Not responsible for grandchildren
Grandparents (60 years and over) White / Caucasian 19 100.0% Not responsible for grandchildrenTwo or more races 5 100.0% Not responsible for grandchildrenWhite alone, not Hispanic / Latino 21 100.0% Not responsible for grandchildren