Races in Anderson-Bedias, Texas (TX) Detailed Stats
Ancestries, Foreign-born residents, place of birth
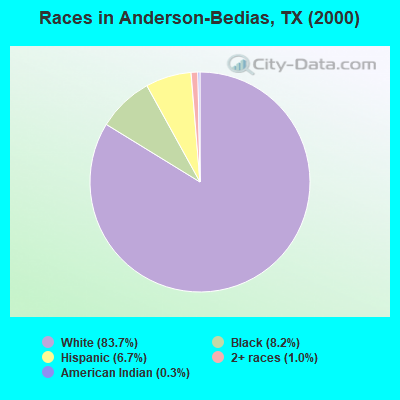
Race distribution in Anderson-Bedias

- 6,28883.7%White alone
- 6188.2%Black alone
- 5026.7%Hispanic
- 721.0%Two or more races
- 210.3%American Indian alone
- 60.08%Asian alone
- 20.03%Other race alone
- 10.01%Native Hawaiian and Other
Pacific Islander alone
2000
2022
-
- 10,933,31352.4%White alone
- 6,669,66632.0%Hispanic
- 2,364,25511.3%Black alone
- 554,4452.7%Asian alone
- 230,5671.1%Two or more races
- 68,8590.3%American Indian alone
- 19,9580.10%Other race alone
- 10,7570.05%Native Hawaiian and Other
Pacific Islander alone

-
- 12,070,64240.2%Hispanic
- 11,683,43038.9%White alone
- 3,508,70611.7%Black alone
- 1,608,1735.4%Asian alone
- 956,5603.2%Two or more races
- 125,7630.4%Other race alone
- 47,0230.2%American Indian alone
- 29,2750.10%Native Hawaiian and Other
Pacific Islander alone

Income and house value in Anderson-Bedias
- Median household income in 2022
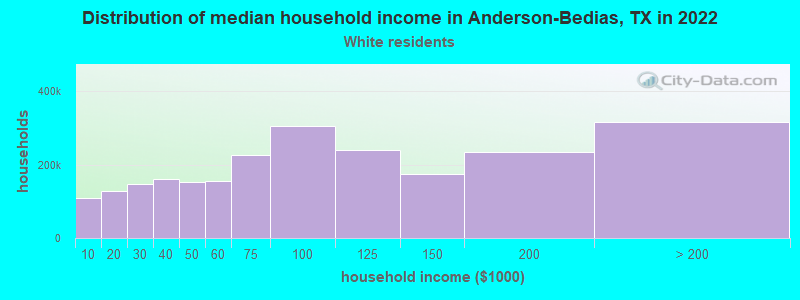
- $65,161White non-Hispanic householders
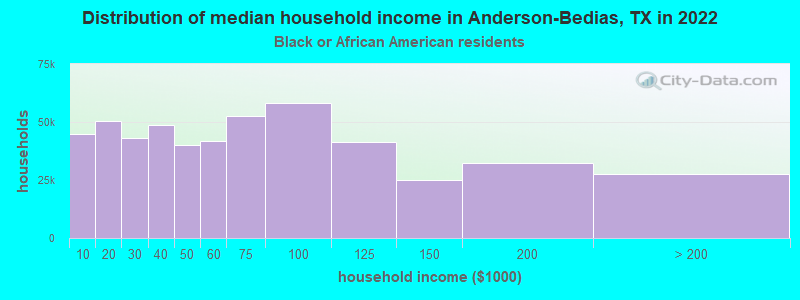
- $50,310Black householders
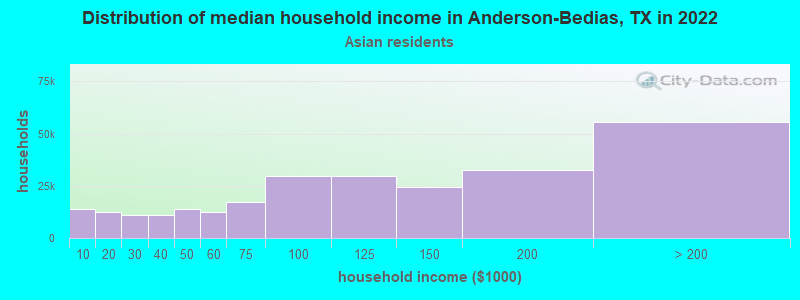
- $90,782Asian householders
- $38,534Some other race householders
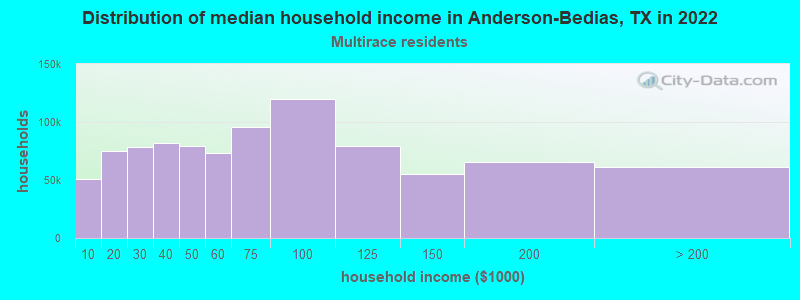
- $55,416Two or more races householders
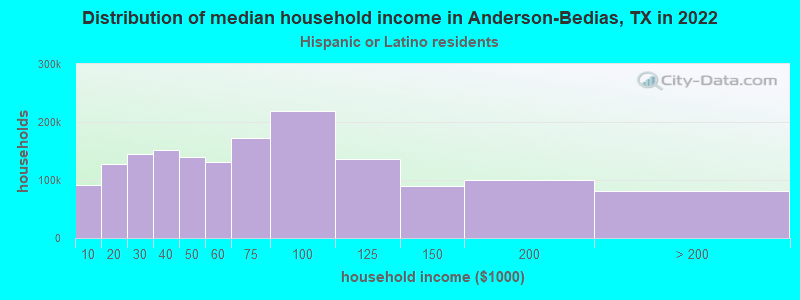
- $57,478Hispanic or Latino race householders
- Median 2022 house value
- $228,667White Non-Hispanic householders
- $186,465Black or African American householders
- $96,892Asian householders
- $75,361Some other race householders
- $322,976Two or more races householders
- $187,757Hispanic or Latino householders
Household income for White non-Hispanic householders
Household income for Black householders
Household income for Asian householders
Household income for Two or more races householders
Household income for Hispanic or Latino race householders
Zip code: 77831