Races in Anderson, Indiana (IN) Detailed Stats
Data:
Races - White alone (%)
Races - White alone (% change since 2000)
Races - Black alone (%)
Races - Black alone (% change since 2000)
Races - American Indian alone (%)
Races - American Indian alone (% change since 2000)
Races - Asian alone (%)
Races - Asian alone (% change since 2000)
Races - Hispanic (%)
Races - Hispanic (% change since 2000)
Races - Native Hawaiian and Other Pacific Islander alone (%)
Races - Native Hawaiian and Other Pacific Islander alone (% change since 2000)
Races - Two or more races(%)
Races - Two or more races(% change since 2000)
Races - Other race alone (%)
Races - Other race alone (% change since 2000)
Racial diversity
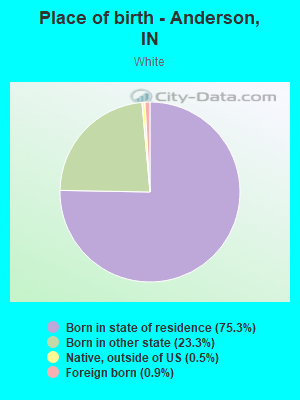
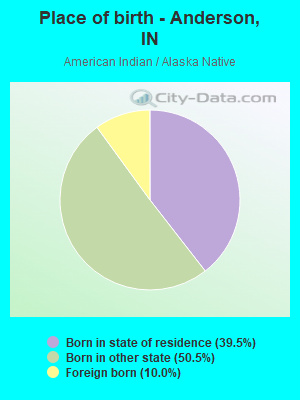
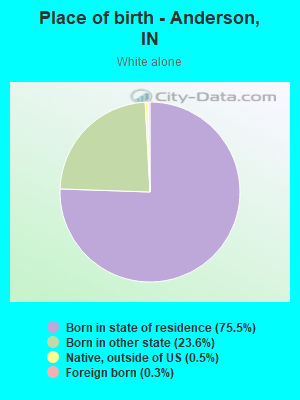
Place of birth - Born in state of residence (%)
Place of birth - Born in state of residence (%) - White
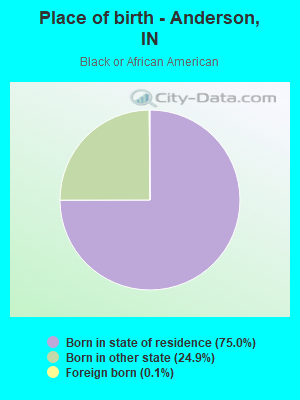
Place of birth - Born in state of residence (%) - Black or African American
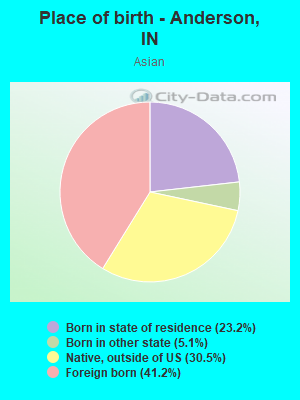
Place of birth - Born in state of residence (%) - Asian
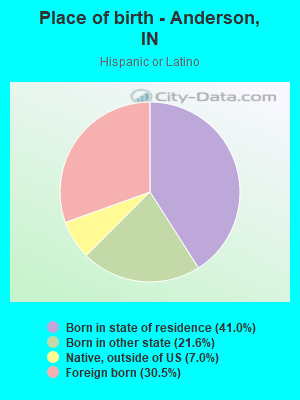
Place of birth - Born in state of residence (%) - Hispanic or Latino
Place of birth - Born in state of residence (%) - American Indian and Alaska Native
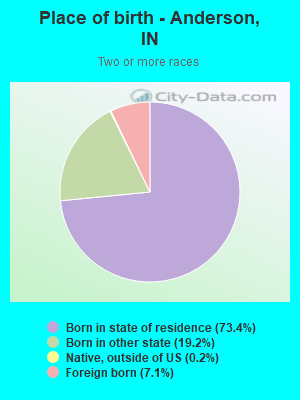
Place of birth - Born in state of residence (%) - Multirace
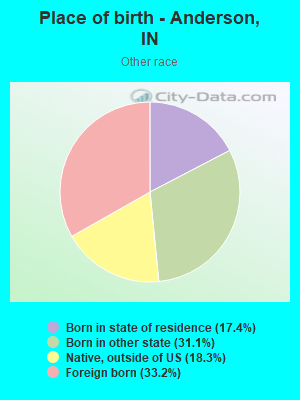
Place of birth - Born in state of residence (%) - Other Race
Place of birth - Born in other state (%)
Place of birth - Born in other state (%) - White
Place of birth - Born in other state (%) - Black or African American
Place of birth - Born in other state (%) - Asian
Place of birth - Born in other state (%) - Hispanic or Latino
Place of birth - Born in other state (%) - American Indian and Alaska Native
Place of birth - Born in other state (%) - Multirace
Place of birth - Born in other state (%) - Other Race
Place of birth - Native, outside of US (%)
Place of birth - Native, outside of US (%) - White
Place of birth - Native, outside of US (%) - Black or African American
Place of birth - Native, outside of US (%) - Asian
Place of birth - Native, outside of US (%) - Hispanic or Latino
Place of birth - Native, outside of US (%) - American Indian and Alaska Native
Place of birth - Native, outside of US (%) - Multirace
Place of birth - Native, outside of US (%) - Other Race
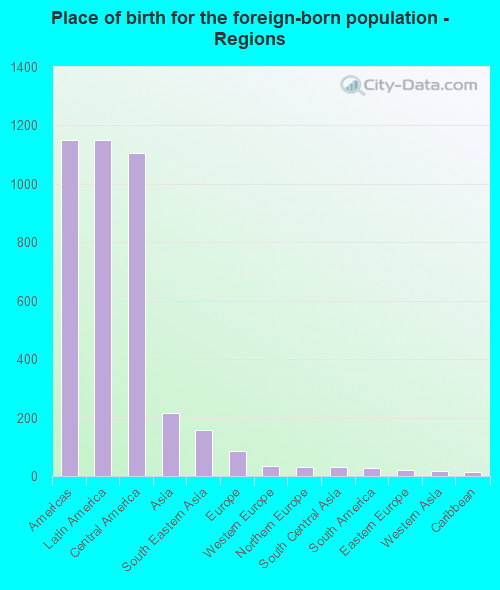
Place of birth - Foreign born (%)
Place of birth - Foreign born (%) - White
Place of birth - Foreign born (%) - Black or African American
Place of birth - Foreign born (%) - Asian
Place of birth - Foreign born (%) - Hispanic or Latino
Place of birth - Foreign born (%) - American Indian and Alaska Native
Place of birth - Foreign born (%) - Multirace
Place of birth - Foreign born (%) - Other Race
Residents speaking English at home (%)
Residents speaking English at home - Born in the United States (%)
Residents speaking English at home - Native, born elsewhere (%)
Residents speaking English at home - Foreign born (%)
Residents speaking Spanish at home (%)
Residents speaking Spanish at home - Born in the United States (%)
Residents speaking Spanish at home - Native, born elsewhere (%)
Residents speaking Spanish at home - Foreign born (%)
Residents speaking other language at home (%)
Residents speaking other language at home - Born in the United States (%)
Residents speaking other language at home - Native, born elsewhere (%)
Residents speaking other language at home - Foreign born (%)
Marital status - Never married (%)
Marital status - Now married (%)
Marital status - Separated (%)
Marital status - Widowed (%)
Marital status - Divorced (%)
Ancestries Reported - Arab (%)
Ancestries Reported - Czech (%)
Ancestries Reported - Danish (%)
Ancestries Reported - Dutch (%)
Ancestries Reported - English (%)
Ancestries Reported - French (%)
Ancestries Reported - French Canadian (%)
Ancestries Reported - German (%)
Ancestries Reported - Greek (%)
Ancestries Reported - Hungarian (%)
Ancestries Reported - Irish (%)
Ancestries Reported - Italian (%)
Ancestries Reported - Lithuanian (%)
Ancestries Reported - Norwegian (%)
Ancestries Reported - Polish (%)
Ancestries Reported - Portuguese (%)
Ancestries Reported - Russian (%)
Ancestries Reported - Scotch-Irish (%)
Ancestries Reported - Scottish (%)
Ancestries Reported - Slovak (%)
Ancestries Reported - Subsaharan African (%)
Ancestries Reported - Swedish (%)
Ancestries Reported - Swiss (%)
Ancestries Reported - Ukrainian (%)
Ancestries Reported - United States (%)
Ancestries Reported - Welsh (%)
Ancestries Reported - West Indian (%)
Ancestries Reported - Other (%)
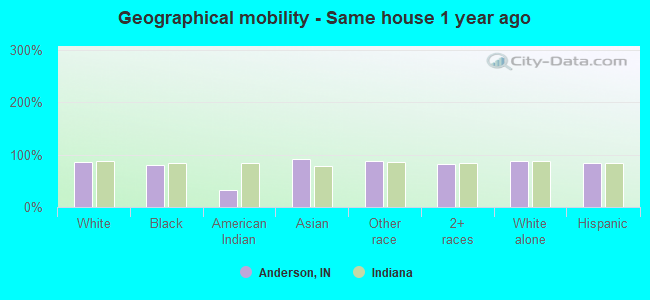
Geographical mobility - Same house 1 year ago (%)
Geographical mobility - Same house 1 year ago (%) - White
Geographical mobility - Same house 1 year ago (%) - Black or African American
Geographical mobility - Same house 1 year ago (%) - Asian
Geographical mobility - Same house 1 year ago (%) - Hispanic or Latino
Geographical mobility - Same house 1 year ago (%) - American Indian and Alaska Native
Geographical mobility - Same house 1 year ago (%) - Multirace
Geographical mobility - Same house 1 year ago (%) - Other Race
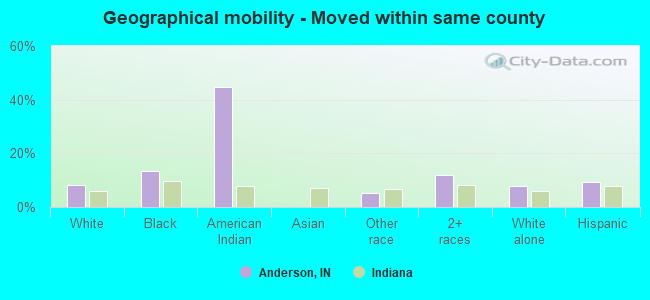
Geographical mobility - Moved within same county (%)
Geographical mobility - Moved within same county (%) - White
Geographical mobility - Moved within same county (%) - Black or African American
Geographical mobility - Moved within same county (%) - Asian
Geographical mobility - Moved within same county (%) - Hispanic or Latino
Geographical mobility - Moved within same county (%) - American Indian and Alaska Native
Geographical mobility - Moved within same county (%) - Multirace
Geographical mobility - Moved within same county (%) - Other Race
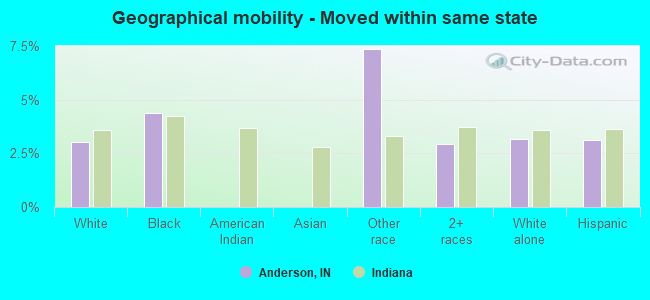
Geographical mobility - Moved from different county within same state (%)
Geographical mobility - Moved from different county within same state (%) - White
Geographical mobility - Moved from different county within same state (%) - Black or African American
Geographical mobility - Moved from different county within same state (%) - Asian
Geographical mobility - Moved from different county within same state (%) - Hispanic or Latino
Geographical mobility - Moved from different county within same state (%) - American Indian and Alaska Native
Geographical mobility - Moved from different county within same state (%) - Multirace
Geographical mobility - Moved from different county within same state (%) - Other Race
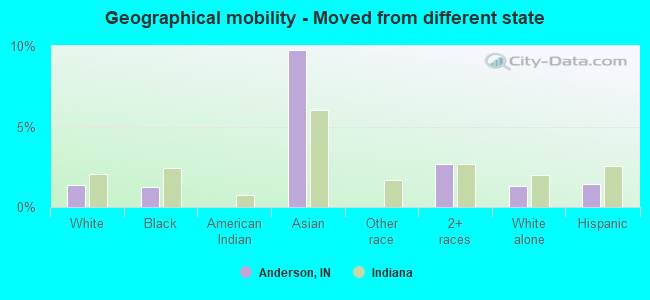
Geographical mobility - Moved from different state (%)
Geographical mobility - Moved from different state (%) - White
Geographical mobility - Moved from different state (%) - Black or African American
Geographical mobility - Moved from different state (%) - Asian
Geographical mobility - Moved from different state (%) - Hispanic or Latino
Geographical mobility - Moved from different state (%) - American Indian and Alaska Native
Geographical mobility - Moved from different state (%) - Multirace
Geographical mobility - Moved from different state (%) - Other Race
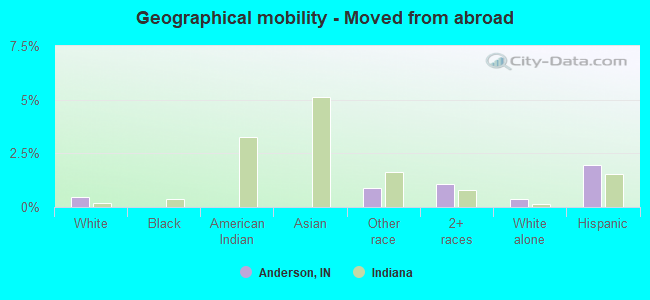
Geographical mobility - Moved from abroad (%)
Geographical mobility - Moved from abroad (%) - White
Geographical mobility - Moved from abroad (%) - Black or African American
Geographical mobility - Moved from abroad (%) - Asian
Geographical mobility - Moved from abroad (%) - Hispanic or Latino
Geographical mobility - Moved from abroad (%) - American Indian and Alaska Native
Geographical mobility - Moved from abroad (%) - Multirace
Geographical mobility - Moved from abroad (%) - Other Race
Place of birth for the foreign-born population - Ireland (%)
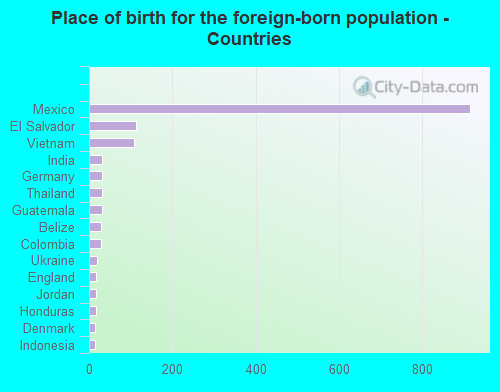
Place of birth for the foreign-born population - Denmark (%)
Place of birth for the foreign-born population - Norway (%)
Place of birth for the foreign-born population - Sweden (%)
Place of birth for the foreign-born population - United Kingdom (%)
Place of birth for the foreign-born population - England (%)
Place of birth for the foreign-born population - Scotland (%)
Place of birth for the foreign-born population - Other Northern Europe (%)
Place of birth for the foreign-born population - Austria (%)
Place of birth for the foreign-born population - Belgium (%)
Place of birth for the foreign-born population - France (%)
Place of birth for the foreign-born population - Germany (%)
Place of birth for the foreign-born population - Netherlands (%)
Place of birth for the foreign-born population - Switzerland (%)
Place of birth for the foreign-born population - Other Western Europe (%)
Place of birth for the foreign-born population - Greece (%)
Place of birth for the foreign-born population - Italy (%)
Place of birth for the foreign-born population - Portugal (%)
Place of birth for the foreign-born population - Spain (%)
Place of birth for the foreign-born population - Other Southern Europe (%)
Place of birth for the foreign-born population - Albania (%)
Place of birth for the foreign-born population - Belarus (%)
Place of birth for the foreign-born population - Bosnia and Herzegovina (%)
Place of birth for the foreign-born population - Bulgaria (%)
Place of birth for the foreign-born population - Croatia (%)
Place of birth for the foreign-born population - Czechoslovakia (%)
Place of birth for the foreign-born population - Hungary (%)
Place of birth for the foreign-born population - Latvia (%)
Place of birth for the foreign-born population - Lithuania (%)
Place of birth for the foreign-born population - North Macedonia (Macedonia) (%)
Place of birth for the foreign-born population - Moldova (%)
Place of birth for the foreign-born population - Poland (%)
Place of birth for the foreign-born population - Romania (%)
Place of birth for the foreign-born population - Russia (%)
Place of birth for the foreign-born population - Serbia (%)
Place of birth for the foreign-born population - Ukraine (%)
Place of birth for the foreign-born population - Other Eastern Europe (%)
Place of birth for the foreign-born population - China (%)
Place of birth for the foreign-born population - Hong Kong (%)
Place of birth for the foreign-born population - Taiwan (%)
Place of birth for the foreign-born population - Japan (%)
Place of birth for the foreign-born population - Korea (%)
Place of birth for the foreign-born population - Other Eastern Asia (%)
Place of birth for the foreign-born population - Afghanistan (%)
Place of birth for the foreign-born population - Bangladesh (%)
Place of birth for the foreign-born population - India (%)
Place of birth for the foreign-born population - Iran (%)
Place of birth for the foreign-born population - Kazakhstan (%)
Place of birth for the foreign-born population - Nepal (%)
Place of birth for the foreign-born population - Pakistan (%)
Place of birth for the foreign-born population - Sri Lanka (%)
Place of birth for the foreign-born population - Uzbekistan (%)
Place of birth for the foreign-born population - Other South Central Asia (%)
Place of birth for the foreign-born population - Burma (%)
Place of birth for the foreign-born population - Cambodia (%)
Place of birth for the foreign-born population - Indonesia (%)
Place of birth for the foreign-born population - Laos (%)
Place of birth for the foreign-born population - Malaysia (%)
Place of birth for the foreign-born population - Philippines (%)
Place of birth for the foreign-born population - Singapore (%)
Place of birth for the foreign-born population - Thailand (%)
Place of birth for the foreign-born population - Vietnam (%)
Place of birth for the foreign-born population - Other South Eastern Asia (%)
Place of birth for the foreign-born population - Armenia (%)
Place of birth for the foreign-born population - Iraq (%)
Place of birth for the foreign-born population - Israel (%)
Place of birth for the foreign-born population - Jordan (%)
Place of birth for the foreign-born population - Kuwait (%)
Place of birth for the foreign-born population - Lebanon (%)
Place of birth for the foreign-born population - Saudi Arabia (%)
Place of birth for the foreign-born population - Syria (%)
Place of birth for the foreign-born population - Turkey (%)
Place of birth for the foreign-born population - Yemen (%)
Place of birth for the foreign-born population - Other Western Asia (%)
Place of birth for the foreign-born population - Eritrea (%)
Place of birth for the foreign-born population - Ethiopia (%)
Place of birth for the foreign-born population - Kenya (%)
Place of birth for the foreign-born population - Somalia (%)
Place of birth for the foreign-born population - Uganda (%)
Place of birth for the foreign-born population - Zimbabwe (%)
Place of birth for the foreign-born population - Other Eastern Africa (%)
Place of birth for the foreign-born population - Cameroon (%)
Place of birth for the foreign-born population - Congo (%)
Place of birth for the foreign-born population - Democratic Republic of Congo (Zaire) (%)
Place of birth for the foreign-born population - Other Middle Africa (%)
Place of birth for the foreign-born population - Egypt (%)
Place of birth for the foreign-born population - Morocco (%)
Place of birth for the foreign-born population - Sudan (%)
Place of birth for the foreign-born population - Other Northern Africa (%)
Place of birth for the foreign-born population - South Africa (%)
Place of birth for the foreign-born population - Other Southern Africa (%)
Place of birth for the foreign-born population - Cabo Verde (%)
Place of birth for the foreign-born population - Ghana (%)
Place of birth for the foreign-born population - Liberia (%)
Place of birth for the foreign-born population - Nigeria (%)
Place of birth for the foreign-born population - Senegal (%)
Place of birth for the foreign-born population - Sierra Leone (%)
Place of birth for the foreign-born population - Other Western Africa (%)
Place of birth for the foreign-born population - Australia (%)
Place of birth for the foreign-born population - New Zealand (%)
Place of birth for the foreign-born population - Fiji (%)
Place of birth for the foreign-born population - Micronesia (%)
Place of birth for the foreign-born population - Bahamas (%)
Place of birth for the foreign-born population - Barbados (%)
Place of birth for the foreign-born population - Cuba (%)
Place of birth for the foreign-born population - Dominica (%)
Place of birth for the foreign-born population - Dominican Republic (%)
Place of birth for the foreign-born population - Grenada (%)
Place of birth for the foreign-born population - Haiti (%)
Place of birth for the foreign-born population - Jamaica (%)
Place of birth for the foreign-born population - St. Vincent and the Grenadines (%)
Place of birth for the foreign-born population - Trinidad and Tobago (%)
Place of birth for the foreign-born population - West Indies (%)
Place of birth for the foreign-born population - Other Caribbean (%)
Place of birth for the foreign-born population - Belize (%)
Place of birth for the foreign-born population - Costa Rica (%)
Place of birth for the foreign-born population - El Salvador (%)
Place of birth for the foreign-born population - Guatemala (%)
Place of birth for the foreign-born population - Honduras (%)
Place of birth for the foreign-born population - Mexico (%)
Place of birth for the foreign-born population - Nicaragua (%)
Place of birth for the foreign-born population - Panama (%)
Place of birth for the foreign-born population - Other Central America (%)
Place of birth for the foreign-born population - Argentina (%)
Place of birth for the foreign-born population - Bolivia (%)
Place of birth for the foreign-born population - Brazil (%)
Place of birth for the foreign-born population - Chile (%)
Place of birth for the foreign-born population - Colombia (%)
Place of birth for the foreign-born population - Ecuador (%)
Place of birth for the foreign-born population - Guyana (%)
Place of birth for the foreign-born population - Peru (%)
Place of birth for the foreign-born population - Uruguay (%)
Place of birth for the foreign-born population - Venezuela (%)
Place of birth for the foreign-born population - Other South America (%)
Place of birth for the foreign-born population - Canada (%)
Place of birth for the foreign-born population - Other Northern America (%)
Place of birth for the foreign-born population - Other (%)
Anderson, can it be a good place for a family with small children (5 replies)Old or Historic Homes in Anderson (17 replies)Anderson, IN Parking in Residential areas. Help. (12 replies)Ranking Indy's mid sized satellite cities: Terre Haute, Lafayette, Kokomo, Marion, Muncie, Anderson, Richmond (49 replies)Anderson Indiana- Population, Jobs, Housing, Economy etc (21 replies)Is Anderson Rebounding Yet? (28 replies)
Latest news about races in Anderson, IN collected exclusively by city-data.com from local newspapers, TV, and radio stations
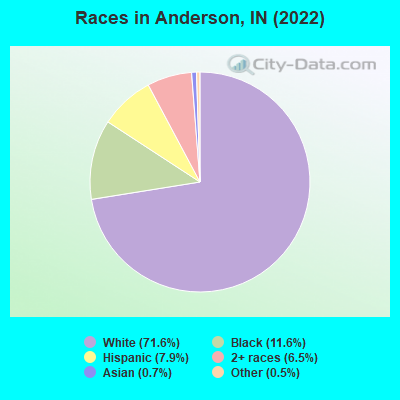
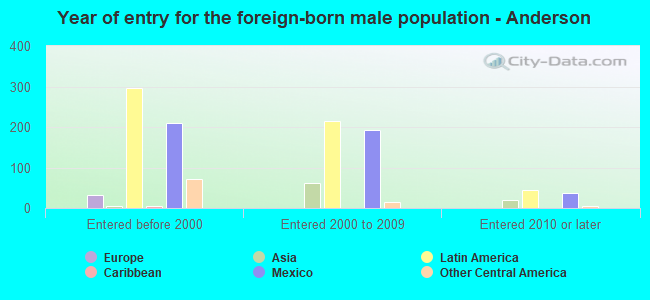
According to 2022 data, the most numerous races in Anderson, IN are White alone (39,732 residents), Black alone (6,454 residents), and Hispanic (4,384 residents). 93.9% of Anderson residents speak English at home. 2.6% of Anderson, IN residents are foreign-born (1.9% born in Latin America, 0.4% born in Asia), which is 129.2% less than the foreign-born rate of 6.0% across the entire state of Indiana.
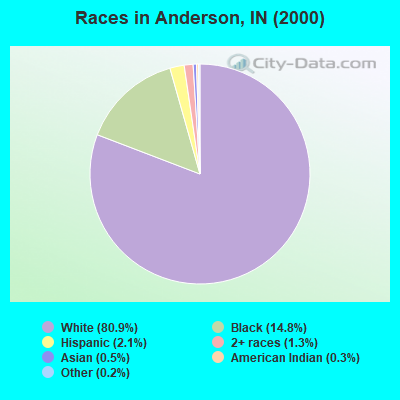
Race distribution in Anderson
2000 2022
5,219,373 85.8% White alone 505,462 8.3% Black alone 214,536 3.5% Hispanic 61,115 1.0% Two or more races 58,424 1.0% Asian alone 13,654 0.2% American Indian alone 6,348 0.1% Other race alone 1,573 0.03% Native Hawaiian and Other
5,192,455 76.0% White alone 628,054 9.2% Black alone 534,528 7.8% Hispanic 263,242 3.9% Two or more races 172,880 2.5% Asian alone 33,467 0.5% Other race alone 5,866 0.09% American Indian alone 2,545 0.04% Native Hawaiian and Other
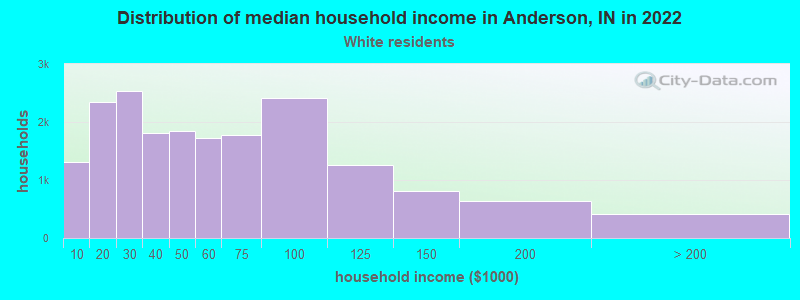
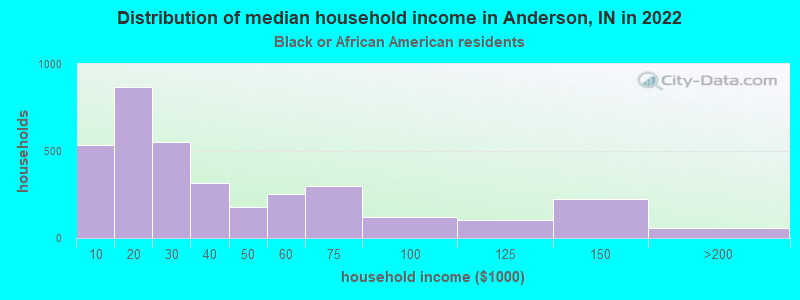
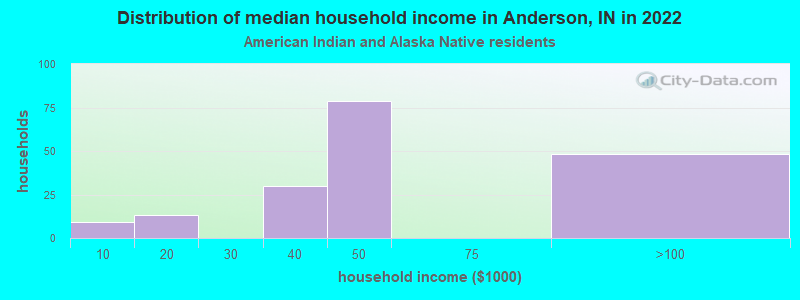
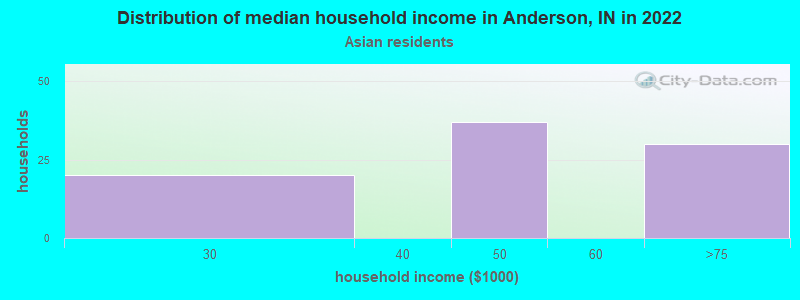
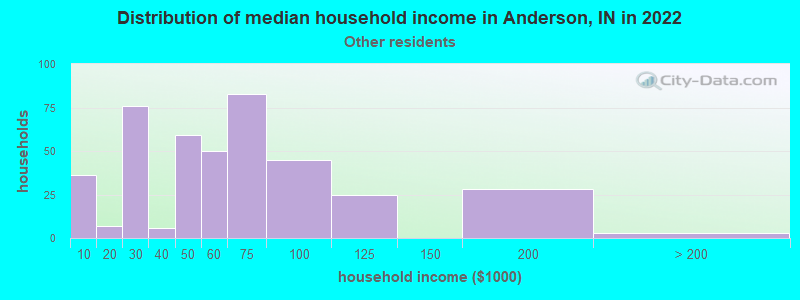
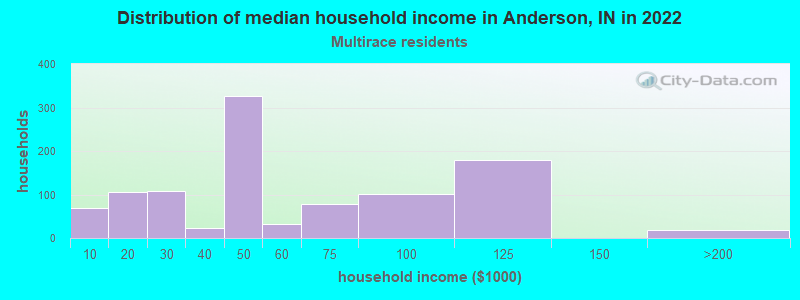
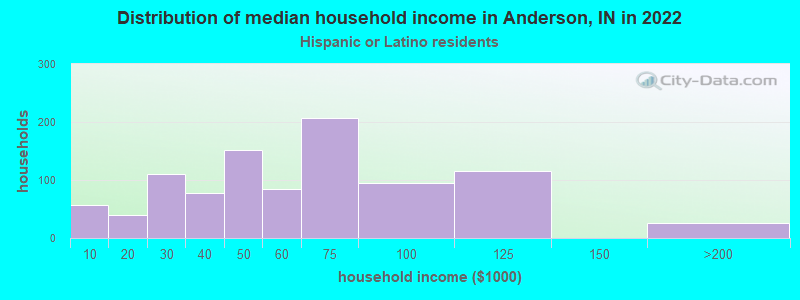
Income and house value in Anderson Median household income in 2022 $48,217 White non-Hispanic householders$37,652 Black householders$40,451 American Indian and Alaska Native householders$51,794 Asian householders$53,337 Some other race householders$44,036 Two or more races householders$52,952 Hispanic or Latino race householdersMedian 2022 house value $122,591 White Non-Hispanic householders$111,120 Black or African American householders$330,494 American Indian or Alaska Native householders $355,227 Asian householders$116,497 Some other race householders$106,460 Two or more races householders$101,263 Hispanic or Latino householders
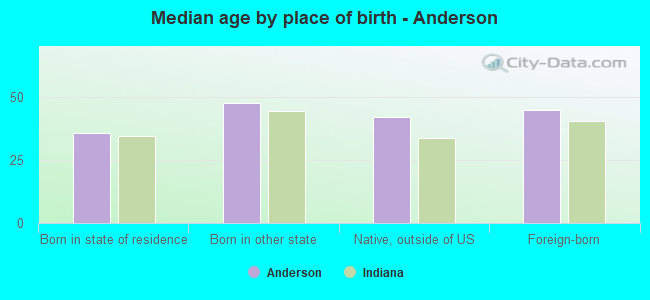
Median age by race in Anderson
43.0 Median age for White residents41.5 44.8 37.2 Median age for Black or African American residents32.3 51.9 76.3 Median age for American Indian / Alaska Native residents47.9 88.3 35.9 Median age for Asian residents30.9 37.0 -666,666,666.0 Median age for Native Hawaiian / Pacific Islander residents-666,666,666.0 -666,666,666.0 36.2 Median age for Other race residents37.9 25.8 18.5 Median age for Two or more races residents17.1 19.4 45.0 Median age for White alone residents42.8 46.1 21.6 Median age for Hispanic or Latino residents21.2 23.5
Owner/renter occupied households by race in Anderson
House owners and renters - White residents 11,682 61.7% Owner occupied7,243 38.3% Renter occupiedHouse owners and renters - Black or African American residents 1,030 38.8% Owner occupied1,626 61.2% Renter occupiedHouse owners and renters - American Indian / Alaska Native residents 76 43.9% Owner occupied97 56.1% Renter occupiedHouse owners and renters - Asian residents 39 42.3% Owner occupied54 57.7% Renter occupiedHouse owners and renters - Other race residents 394 89.0% Owner occupied49 11.0% Renter occupiedHouse owners and renters - Two or more races residents 598 57.9% Owner occupied435 42.1% Renter occupiedHouse owners and renters - White alone residents 11,583 62.4% Owner occupied6,991 37.6% Renter occupiedHouse owners and renters - Hispanic or Latino residents 646 58.9% Owner occupied450 41.1% Renter occupied
Language usage in Anderson
English speakers - Total 93.9% of residents of Anderson speak English at home.
5.5% of residents speak Spanish at home 1,380 48.3% Speak English very well1,480 51.7% Speak English less than very well0.8% of residents speak other language at home 332 82.4% Speak English very well71 17.6% Speak English less than very well
English speakers - Born in the United States 96.0% of residents of Anderson speak English at home.
3.7% of residents speak Spanish at home 385 82.3% Speak English very well83 17.7% Speak English less than very well0.4% of residents speak other language at home 28 57.1% Speak English very well21 42.9% Speak English less than very well
English speakers - Native, born elsewhere 42.2% of residents of Anderson speak English at home.
41.5% of residents speak Spanish at home 154 66.1% Speak English very well79 33.9% Speak English less than very well21.0% of residents speak other language at home 118 100.0% Speak English very well
English speakers - Foreign-born 5.7% of residents of Anderson speak English at home.
90.0% of residents speak Spanish at home 276 22.0% Speak English very well980 78.0% Speak English less than very well18.5% of residents speak other language at home 121 46.9% Speak English very well137 53.1% Speak English less than very well
White (Caucasian) - Speak only English Native:
97.8% (37,242)Foreign-born:
17.9% (66)
White (Caucasian) - Speak another language Native:
2.3% (859)Foreign-born:
78.6% (288)
Black or African American - Speak only English Native:
97.7% (7,485)Foreign-born:
68.2% (7)
American Indian / Alaska Native - Speak only English Native:
35.1% (99)Foreign-born:
81.2% (26)
Asian - Speak only English Native:
14.4% (32)Foreign-born:
12.5% (23)
Asian - Speak another language Native:
89.0% (195)Foreign-born:
87.4% (162)
Other race - Speak only English Native:
46.3% (437)Foreign-born:
11.0% (54)
Other race - Speak another language Native:
52.7% (498)Foreign-born:
88.8% (432)
Two or more races - Speak only English Native:
88.8% (3,437)Foreign-born:
3.6% (12)
Two or more races - Speak another language Native:
10.4% (401)Foreign-born:
95.7% (328)
White alone - Speak only English Native:
98.7% (36,671)Foreign-born:
59.0% (73)
White alone - Speak another language Native:
1.3% (465)Foreign-born:
38.6% (48)
Hispanic or Latino - Speak only English Native:
50.3% (1,246)Foreign-born:
8.1% (110)
Hispanic or Latino - Speak another language Native:
49.1% (1,216)Foreign-born:
91.7% (1,240)
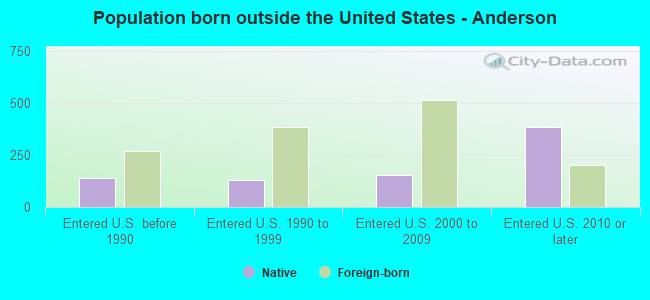
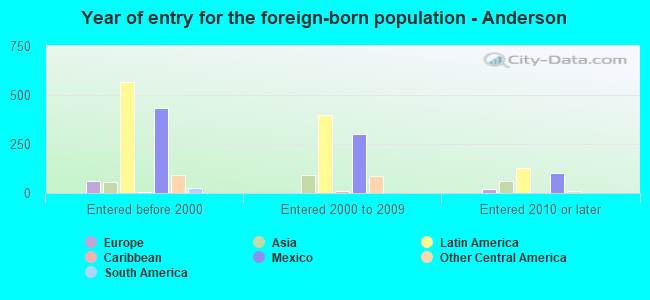
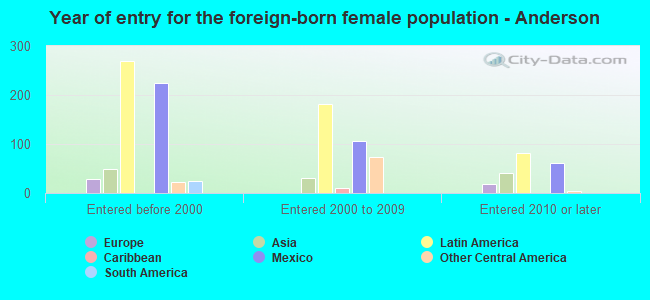
Foreign-born residents in Anderson 1,453 residents are foreign born (1.9% Latin America , 0.4% Asia ).
This city:
2.6%Indiana:
5.6%
Marital status for residents in Anderson Marital status - White (Caucasian) population 15 years and over
Males 31.9% Never married42.2% Now married2.1% Separated4.4% Widowed19.5% DivorcedFemales 27.2% Never married35.9% Now married2.6% Separated13.6% Widowed20.7% DivorcedWomen who gave birth in the past 12 months Now married:
45.2% (207)Unmarried:
54.8% (251)
Women who did not give birth in the past 12 months Now married:
37.5% (3,314)Unmarried:
62.5% (5,527)
Marital status - Black or African American population 15 years and over
Males 56.4% Never married29.3% Now married2.3% Separated2.1% Widowed9.8% DivorcedFemales 35.6% Never married27.8% Now married5.7% Separated11.1% Widowed19.9% DivorcedWomen who gave birth in the past 12 months Now married:
12.3% (7)Unmarried:
87.7% (50)
Women who did not give birth in the past 12 months Now married:
28.3% (547)Unmarried:
71.7% (1,386)
Marital status - American Indian / Alaska Native population 15 years and over
Males 7.9% Never married77.8% Now married0.0% Separated7.9% Widowed6.3% DivorcedFemales 59.8% Never married37.4% Now married0.0% Separated0.0% Widowed2.8% DivorcedWomen who did not give birth in the past 12 months Now married:
25.4% (35)Unmarried:
74.6% (104)
Marital status - Asian population 15 years and over
Males 22.7% Never married64.0% Now married0.0% Separated0.0% Widowed13.3% DivorcedFemales 58.1% Never married41.9% Now married0.0% Separated0.0% Widowed0.0% DivorcedWomen who did not give birth in the past 12 months Now married:
13.8% (23)Unmarried:
86.2% (143)
Marital status - Other race population 15 years and over
Males 30.9% Never married62.2% Now married0.0% Separated0.0% Widowed6.9% DivorcedFemales 22.2% Never married67.4% Now married0.0% Separated0.0% Widowed10.4% DivorcedWomen who gave birth in the past 12 months Now married:
78.0% (47)Unmarried:
22.0% (13)
Women who did not give birth in the past 12 months Now married:
61.7% (144)Unmarried:
38.3% (90)
Marital status - Two or more races population 15 years and over
Males 45.8% Never married35.5% Now married0.9% Separated2.0% Widowed15.8% DivorcedFemales 46.6% Never married35.5% Now married0.0% Separated3.3% Widowed14.6% DivorcedWomen who gave birth in the past 12 months Now married:
100.0% (11)Unmarried:
0.0% (0)
Women who did not give birth in the past 12 months Now married:
33.7% (336)Unmarried:
66.3% (663)
Marital status - White alone, not Hispanic / Latino population 15 years and over
Males 31.9% Never married41.5% Now married2.0% Separated4.6% Widowed19.9% DivorcedFemales 26.3% Never married35.9% Now married2.7% Separated14.0% Widowed21.1% DivorcedWomen who gave birth in the past 12 months Now married:
45.2% (207)Unmarried:
54.8% (251)
Women who did not give birth in the past 12 months Now married:
37.9% (3,143)Unmarried:
62.1% (5,151)
Marital status - Hispanic or Latino population 15 years and over
Males 34.4% Never married61.1% Now married1.2% Separated0.0% Widowed3.3% DivorcedFemales 48.4% Never married42.6% Now married0.0% Separated2.3% Widowed6.7% DivorcedWomen who gave birth in the past 12 months Now married:
100.0% (12)Unmarried:
0.0% (0)
Women who did not give birth in the past 12 months Now married:
38.0% (449)Unmarried:
62.0% (732)
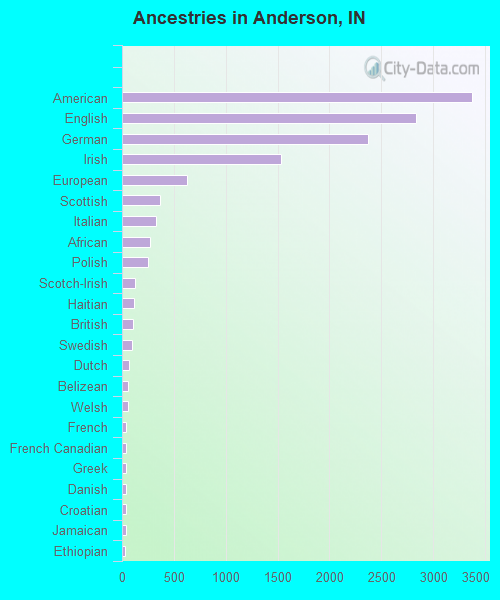
Ancestries in Anderson
3,370 11.8% American2,837 9.9% English2,374 8.3% German1,537 5.4% Irish623 2.2% European365 1.3% Scottish331 1.2% Italian273 1.0% African252 0.9% Polish121 0.4% Scotch-Irish115 0.4% Haitian107 0.4% British100 0.3% Swedish63 0.2% Dutch56 0.2% Belizean55 0.2% Welsh43 0.2% French40 0.1% French Canadian38 0.1% Greek37 0.1% Danish36 0.1% Croatian36 0.1% Jamaican32 0.1% Ethiopian28 0.10% Eastern European26 0.09% Northern European25 0.09% Romanian23 0.08% Scandinavian20 0.07% Norwegian20 0.07% Pennsylvania German19 0.07% Ukrainian10 0.03% Slovak9 0.03% Jordanian9 0.03% Lithuanian8 0.03% Czech8 0.03% Czechoslovakian5 0.02% Austrian4 0.01% Hungarian2 0.01% Moroccan
Geographical mobility in Anderson Same house 1 year ago 35,463 86.3% White (Caucasian)5,223 80.4% Black or African American118 32.5% American Indian / Alaska Native362 91.5% Asian1,339 86.8% Other race3,188 81.4% Two or more races34,253 86.8% White alone, not Hispanic / Latino3,661 83.3% Hispanic or LatinoMoved within same county 3,334 8.1% White / Caucasian880 13.6% Black or African American163 44.9% American Indian / Alaska Native81 5.3% Other race470 12.0% Two or more races3,025 7.7% White alone, not Hispanic / Latino408 9.3% Hispanic or LatinoMoved within same state 1,243 3.0% White / Caucasian284 4.4% Black or African American113 7.3% Other race115 2.9% Two or more races1,243 3.2% White alone, not Hispanic / Latino137 3.1% Hispanic or LatinoMoved from different state 558 1.4% White / Caucasian79 1.2% Black or African American38 9.7% Asian104 2.6% Two or more races518 1.3% White alone, not Hispanic / Latino63 1.4% Hispanic or LatinoMoved from abroad 196 0.5% White13 0.9% Other race41 1.1% Two or more races142 0.4% White alone, not Hispanic / Latino87 2.0% Hispanic or Latino
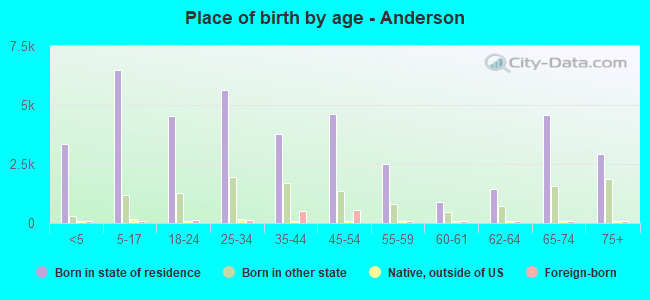
Children Nativity (place of birth) in Anderson
Children under 6 years - Living with two parents Both parents native 1,543 100.0% NativeBoth parents foreign-born 129 100.0% NativeOne native, one foreign-born parent 26 100.0% NativeChildren under 6 years - Living with one parent Native parent 2,066 100.0% NativeForeign-born parent 26 100.0% NativeChildren 6 to 17 years - Living with two parents Both parents native 2,669 100.0% NativeBoth parents foreign-born 397 95.4% Native19 4.6% Foreign-bornOne native, one foreign-born parent 167 100.0% NativeChildren 6 to 17 years - Living with one parent Native parent 2,808 100.0% NativeForeign-born parent 71 59.7% Native48 40.3% Foreign-born
Grandparents responsible for own grandchildren in Anderson
Grandparents (30 to 59 years) White / Caucasian 411 66.8% Responsible for grandchildren204 33.2% Not responsible for grandchildrenBlack or African American 85 100.0% Responsible for grandchildrenOther race 26 100.0% Not responsible for grandchildrenTwo or more races 5 100.0% Not responsible for grandchildrenWhite alone, not Hispanic / Latino 372 65.9% Responsible for grandchildren193 34.1% Not responsible for grandchildrenHispanic or Latino 53 63.8% Responsible for grandchildren30 36.2% Not responsible for grandchildrenGrandparents (60 years and over) White / Caucasian 151 40.9% Responsible for grandchildren218 59.1% Not responsible for grandchildrenBlack or African American 152 87.9% Responsible for grandchildren21 12.1% Not responsible for grandchildrenWhite alone, not Hispanic / Latino 151 40.9% Responsible for grandchildren218 59.1% Not responsible for grandchildren