Races in Anderson, Missouri (MO) Detailed Stats
Ancestries, Foreign-born residents, place of birth
Settings
X


Recent posts about races in Anderson, Missouri on our local forum with over 2,400,000 registered users:
 | Long ago on independence square (13162 replies) |
| It's between KC and Cincinnati. Convince me! (87 replies) |
| Missouri Outlaw History (3407 replies) |
| Interesting Missouri facts. (1186 replies) |
| Why is the streetcar getting so much backlash? (288 replies) |
| MO. 340 River Race gets no respect. (0 replies) |
Latest news about races in Anderson, MO collected exclusively by city-data.com from local newspapers, TV, and radio stations
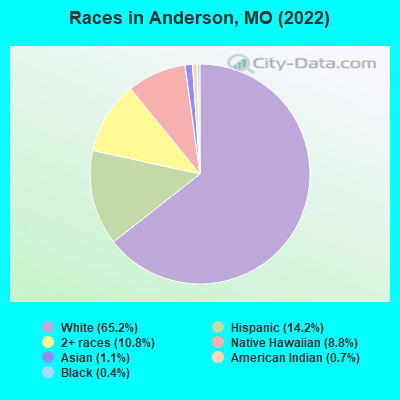
According to 2022 data, the most numerous races in Anderson, MO are White alone (1,675 residents), Black alone (11 residents), and Two or more races (277 residents). 84.7% of Anderson residents speak English at home. 14.7% of Anderson, MO residents are foreign-born (7.9% born in Oceania, 6.1% born in Latin America), which is 72.8% greater than the foreign-born rate of 4.0% across the entire state of Missouri.
Race distribution in Anderson
2000
2022

- 1,67190.0%White alone
- 643.4%Hispanic
- 573.1%American Indian alone
- 492.6%Two or more races
- 110.6%Black alone
- 20.1%Native Hawaiian and Other
Pacific Islander alone - 10.05%Asian alone
- 10.05%Other race alone

-
- 1,67565.2%White alone
- 36514.2%Hispanic
- 27710.8%Two or more races
- 2278.8%Native Hawaiian and Other
Pacific Islander alone - 281.1%Asian alone
- 170.7%American Indian alone
- 110.4%Black alone
2000
2022
-
- 4,686,47483.8%White alone
- 625,66711.2%Black alone
- 118,5922.1%Hispanic
- 71,9051.3%Two or more races
- 61,0411.1%Asian alone
- 23,3020.4%American Indian alone
- 5,2910.09%Other race alone
- 2,9390.05%Native Hawaiian and Other
Pacific Islander alone

-
- 4,733,41176.6%White alone
- 656,73910.6%Black alone
- 316,3005.1%Two or more races
- 291,7634.7%Hispanic
- 132,4362.1%Asian alone
- 27,4670.4%Other race alone
- 12,3130.2%American Indian alone
- 7,5280.1%Native Hawaiian and Other
Pacific Islander alone

Income and house value in Anderson
- Median household income in 2022
- $41,248White non-Hispanic householders
- $58,772Native Hawaiian and other Pacific Islander householders
- $53,462Two or more races householders
- Median 2022 house value
- $112,912White Non-Hispanic householders
- $90,895American Indian or Alaska Native householders
- $126,244Two or more races householders
Household income for White non-Hispanic householders

Household income for American Indian and Alaska Native householders

Household income for Native Hawaiian and other Pacific Islander householders

Household income for Some other race householders

Household income for Two or more races householders

Household income for Hispanic or Latino race householders

Median age by race in Anderson
- 32.8Median age for White residents
- 30.2Males
- 34.7Females
- -682,539,681.9Median age for Black or African American residents
- -673,036,092.7Males
- -685,446,008.7Females
- 27.7Median age for American Indian / Alaska Native residents
- -652,291,104.5Males
- 26.4Females
- 33.6Median age for Asian residents
- -676,616,914.7Males
- 33.6Females
- 47.0Median age for Native Hawaiian / Pacific Islander residents
- 31.5Males
- 51.7Females
- 65.6Median age for Other race residents
- 35.8Males
- 65.2Females
- 33.9Median age for Two or more races residents
- 23.4Males
- 45.4Females
- 33.1Median age for White alone residents
- 31.5Males
- 35.0Females
- 29.3Median age for Hispanic or Latino residents
- 24.8Males
- 43.2Females
Owner/renter occupied households by race in Anderson
- House owners and renters - White residents
- 32248.9%Owner occupied
- 33651.1%Renter occupied
- House owners and renters - Black or African American residents
- 6100.0%Renter occupied
- House owners and renters - American Indian / Alaska Native residents
- 771.3%Owner occupied
- 328.7%Renter occupied
- House owners and renters - Asian residents
- 20100.0%Renter occupied
- House owners and renters - Native Hawaiian / Pacific Islander residents
- 47.3%Owner occupied
- 4592.7%Renter occupied
- House owners and renters - Other race residents
- 3169.2%Owner occupied
- 1430.8%Renter occupied
- House owners and renters - Two or more races residents
- 7253.2%Owner occupied
- 6346.8%Renter occupied
- House owners and renters - White alone residents
- 31550.7%Owner occupied
- 30649.3%Renter occupied
- House owners and renters - Hispanic or Latino residents
- 4747.4%Owner occupied
- 5252.6%Renter occupied
Language usage in Anderson
- English speakers - Total
- 84.7% of residents of Anderson speak English at home.
- 9.4% of residents speak Spanish at home
- 9040.5%Speak English very well
- 13259.5%Speak English less than very well
- 6.0% of residents speak other language at home
- 12890.1%Speak English very well
- 149.9%Speak English less than very well
- English speakers - Born in the United States
- 94.6% of residents of Anderson speak English at home.
- 3.0% of residents speak Spanish at home
- 33100.0%Speak English very well
- 2.2% of residents speak other language at home
- 24100.0%Speak English very well
- English speakers - Native, born elsewhere
- 69.2% of residents of Anderson speak English at home.
- 53.8% of residents speak other language at home
- 7100.0%Speak English less than very well
- English speakers - Foreign-born
- 35.8% of residents of Anderson speak English at home.
- 33.6% of residents speak Spanish at home
- 2016.0%Speak English very well
- 10584.0%Speak English less than very well
- 29.0% of residents speak other language at home
- 9890.7%Speak English very well
- 109.3%Speak English less than very well
White (Caucasian) - Speak only English
| Native: | 99.3% (1,560) |
| Foreign-born: | 49.4% (22) |
White (Caucasian) - Speak another language
| Native: | 0.8% (13) |
| Foreign-born: | 51.2% (23) |
Asian - Speak only English
| Native: | 100.0% (5) |
| Foreign-born: | 33.1% (9) |
Native Hawaiian / Pacific Islander - Speak only English
| Native: | 38.6% (18) |
| Foreign-born: | 59.7% (83) |
Native Hawaiian / Pacific Islander - Speak another language
| Native: | 65.7% (30) |
| Foreign-born: | 45.1% (62) |
Other race - Speak only English
| Native: | 100.0% (34) |
| Foreign-born: | 4.2% (3) |
Two or more races - Speak only English
| Native: | 69.7% (252) |
| Foreign-born: | 9.6% (5) |
Two or more races - Speak another language
| Native: | 34.2% (124) |
| Foreign-born: | 89.7% (45) |
Hispanic or Latino - Speak only English
| Native: | 46.8% (66) |
| Foreign-born: | 20.3% (32) |
Hispanic or Latino - Speak another language
| Native: | 52.0% (73) |
| Foreign-born: | 80.2% (126) |
Foreign-born residents in Anderson
378 residents are foreign born (7.9% Oceania, 6.1% Latin America).
| This city: | 14.7% |
| Missouri: | 4.2% |


Marital status for residents in Anderson
Marital status - White (Caucasian) population 15 years and over
- Males
- 37.0%Never married
- 45.5%Now married
- 1.9%Separated
- 1.9%Widowed
- 13.6%Divorced
- Females
- 12.9%Never married
- 51.6%Now married
- 5.9%Separated
- 11.4%Widowed
- 18.3%Divorced
Women who gave birth in the past 12 months
| Now married: | 100.0% (8) |
| Unmarried: | 0.0% (0) |
Women who did not give birth in the past 12 months
| Now married: | 56.7% (224) |
| Unmarried: | 43.3% (171) |
Marital status - American Indian / Alaska Native population 15 years and over
- Males
- 0.0%Never married
- 100.0%Now married
- 0.0%Separated
- 0.0%Widowed
- 0.0%Divorced
- Females
- 50.0%Never married
- 50.0%Now married
- 0.0%Separated
- 0.0%Widowed
- 0.0%Divorced
Women who did not give birth in the past 12 months
| Now married: | 66.7% (6) |
| Unmarried: | 33.3% (3) |
Marital status - Native Hawaiian / Pacific Islander population 15 years and over
- Males
- 40.5%Never married
- 59.5%Now married
- 0.0%Separated
- 0.0%Widowed
- 0.0%Divorced
- Females
- 16.2%Never married
- 56.2%Now married
- 0.0%Separated
- 18.1%Widowed
- 9.5%Divorced
Women who gave birth in the past 12 months
| Now married: | 100.0% (3) |
| Unmarried: | 0.0% (0) |
Women who did not give birth in the past 12 months
| Now married: | 45.6% (25) |
| Unmarried: | 54.4% (30) |
Marital status - Other race population 15 years and over
- Males
- 0.0%Never married
- 11.1%Now married
- 0.0%Separated
- 0.0%Widowed
- 88.9%Divorced
- Females
- 0.0%Never married
- 60.6%Now married
- 18.2%Separated
- 0.0%Widowed
- 21.2%Divorced
Women who did not give birth in the past 12 months
| Now married: | 0.0% (0) |
| Unmarried: | 100.0% (17) |
Marital status - Two or more races population 15 years and over
- Males
- 35.0%Never married
- 65.0%Now married
- 0.0%Separated
- 0.0%Widowed
- 0.0%Divorced
- Females
- 17.2%Never married
- 32.8%Now married
- 0.0%Separated
- 15.5%Widowed
- 34.5%Divorced
Women who did not give birth in the past 12 months
| Now married: | 29.9% (28) |
| Unmarried: | 70.1% (65) |
Marital status - White alone, not Hispanic / Latino population 15 years and over
- Males
- 37.9%Never married
- 43.8%Now married
- 2.0%Separated
- 2.0%Widowed
- 14.2%Divorced
- Females
- 13.7%Never married
- 51.5%Now married
- 6.3%Separated
- 12.2%Widowed
- 16.3%Divorced
Women who gave birth in the past 12 months
| Now married: | 100.0% (8) |
| Unmarried: | 0.0% (0) |
Women who did not give birth in the past 12 months
| Now married: | 54.1% (204) |
| Unmarried: | 45.9% (173) |
Marital status - Hispanic or Latino population 15 years and over
- Males
- 43.6%Never married
- 34.5%Now married
- 0.0%Separated
- 0.0%Widowed
- 21.8%Divorced
- Females
- 7.1%Never married
- 59.3%Now married
- 8.6%Separated
- 0.0%Widowed
- 25.0%Divorced
Women who did not give birth in the past 12 months
| Now married: | 64.2% (47) |
| Unmarried: | 35.8% (26) |
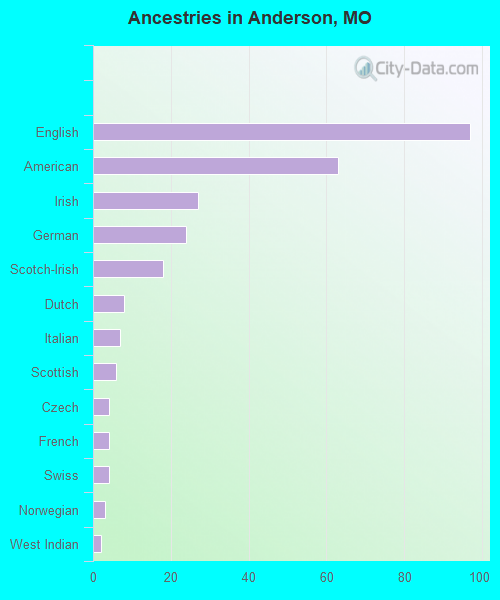
Ancestries in Anderson

- 9711.3%English
- 637.3%American
- 273.1%Irish
- 242.8%German
- 182.1%Scotch-Irish
- 80.9%Dutch
- 70.8%Italian
- 60.7%Scottish
- 40.5%Czech
- 40.5%French
- 40.5%Swiss
- 30.3%Norwegian
- 20.2%West Indian
Geographical mobility in Anderson

- Same house 1 year ago
- 1,61091.4%White (Caucasian)
- 12100.0%Black or African American
- 633.8%American Indian / Alaska Native
- 43100.0%Asian
- 24693.3%Native Hawaiian / Pacific Islander
- 11398.1%Other race
- 43895.2%Two or more races
- 1,52992.1%White alone, not Hispanic / Latino
- 33992.6%Hispanic or Latino

-
- Moved within same county
- 1086.1%White / Caucasian
- 634.4%American Indian / Alaska Native
- 234.9%Two or more races
- 905.4%White alone, not Hispanic / Latino
- 195.2%Hispanic or Latino

-
- Moved within same state
- 110.6%White / Caucasian
- 738.7%American Indian / Alaska Native
- 110.6%White alone, not Hispanic / Latino

-
- Moved from different state
- 341.9%White / Caucasian
- 207.6%Native Hawaiian / Pacific Islander
- 10.3%Two or more races
- 352.1%White alone, not Hispanic / Latino

-
- Moved from abroad
- 43.6%Other race
- 41.0%Hispanic or Latino

Children Nativity (place of birth) in Anderson
Place of birth for residents in Anderson
![Place of birth for the foreign-born population - Regions]()
- 197Oceania
- 154Americas
- 154Latin America
- 151Central America
- 26Asia
- 26South Eastern Asia
- 2Caribbean

![Place of birth for the foreign-born population - Countries]()
- 197Micronesia
- 76Mexico
- 62Guatemala
- 17Thailand
- 8Vietnam
- 6Honduras
- 5El Salvador
- 2Dominica

Grandparents responsible for own grandchildren in Anderson
Zip codes: 64831.