Races in Andover, Florida (FL) Detailed Stats
Ancestries, Foreign-born residents, place of birth

Recent posts about races in Andover, Florida on our local forum with over 2,400,000 registered users:

36.5% of Andover, FL residents are foreign-born (31.0% born in Latin America), which is 42.5% greater than the foreign-born rate of 21.0% across the entire state of Florida.
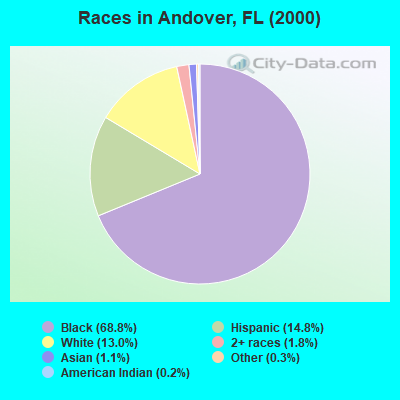
Race distribution in Andover

- 5,84368.8%Black alone
- 1,25714.8%Hispanic
- 1,10413.0%White alone
- 1511.8%Two or more races
- 951.1%Asian alone
- 230.3%Other race alone
- 140.2%American Indian alone
- 20.02%Native Hawaiian and Other
Pacific Islander alone
2000
2022
-
- 10,458,50965.4%White alone
- 2,682,71516.8%Hispanic
- 2,264,26814.2%Black alone
- 261,6931.6%Asian alone
- 236,9541.5%Two or more races
- 42,3580.3%American Indian alone
- 28,9940.2%Other race alone
- 6,8870.04%Native Hawaiian and Other
Pacific Islander alone

-
- 11,309,40350.8%White alone
- 6,025,03927.1%Hispanic
- 3,241,01514.6%Black alone
- 861,6303.9%Two or more races
- 623,6922.8%Asian alone
- 152,0540.7%Other race alone
- 22,5040.1%American Indian alone
- 9,4860.04%Native Hawaiian and Other
Pacific Islander alone

Income and house value in Andover
- Median household income in 2022
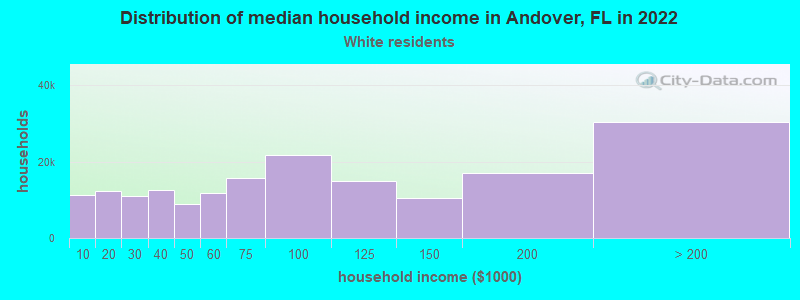
- $52,821White non-Hispanic householders
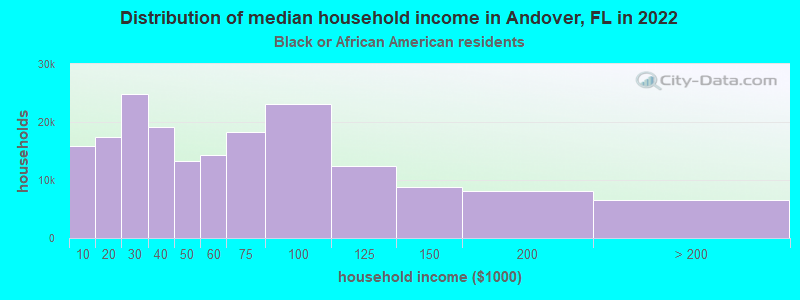
- $67,989Black householders
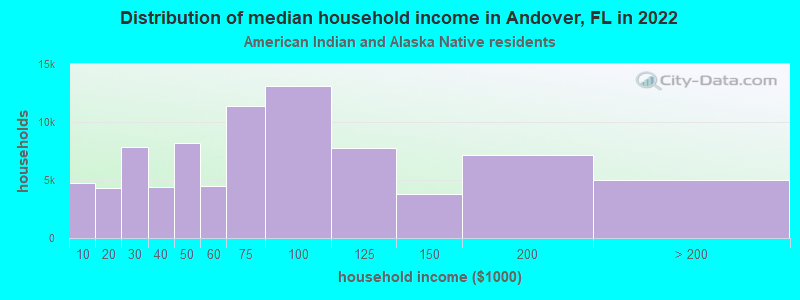
- over $200,000American Indian and Alaska Native householders
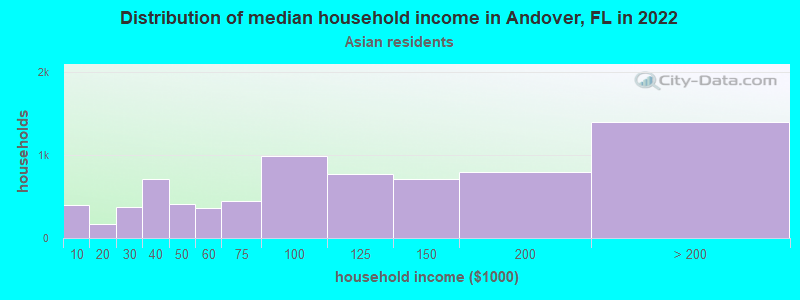
- $42,191Asian householders
- $47,041Some other race householders
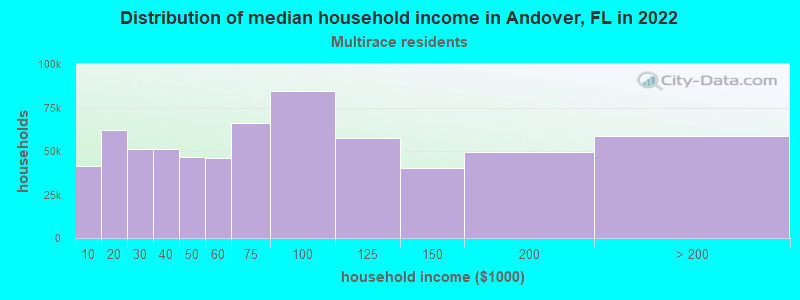
- $89,018Two or more races householders
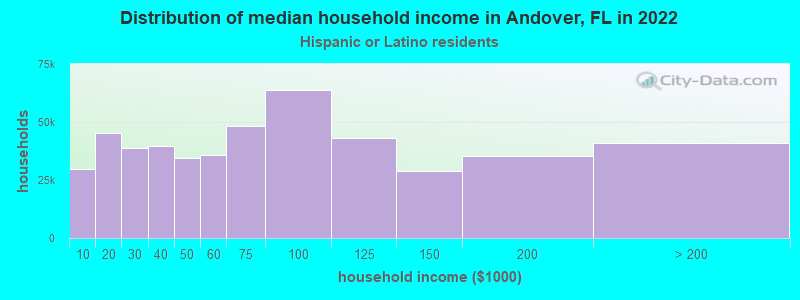
- $46,166Hispanic or Latino race householders
- Median 2022 house value
- $465,313White Non-Hispanic householders
- $458,906Black or African American householders
- $550,607American Indian or Alaska Native householders
- $475,724Asian householders
- $550,607Some other race householders
- $607,069Two or more races householders
- $453,700Hispanic or Latino householders
Household income for White non-Hispanic householders
Household income for Black householders
Household income for American Indian and Alaska Native householders
Household income for Asian householders
Household income for Two or more races householders
Household income for Hispanic or Latino race householders
Foreign-born residents in Andover
3,101 residents are foreign born (31.0% Latin America).
| This city: | 36.5% |
| Florida: | 16.7% |
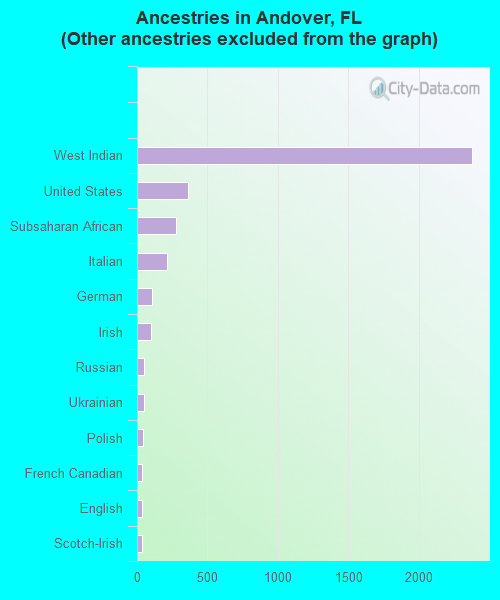
Ancestries in Andover

- 4,06451.7%Other
- 2,37930.3%West Indian
- 3654.6%United States
- 2803.6%Subsaharan African
- 2132.7%Italian
- 1081.4%German
- 981.2%Irish
- 530.7%Russian
- 490.6%Ukrainian
- 460.6%Polish
- 350.4%French Canadian
- 320.4%English
- 320.4%Scotch-Irish
- 210.3%Swedish
- 190.2%French
- 190.2%Scottish
- 180.2%Lithuanian
- 90.1%Greek
- 90.1%Norwegian
- 90.1%Welsh
- 50.06%Czech
Zip codes: 33169.