Races in Andover, Kansas (KS) Detailed Stats
Data:
Races - White alone (%)
Races - White alone (% change since 2000)
Races - Black alone (%)
Races - Black alone (% change since 2000)
Races - American Indian alone (%)
Races - American Indian alone (% change since 2000)
Races - Asian alone (%)
Races - Asian alone (% change since 2000)
Races - Hispanic (%)
Races - Hispanic (% change since 2000)
Races - Native Hawaiian and Other Pacific Islander alone (%)
Races - Native Hawaiian and Other Pacific Islander alone (% change since 2000)
Races - Two or more races(%)
Races - Two or more races(% change since 2000)
Races - Other race alone (%)
Races - Other race alone (% change since 2000)
Racial diversity
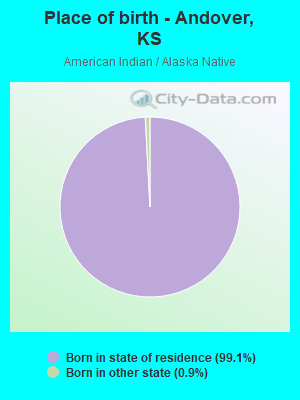
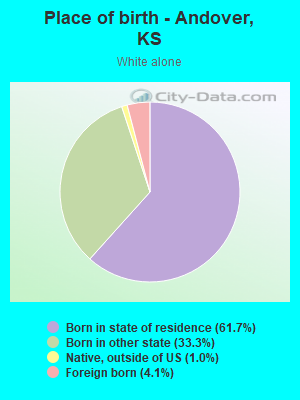
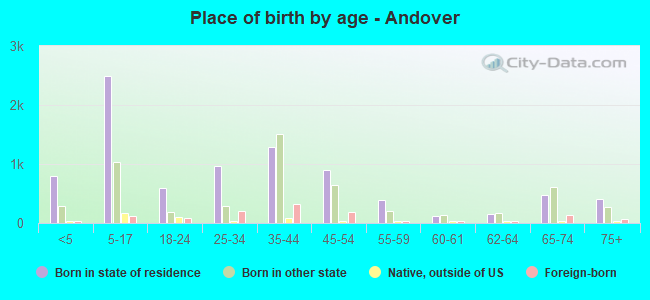
Place of birth - Born in state of residence (%)
Place of birth - Born in state of residence (%) - White
Place of birth - Born in state of residence (%) - Black or African American
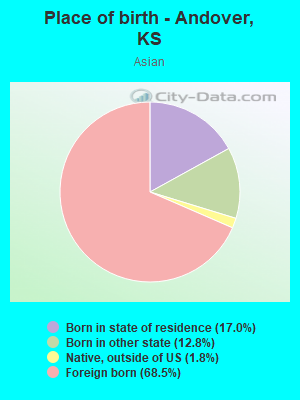
Place of birth - Born in state of residence (%) - Asian
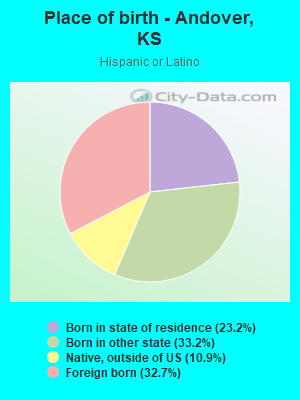
Place of birth - Born in state of residence (%) - Hispanic or Latino
Place of birth - Born in state of residence (%) - American Indian and Alaska Native
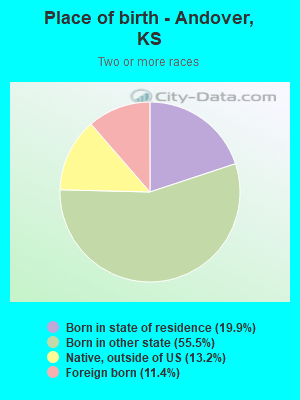
Place of birth - Born in state of residence (%) - Multirace
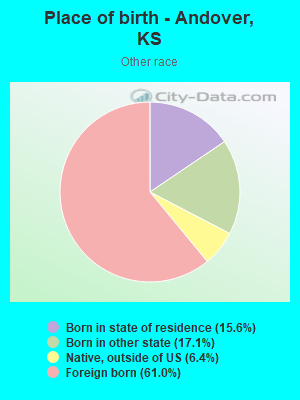
Place of birth - Born in state of residence (%) - Other Race
Place of birth - Born in other state (%)
Place of birth - Born in other state (%) - White
Place of birth - Born in other state (%) - Black or African American
Place of birth - Born in other state (%) - Asian
Place of birth - Born in other state (%) - Hispanic or Latino
Place of birth - Born in other state (%) - American Indian and Alaska Native
Place of birth - Born in other state (%) - Multirace
Place of birth - Born in other state (%) - Other Race
Place of birth - Native, outside of US (%)
Place of birth - Native, outside of US (%) - White
Place of birth - Native, outside of US (%) - Black or African American
Place of birth - Native, outside of US (%) - Asian
Place of birth - Native, outside of US (%) - Hispanic or Latino
Place of birth - Native, outside of US (%) - American Indian and Alaska Native
Place of birth - Native, outside of US (%) - Multirace
Place of birth - Native, outside of US (%) - Other Race
Place of birth - Foreign born (%)
Place of birth - Foreign born (%) - White
Place of birth - Foreign born (%) - Black or African American
Place of birth - Foreign born (%) - Asian
Place of birth - Foreign born (%) - Hispanic or Latino
Place of birth - Foreign born (%) - American Indian and Alaska Native
Place of birth - Foreign born (%) - Multirace
Place of birth - Foreign born (%) - Other Race
Residents speaking English at home (%)
Residents speaking English at home - Born in the United States (%)
Residents speaking English at home - Native, born elsewhere (%)
Residents speaking English at home - Foreign born (%)
Residents speaking Spanish at home (%)
Residents speaking Spanish at home - Born in the United States (%)
Residents speaking Spanish at home - Native, born elsewhere (%)
Residents speaking Spanish at home - Foreign born (%)
Residents speaking other language at home (%)
Residents speaking other language at home - Born in the United States (%)
Residents speaking other language at home - Native, born elsewhere (%)
Residents speaking other language at home - Foreign born (%)
Marital status - Never married (%)
Marital status - Now married (%)
Marital status - Separated (%)
Marital status - Widowed (%)
Marital status - Divorced (%)
Ancestries Reported - Arab (%)
Ancestries Reported - Czech (%)
Ancestries Reported - Danish (%)
Ancestries Reported - Dutch (%)
Ancestries Reported - English (%)
Ancestries Reported - French (%)
Ancestries Reported - French Canadian (%)
Ancestries Reported - German (%)
Ancestries Reported - Greek (%)
Ancestries Reported - Hungarian (%)
Ancestries Reported - Irish (%)
Ancestries Reported - Italian (%)
Ancestries Reported - Lithuanian (%)
Ancestries Reported - Norwegian (%)
Ancestries Reported - Polish (%)
Ancestries Reported - Portuguese (%)
Ancestries Reported - Russian (%)
Ancestries Reported - Scotch-Irish (%)
Ancestries Reported - Scottish (%)
Ancestries Reported - Slovak (%)
Ancestries Reported - Subsaharan African (%)
Ancestries Reported - Swedish (%)
Ancestries Reported - Swiss (%)
Ancestries Reported - Ukrainian (%)
Ancestries Reported - United States (%)
Ancestries Reported - Welsh (%)
Ancestries Reported - West Indian (%)
Ancestries Reported - Other (%)
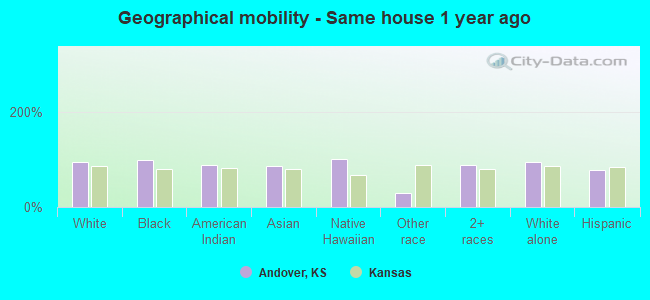
Geographical mobility - Same house 1 year ago (%)
Geographical mobility - Same house 1 year ago (%) - White
Geographical mobility - Same house 1 year ago (%) - Black or African American
Geographical mobility - Same house 1 year ago (%) - Asian
Geographical mobility - Same house 1 year ago (%) - Hispanic or Latino
Geographical mobility - Same house 1 year ago (%) - American Indian and Alaska Native
Geographical mobility - Same house 1 year ago (%) - Multirace
Geographical mobility - Same house 1 year ago (%) - Other Race
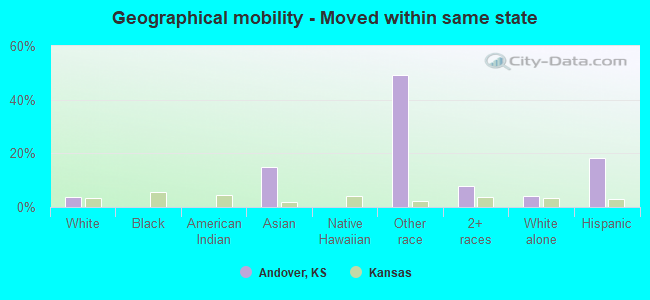
Geographical mobility - Moved within same county (%)
Geographical mobility - Moved within same county (%) - White
Geographical mobility - Moved within same county (%) - Black or African American
Geographical mobility - Moved within same county (%) - Asian
Geographical mobility - Moved within same county (%) - Hispanic or Latino
Geographical mobility - Moved within same county (%) - American Indian and Alaska Native
Geographical mobility - Moved within same county (%) - Multirace
Geographical mobility - Moved within same county (%) - Other Race
Geographical mobility - Moved from different county within same state (%)
Geographical mobility - Moved from different county within same state (%) - White
Geographical mobility - Moved from different county within same state (%) - Black or African American
Geographical mobility - Moved from different county within same state (%) - Asian
Geographical mobility - Moved from different county within same state (%) - Hispanic or Latino
Geographical mobility - Moved from different county within same state (%) - American Indian and Alaska Native
Geographical mobility - Moved from different county within same state (%) - Multirace
Geographical mobility - Moved from different county within same state (%) - Other Race
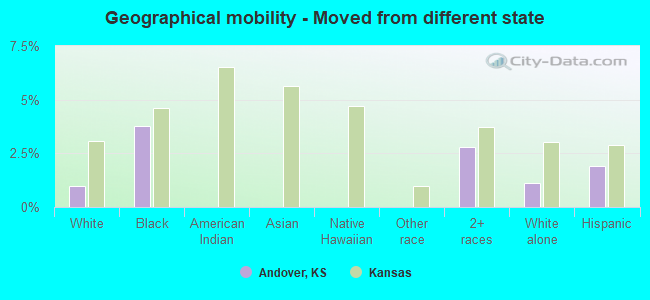
Geographical mobility - Moved from different state (%)
Geographical mobility - Moved from different state (%) - White
Geographical mobility - Moved from different state (%) - Black or African American
Geographical mobility - Moved from different state (%) - Asian
Geographical mobility - Moved from different state (%) - Hispanic or Latino
Geographical mobility - Moved from different state (%) - American Indian and Alaska Native
Geographical mobility - Moved from different state (%) - Multirace
Geographical mobility - Moved from different state (%) - Other Race
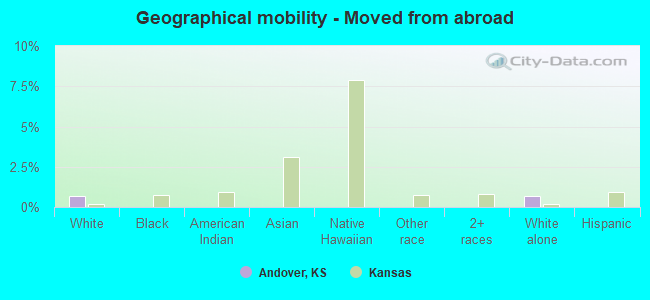
Geographical mobility - Moved from abroad (%)
Geographical mobility - Moved from abroad (%) - White
Geographical mobility - Moved from abroad (%) - Black or African American
Geographical mobility - Moved from abroad (%) - Asian
Geographical mobility - Moved from abroad (%) - Hispanic or Latino
Geographical mobility - Moved from abroad (%) - American Indian and Alaska Native
Geographical mobility - Moved from abroad (%) - Multirace
Geographical mobility - Moved from abroad (%) - Other Race
Place of birth for the foreign-born population - Ireland (%)
Place of birth for the foreign-born population - Denmark (%)
Place of birth for the foreign-born population - Norway (%)
Place of birth for the foreign-born population - Sweden (%)
Place of birth for the foreign-born population - United Kingdom (%)
Place of birth for the foreign-born population - England (%)
Place of birth for the foreign-born population - Scotland (%)
Place of birth for the foreign-born population - Other Northern Europe (%)
Place of birth for the foreign-born population - Austria (%)
Place of birth for the foreign-born population - Belgium (%)
Place of birth for the foreign-born population - France (%)
Place of birth for the foreign-born population - Germany (%)
Place of birth for the foreign-born population - Netherlands (%)
Place of birth for the foreign-born population - Switzerland (%)
Place of birth for the foreign-born population - Other Western Europe (%)
Place of birth for the foreign-born population - Greece (%)
Place of birth for the foreign-born population - Italy (%)
Place of birth for the foreign-born population - Portugal (%)
Place of birth for the foreign-born population - Spain (%)
Place of birth for the foreign-born population - Other Southern Europe (%)
Place of birth for the foreign-born population - Albania (%)
Place of birth for the foreign-born population - Belarus (%)
Place of birth for the foreign-born population - Bosnia and Herzegovina (%)
Place of birth for the foreign-born population - Bulgaria (%)
Place of birth for the foreign-born population - Croatia (%)
Place of birth for the foreign-born population - Czechoslovakia (%)
Place of birth for the foreign-born population - Hungary (%)
Place of birth for the foreign-born population - Latvia (%)
Place of birth for the foreign-born population - Lithuania (%)
Place of birth for the foreign-born population - North Macedonia (Macedonia) (%)
Place of birth for the foreign-born population - Moldova (%)
Place of birth for the foreign-born population - Poland (%)
Place of birth for the foreign-born population - Romania (%)
Place of birth for the foreign-born population - Russia (%)
Place of birth for the foreign-born population - Serbia (%)
Place of birth for the foreign-born population - Ukraine (%)
Place of birth for the foreign-born population - Other Eastern Europe (%)
Place of birth for the foreign-born population - China (%)
Place of birth for the foreign-born population - Hong Kong (%)
Place of birth for the foreign-born population - Taiwan (%)
Place of birth for the foreign-born population - Japan (%)
Place of birth for the foreign-born population - Korea (%)
Place of birth for the foreign-born population - Other Eastern Asia (%)
Place of birth for the foreign-born population - Afghanistan (%)
Place of birth for the foreign-born population - Bangladesh (%)
Place of birth for the foreign-born population - India (%)
Place of birth for the foreign-born population - Iran (%)
Place of birth for the foreign-born population - Kazakhstan (%)
Place of birth for the foreign-born population - Nepal (%)
Place of birth for the foreign-born population - Pakistan (%)
Place of birth for the foreign-born population - Sri Lanka (%)
Place of birth for the foreign-born population - Uzbekistan (%)
Place of birth for the foreign-born population - Other South Central Asia (%)
Place of birth for the foreign-born population - Burma (%)
Place of birth for the foreign-born population - Cambodia (%)
Place of birth for the foreign-born population - Indonesia (%)
Place of birth for the foreign-born population - Laos (%)
Place of birth for the foreign-born population - Malaysia (%)
Place of birth for the foreign-born population - Philippines (%)
Place of birth for the foreign-born population - Singapore (%)
Place of birth for the foreign-born population - Thailand (%)
Place of birth for the foreign-born population - Vietnam (%)
Place of birth for the foreign-born population - Other South Eastern Asia (%)
Place of birth for the foreign-born population - Armenia (%)
Place of birth for the foreign-born population - Iraq (%)
Place of birth for the foreign-born population - Israel (%)
Place of birth for the foreign-born population - Jordan (%)
Place of birth for the foreign-born population - Kuwait (%)
Place of birth for the foreign-born population - Lebanon (%)
Place of birth for the foreign-born population - Saudi Arabia (%)
Place of birth for the foreign-born population - Syria (%)
Place of birth for the foreign-born population - Turkey (%)
Place of birth for the foreign-born population - Yemen (%)
Place of birth for the foreign-born population - Other Western Asia (%)
Place of birth for the foreign-born population - Eritrea (%)
Place of birth for the foreign-born population - Ethiopia (%)
Place of birth for the foreign-born population - Kenya (%)
Place of birth for the foreign-born population - Somalia (%)
Place of birth for the foreign-born population - Uganda (%)
Place of birth for the foreign-born population - Zimbabwe (%)
Place of birth for the foreign-born population - Other Eastern Africa (%)
Place of birth for the foreign-born population - Cameroon (%)
Place of birth for the foreign-born population - Congo (%)
Place of birth for the foreign-born population - Democratic Republic of Congo (Zaire) (%)
Place of birth for the foreign-born population - Other Middle Africa (%)
Place of birth for the foreign-born population - Egypt (%)
Place of birth for the foreign-born population - Morocco (%)
Place of birth for the foreign-born population - Sudan (%)
Place of birth for the foreign-born population - Other Northern Africa (%)
Place of birth for the foreign-born population - South Africa (%)
Place of birth for the foreign-born population - Other Southern Africa (%)
Place of birth for the foreign-born population - Cabo Verde (%)
Place of birth for the foreign-born population - Ghana (%)
Place of birth for the foreign-born population - Liberia (%)
Place of birth for the foreign-born population - Nigeria (%)
Place of birth for the foreign-born population - Senegal (%)
Place of birth for the foreign-born population - Sierra Leone (%)
Place of birth for the foreign-born population - Other Western Africa (%)
Place of birth for the foreign-born population - Australia (%)
Place of birth for the foreign-born population - New Zealand (%)
Place of birth for the foreign-born population - Fiji (%)
Place of birth for the foreign-born population - Micronesia (%)
Place of birth for the foreign-born population - Bahamas (%)
Place of birth for the foreign-born population - Barbados (%)
Place of birth for the foreign-born population - Cuba (%)
Place of birth for the foreign-born population - Dominica (%)
Place of birth for the foreign-born population - Dominican Republic (%)
Place of birth for the foreign-born population - Grenada (%)
Place of birth for the foreign-born population - Haiti (%)
Place of birth for the foreign-born population - Jamaica (%)
Place of birth for the foreign-born population - St. Vincent and the Grenadines (%)
Place of birth for the foreign-born population - Trinidad and Tobago (%)
Place of birth for the foreign-born population - West Indies (%)
Place of birth for the foreign-born population - Other Caribbean (%)
Place of birth for the foreign-born population - Belize (%)
Place of birth for the foreign-born population - Costa Rica (%)
Place of birth for the foreign-born population - El Salvador (%)
Place of birth for the foreign-born population - Guatemala (%)
Place of birth for the foreign-born population - Honduras (%)
Place of birth for the foreign-born population - Mexico (%)
Place of birth for the foreign-born population - Nicaragua (%)
Place of birth for the foreign-born population - Panama (%)
Place of birth for the foreign-born population - Other Central America (%)
Place of birth for the foreign-born population - Argentina (%)
Place of birth for the foreign-born population - Bolivia (%)
Place of birth for the foreign-born population - Brazil (%)
Place of birth for the foreign-born population - Chile (%)
Place of birth for the foreign-born population - Colombia (%)
Place of birth for the foreign-born population - Ecuador (%)
Place of birth for the foreign-born population - Guyana (%)
Place of birth for the foreign-born population - Peru (%)
Place of birth for the foreign-born population - Uruguay (%)
Place of birth for the foreign-born population - Venezuela (%)
Place of birth for the foreign-born population - Other South America (%)
Place of birth for the foreign-born population - Canada (%)
Place of birth for the foreign-born population - Other Northern America (%)
Place of birth for the foreign-born population - Other (%)
Latest news about races in Andover, KS collected exclusively by city-data.com from local newspapers, TV, and radio stations
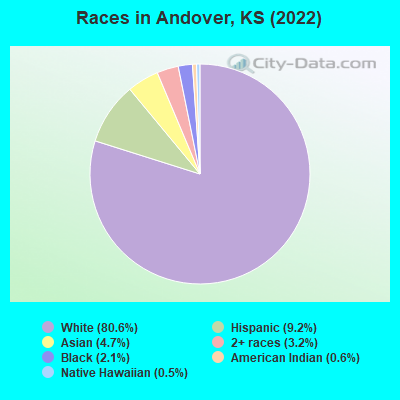
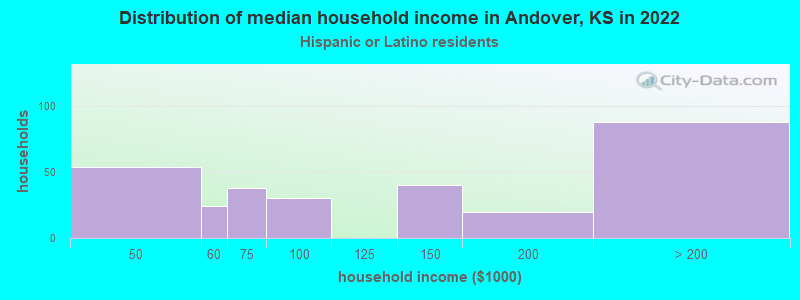
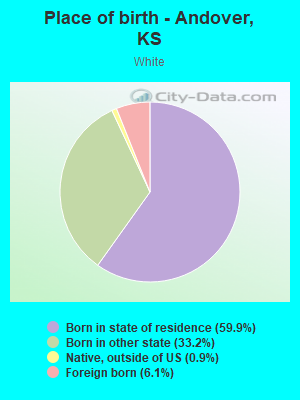
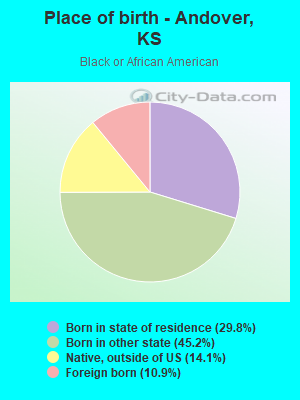
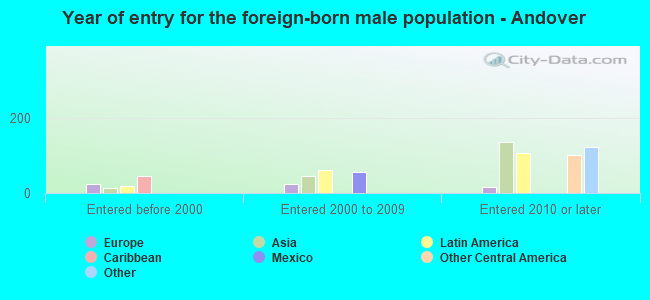
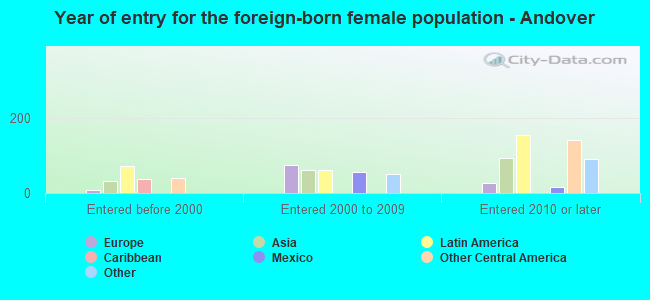
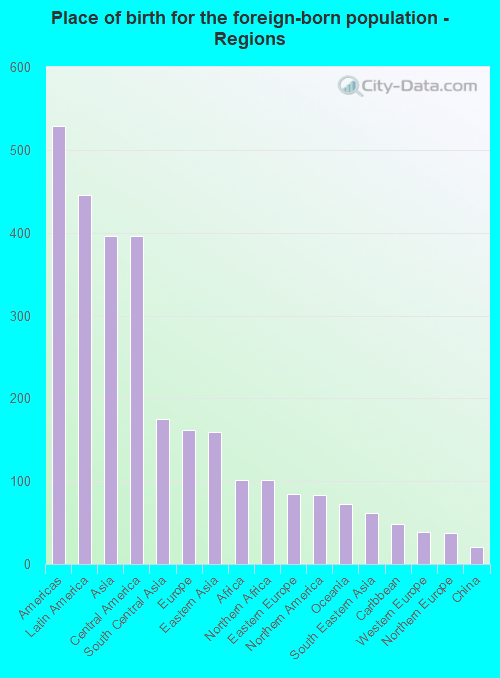
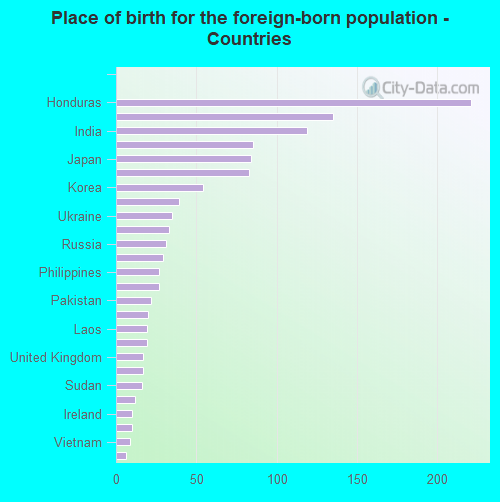
According to 2022 data, the most numerous races in Andover, KS are White alone (12,577 residents), Hispanic (1,433 residents), and Black alone (322 residents). 89.4% of Andover residents speak English at home. 8.1% of Andover, KS residents are foreign-born (2.8% born in Latin America, 2.5% born in Asia, 1.0% born in Europe), which is 13.5% greater than the foreign-born rate of 7.0% across the entire state of Kansas.
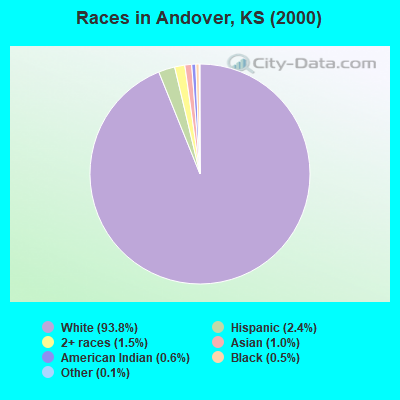
Race distribution in Andover
2000 2022
2,233,997 83.1% White alone 188,252 7.0% Hispanic 151,407 5.6% Black alone 46,301 1.7% Asian alone 42,508 1.6% Two or more races 22,322 0.8% American Indian alone 2,477 0.09% Other race alone 1,154 0.04% Native Hawaiian and Other
2,147,943 73.1% White alone 381,746 13.0% Hispanic 147,666 5.0% Black alone 145,362 4.9% Two or more races 85,085 2.9% Asian alone 13,263 0.5% Other race alone 12,065 0.4% American Indian alone 4,020 0.1% Native Hawaiian and Other
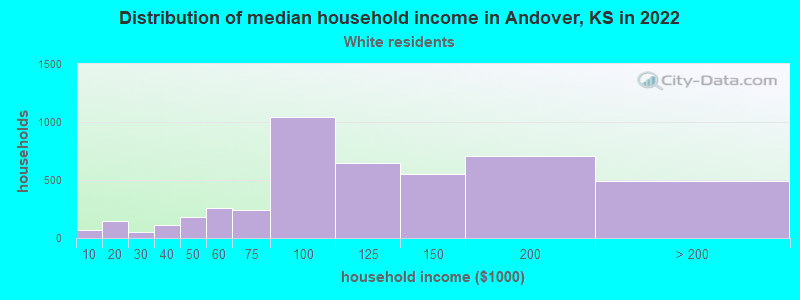
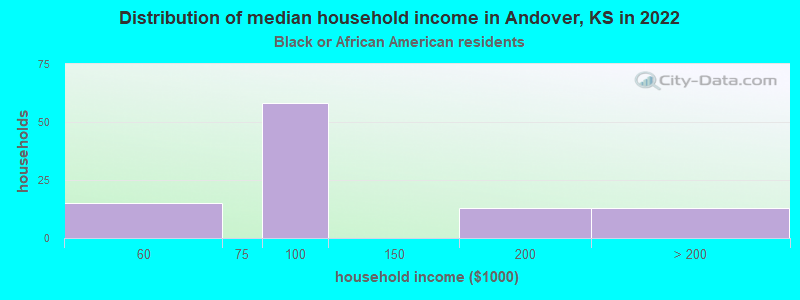
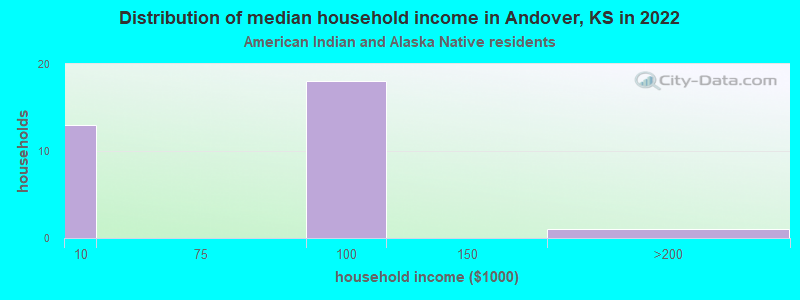
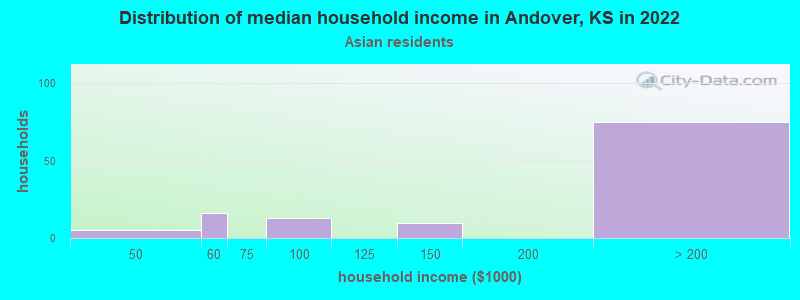
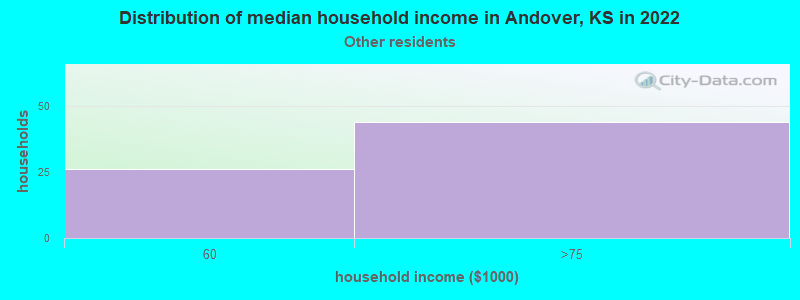
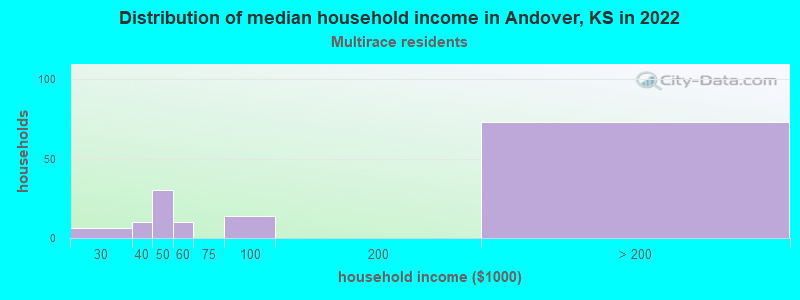
Income and house value in Andover Median household income in 2022 $118,980 White non-Hispanic householders$93,731 Black householdersover $200,000 Asian householders$189,335 Two or more races householdersMedian 2022 house value $311,046 White Non-Hispanic householders$402,383 American Indian or Alaska Native householders $239,476 Asian householders$426,012 Some other race householders$207,439 Two or more races householders$426,012 Hispanic or Latino householders
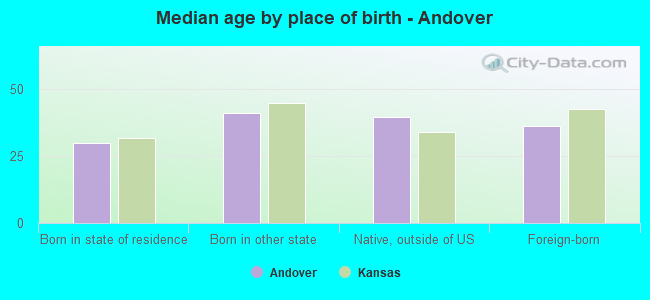
Median age by race in Andover
37.0 Median age for White residents34.6 37.6 42.0 Median age for Black or African American residents39.3 18.1 21.1 Median age for American Indian / Alaska Native residents-666,666,666.0 16.0 24.5 Median age for Asian residents28.3 25.3 29.4 Median age for Native Hawaiian / Pacific Islander residents-666,666,666.0 -666,666,666.0 64.7 Median age for Other race residents-1,235,820,894.3 54.5 21.7 Median age for Two or more races residents19.2 32.6 37.3 Median age for White alone residents35.2 38.3 26.2 Median age for Hispanic or Latino residents21.9 49.3
Owner/renter occupied households by race in Andover
House owners and renters - White residents 3,721 82.9% Owner occupied769 17.1% Renter occupiedHouse owners and renters - Black or African American residents 56 61.2% Owner occupied35 38.8% Renter occupiedHouse owners and renters - American Indian / Alaska Native residents 26 100.0% Renter occupiedHouse owners and renters - Asian residents 124 100.0% Owner occupiedHouse owners and renters - Native Hawaiian / Pacific Islander residents 40 100.0% Renter occupiedHouse owners and renters - Other race residents 28 38.6% Owner occupied45 61.4% Renter occupiedHouse owners and renters - Two or more races residents 87 79.5% Owner occupied22 20.5% Renter occupiedHouse owners and renters - White alone residents 3,572 83.0% Owner occupied732 17.0% Renter occupiedHouse owners and renters - Hispanic or Latino residents 275 68.5% Owner occupied126 31.5% Renter occupied
Language usage in Andover
English speakers - Total 89.4% of residents of Andover speak English at home.
5.7% of residents speak Spanish at home 621 75.2% Speak English very well205 24.8% Speak English less than very well4.9% of residents speak other language at home 544 77.3% Speak English very well160 22.7% Speak English less than very well
English speakers - Born in the United States 91.4% of residents of Andover speak English at home.
6.6% of residents speak Spanish at home 324 100.0% Speak English very well2.0% of residents speak other language at home 75 78.1% Speak English very well21 21.9% Speak English less than very well
English speakers - Native, born elsewhere 94.2% of residents of Andover speak English at home.
7.7% of residents speak Spanish at home 25 100.0% Speak English very well
English speakers - Foreign-born 29.0% of residents of Andover speak English at home.
30.1% of residents speak Spanish at home 191 52.3% Speak English very well174 47.7% Speak English less than very well41.4% of residents speak other language at home 361 71.9% Speak English very well141 28.1% Speak English less than very well
White (Caucasian) - Speak only English Native:
96.9% (11,470)Foreign-born:
28.0% (228)
White (Caucasian) - Speak another language Native:
2.4% (286)Foreign-born:
15.4% (125)
Black or African American - Speak another language Native:
28.6% (88)Foreign-born:
98.2% (44)
Asian - Speak only English Native:
50.1% (49)Foreign-born:
8.3% (43)
Asian - Speak another language Native:
49.5% (48)Foreign-born:
91.5% (476)
Other race - Speak another language Native:
42.2% (81)Foreign-born:
96.6% (279)
Two or more races - Speak only English Native:
92.1% (790)Foreign-born:
72.4% (87)
Two or more races - Speak another language Native:
4.4% (38)Foreign-born:
18.1% (22)
White alone - Speak only English Native:
98.3% (11,150)Foreign-born:
40.7% (126)
White alone - Speak another language Native:
1.6% (181)Foreign-born:
59.4% (184)
Hispanic or Latino - Speak only English Native:
61.1% (525)Foreign-born:
24.9% (114)
Hispanic or Latino - Speak another language Native:
38.9% (335)Foreign-born:
78.9% (361)
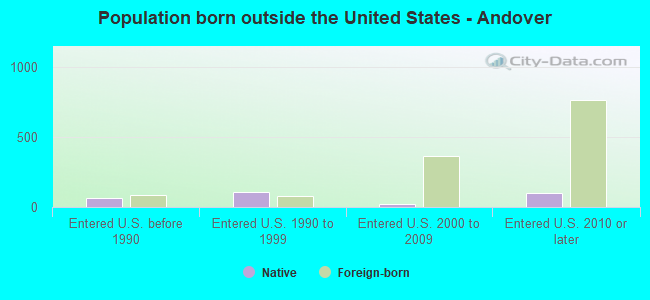
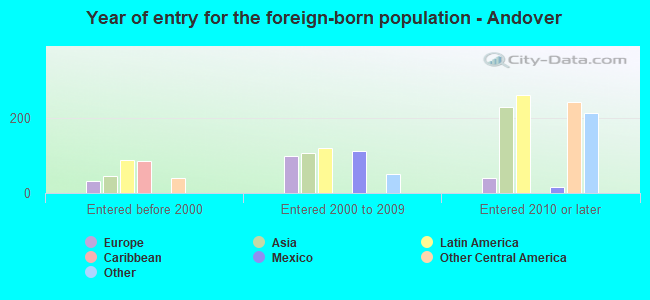
Foreign-born residents in Andover 1,263 residents are foreign born (2.8% Latin America , 2.5% Asia , 1.0% Europe ).
This city:
8.1%Kansas:
7.1%
Marital status for residents in Andover Marital status - White (Caucasian) population 15 years and over
Males 23.9% Never married67.5% Now married0.0% Separated2.6% Widowed6.0% DivorcedFemales 16.6% Never married64.7% Now married0.6% Separated4.6% Widowed13.5% DivorcedWomen who gave birth in the past 12 months Now married:
100.0% (180)Unmarried:
0.0% (0)
Women who did not give birth in the past 12 months Now married:
68.2% (2,080)Unmarried:
31.8% (969)
Marital status - Black or African American population 15 years and over
Males 33.1% Never married66.9% Now married0.0% Separated0.0% Widowed0.0% DivorcedFemales 22.0% Never married77.1% Now married0.0% Separated0.0% Widowed0.9% DivorcedWomen who did not give birth in the past 12 months Now married:
77.8% (86)Unmarried:
22.2% (24)
Marital status - American Indian / Alaska Native population 15 years and over
Males 53.8% Never married0.0% Now married46.2% Separated0.0% Widowed0.0% DivorcedFemales 76.7% Never married23.3% Now married0.0% Separated0.0% Widowed0.0% DivorcedWomen who did not give birth in the past 12 months Now married:
2.9% (1)Unmarried:
97.1% (37)
Marital status - Asian population 15 years and over
Males 21.4% Never married78.6% Now married0.0% Separated0.0% Widowed0.0% DivorcedFemales 25.6% Never married63.6% Now married0.0% Separated4.7% Widowed6.2% DivorcedWomen who did not give birth in the past 12 months Now married:
64.0% (73)Unmarried:
36.0% (41)
Marital status - Native Hawaiian / Pacific Islander population 15 years and over
Males 0.0% Never married100.0% Now married0.0% Separated0.0% Widowed0.0% DivorcedFemales 0.0% Never married72.2% Now married0.0% Separated0.0% Widowed27.8% DivorcedWomen who gave birth in the past 12 months Now married:
100.0% (27)Unmarried:
0.0% (0)
Women who did not give birth in the past 12 months Now married:
0.0% (0)Unmarried:
100.0% (11)
Marital status - Other race population 15 years and over
Males 0.0% Never married100.0% Now married0.0% Separated0.0% Widowed0.0% DivorcedFemales 11.1% Never married88.9% Now married0.0% Separated0.0% Widowed0.0% DivorcedWomen who did not give birth in the past 12 months Now married:
85.6% (194)Unmarried:
14.4% (33)
Marital status - Two or more races population 15 years and over
Males 64.6% Never married25.8% Now married0.0% Separated0.0% Widowed9.6% DivorcedFemales 33.2% Never married62.1% Now married2.7% Separated2.0% Widowed0.0% DivorcedWomen who did not give birth in the past 12 months Now married:
56.9% (148)Unmarried:
43.1% (112)
Marital status - White alone, not Hispanic / Latino population 15 years and over
Males 24.8% Never married66.4% Now married0.0% Separated2.7% Widowed6.2% DivorcedFemales 15.3% Never married65.2% Now married0.6% Separated4.8% Widowed14.1% DivorcedWomen who gave birth in the past 12 months Now married:
100.0% (177)Unmarried:
0.0% (0)
Women who did not give birth in the past 12 months Now married:
69.8% (1,978)Unmarried:
30.2% (857)
Marital status - Hispanic or Latino population 15 years and over
Males 41.8% Never married58.2% Now married0.0% Separated0.0% Widowed0.0% DivorcedFemales 25.8% Never married74.2% Now married0.0% Separated0.0% Widowed0.0% DivorcedWomen who did not give birth in the past 12 months Now married:
65.3% (286)Unmarried:
34.7% (152)
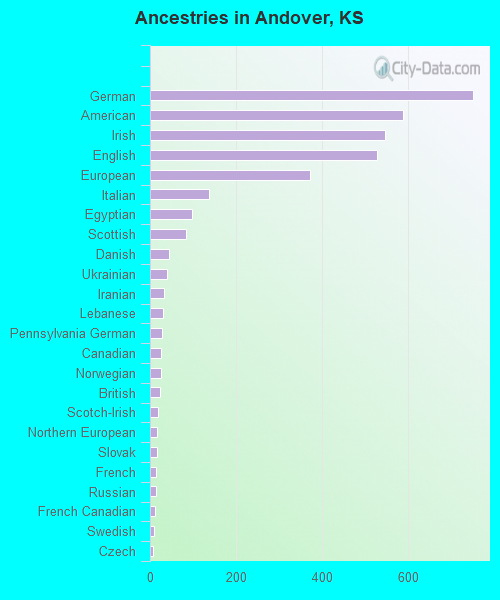
Ancestries in Andover
750 14.0% German588 11.0% American545 10.2% Irish528 9.9% English372 6.9% European137 2.6% Italian97 1.8% Egyptian83 1.5% Scottish43 0.8% Danish39 0.7% Ukrainian32 0.6% Iranian31 0.6% Lebanese28 0.5% Pennsylvania German26 0.5% Canadian25 0.5% Norwegian23 0.4% British18 0.3% Scotch-Irish16 0.3% Northern European16 0.3% Slovak15 0.3% French14 0.3% Russian11 0.2% French Canadian10 0.2% Swedish7 0.1% Czech
Children Nativity (place of birth) in Andover
Children under 6 years - Living with two parents Both parents native 871 100.0% Native0 0.0% Foreign-bornBoth parents foreign-born 59 63.3% Native34 36.7% Foreign-bornOne native, one foreign-born parent 177 100.0% NativeChildren under 6 years - Living with one parent Native parent 131 100.0% NativeForeign-born parent 21 100.0% NativeChildren 6 to 17 years - Living with two parents Both parents native 2,661 99.6% Native12 0.4% Foreign-bornBoth parents foreign-born 137 63.0% Native80 37.0% Foreign-bornOne native, one foreign-born parent 267 79.2% Native70 20.8% Foreign-bornChildren 6 to 17 years - Living with one parent Native parent 284 100.0% NativeForeign-born parent 59 50.2% Native58 49.8% Foreign-born
Grandparents responsible for own grandchildren in Andover
Grandparents (30 to 59 years) White / Caucasian 110 70.3% Responsible for grandchildren47 29.7% Not responsible for grandchildrenWhite alone, not Hispanic / Latino 116 100.0% Responsible for grandchildrenHispanic or Latino 64 100.0% Not responsible for grandchildrenGrandparents (60 years and over) White / Caucasian 46 23.2% Responsible for grandchildren152 76.8% Not responsible for grandchildrenWhite alone, not Hispanic / Latino 47 24.8% Responsible for grandchildren143 75.2% Not responsible for grandchildrenHispanic or Latino 20 100.0% Not responsible for grandchildren