Races in Andrews, Texas (TX) Detailed Stats
Data:
Races - White alone (%)
Races - White alone (% change since 2000)
Races - Black alone (%)
Races - Black alone (% change since 2000)
Races - American Indian alone (%)
Races - American Indian alone (% change since 2000)
Races - Asian alone (%)
Races - Asian alone (% change since 2000)
Races - Hispanic (%)
Races - Hispanic (% change since 2000)
Races - Native Hawaiian and Other Pacific Islander alone (%)
Races - Native Hawaiian and Other Pacific Islander alone (% change since 2000)
Races - Two or more races(%)
Races - Two or more races(% change since 2000)
Races - Other race alone (%)
Races - Other race alone (% change since 2000)
Racial diversity
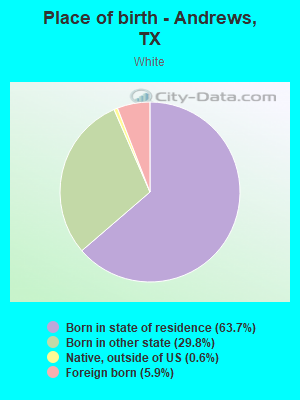
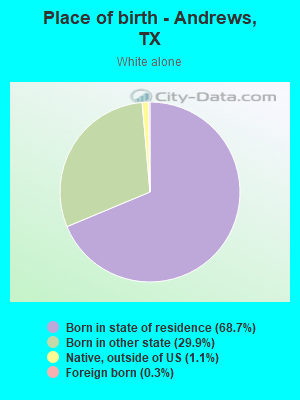
Place of birth - Born in state of residence (%)
Place of birth - Born in state of residence (%) - White
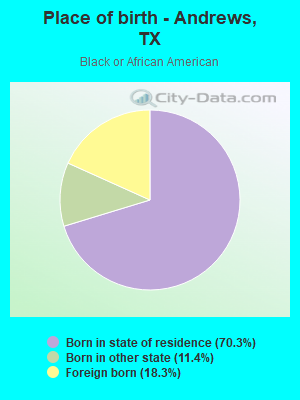
Place of birth - Born in state of residence (%) - Black or African American
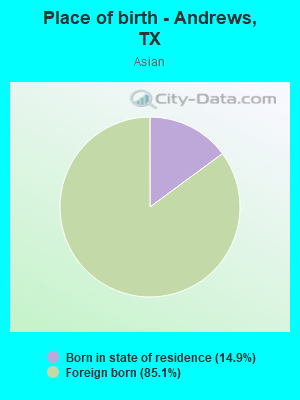
Place of birth - Born in state of residence (%) - Asian
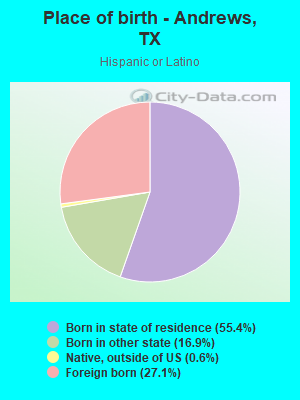
Place of birth - Born in state of residence (%) - Hispanic or Latino
Place of birth - Born in state of residence (%) - American Indian and Alaska Native
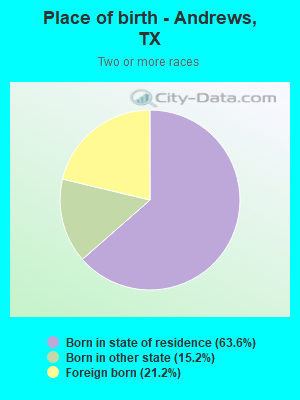
Place of birth - Born in state of residence (%) - Multirace
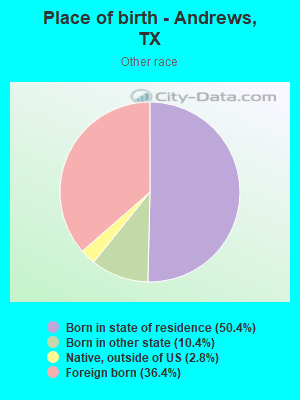
Place of birth - Born in state of residence (%) - Other Race
Place of birth - Born in other state (%)
Place of birth - Born in other state (%) - White
Place of birth - Born in other state (%) - Black or African American
Place of birth - Born in other state (%) - Asian
Place of birth - Born in other state (%) - Hispanic or Latino
Place of birth - Born in other state (%) - American Indian and Alaska Native
Place of birth - Born in other state (%) - Multirace
Place of birth - Born in other state (%) - Other Race
Place of birth - Native, outside of US (%)
Place of birth - Native, outside of US (%) - White
Place of birth - Native, outside of US (%) - Black or African American
Place of birth - Native, outside of US (%) - Asian
Place of birth - Native, outside of US (%) - Hispanic or Latino
Place of birth - Native, outside of US (%) - American Indian and Alaska Native
Place of birth - Native, outside of US (%) - Multirace
Place of birth - Native, outside of US (%) - Other Race
Place of birth - Foreign born (%)
Place of birth - Foreign born (%) - White
Place of birth - Foreign born (%) - Black or African American
Place of birth - Foreign born (%) - Asian
Place of birth - Foreign born (%) - Hispanic or Latino
Place of birth - Foreign born (%) - American Indian and Alaska Native
Place of birth - Foreign born (%) - Multirace
Place of birth - Foreign born (%) - Other Race
Residents speaking English at home (%)
Residents speaking English at home - Born in the United States (%)
Residents speaking English at home - Native, born elsewhere (%)
Residents speaking English at home - Foreign born (%)
Residents speaking Spanish at home (%)
Residents speaking Spanish at home - Born in the United States (%)
Residents speaking Spanish at home - Native, born elsewhere (%)
Residents speaking Spanish at home - Foreign born (%)
Residents speaking other language at home (%)
Residents speaking other language at home - Born in the United States (%)
Residents speaking other language at home - Native, born elsewhere (%)
Residents speaking other language at home - Foreign born (%)
Marital status - Never married (%)
Marital status - Now married (%)
Marital status - Separated (%)
Marital status - Widowed (%)
Marital status - Divorced (%)
Ancestries Reported - Arab (%)
Ancestries Reported - Czech (%)
Ancestries Reported - Danish (%)
Ancestries Reported - Dutch (%)
Ancestries Reported - English (%)
Ancestries Reported - French (%)
Ancestries Reported - French Canadian (%)
Ancestries Reported - German (%)
Ancestries Reported - Greek (%)
Ancestries Reported - Hungarian (%)
Ancestries Reported - Irish (%)
Ancestries Reported - Italian (%)
Ancestries Reported - Lithuanian (%)
Ancestries Reported - Norwegian (%)
Ancestries Reported - Polish (%)
Ancestries Reported - Portuguese (%)
Ancestries Reported - Russian (%)
Ancestries Reported - Scotch-Irish (%)
Ancestries Reported - Scottish (%)
Ancestries Reported - Slovak (%)
Ancestries Reported - Subsaharan African (%)
Ancestries Reported - Swedish (%)
Ancestries Reported - Swiss (%)
Ancestries Reported - Ukrainian (%)
Ancestries Reported - United States (%)
Ancestries Reported - Welsh (%)
Ancestries Reported - West Indian (%)
Ancestries Reported - Other (%)
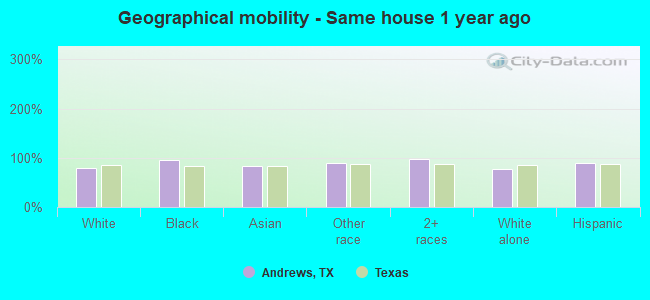
Geographical mobility - Same house 1 year ago (%)
Geographical mobility - Same house 1 year ago (%) - White
Geographical mobility - Same house 1 year ago (%) - Black or African American
Geographical mobility - Same house 1 year ago (%) - Asian
Geographical mobility - Same house 1 year ago (%) - Hispanic or Latino
Geographical mobility - Same house 1 year ago (%) - American Indian and Alaska Native
Geographical mobility - Same house 1 year ago (%) - Multirace
Geographical mobility - Same house 1 year ago (%) - Other Race
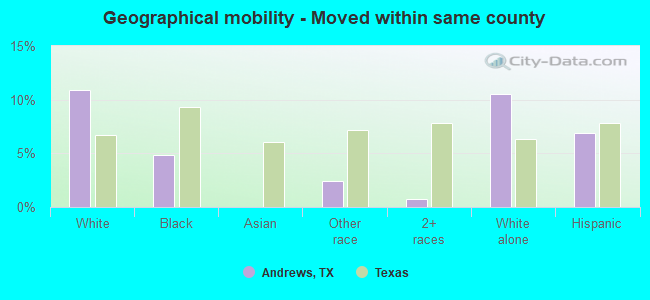
Geographical mobility - Moved within same county (%)
Geographical mobility - Moved within same county (%) - White
Geographical mobility - Moved within same county (%) - Black or African American
Geographical mobility - Moved within same county (%) - Asian
Geographical mobility - Moved within same county (%) - Hispanic or Latino
Geographical mobility - Moved within same county (%) - American Indian and Alaska Native
Geographical mobility - Moved within same county (%) - Multirace
Geographical mobility - Moved within same county (%) - Other Race
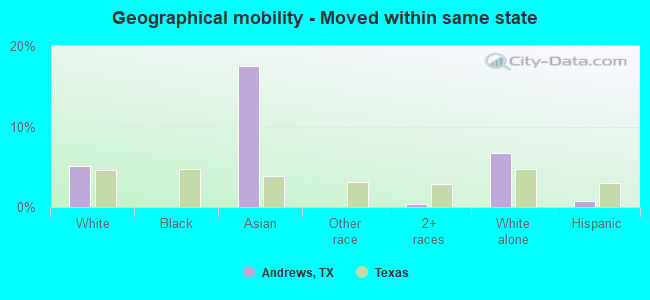
Geographical mobility - Moved from different county within same state (%)
Geographical mobility - Moved from different county within same state (%) - White
Geographical mobility - Moved from different county within same state (%) - Black or African American
Geographical mobility - Moved from different county within same state (%) - Asian
Geographical mobility - Moved from different county within same state (%) - Hispanic or Latino
Geographical mobility - Moved from different county within same state (%) - American Indian and Alaska Native
Geographical mobility - Moved from different county within same state (%) - Multirace
Geographical mobility - Moved from different county within same state (%) - Other Race
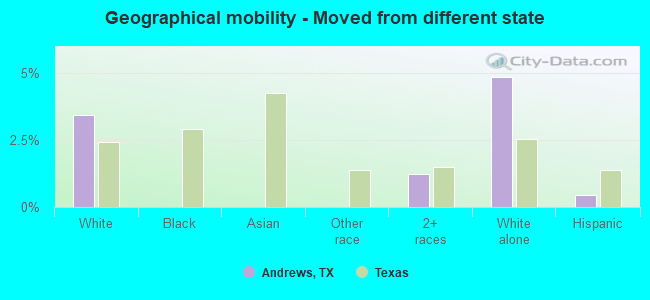
Geographical mobility - Moved from different state (%)
Geographical mobility - Moved from different state (%) - White
Geographical mobility - Moved from different state (%) - Black or African American
Geographical mobility - Moved from different state (%) - Asian
Geographical mobility - Moved from different state (%) - Hispanic or Latino
Geographical mobility - Moved from different state (%) - American Indian and Alaska Native
Geographical mobility - Moved from different state (%) - Multirace
Geographical mobility - Moved from different state (%) - Other Race
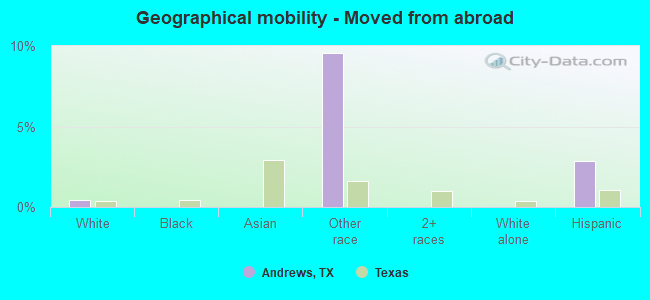
Geographical mobility - Moved from abroad (%)
Geographical mobility - Moved from abroad (%) - White
Geographical mobility - Moved from abroad (%) - Black or African American
Geographical mobility - Moved from abroad (%) - Asian
Geographical mobility - Moved from abroad (%) - Hispanic or Latino
Geographical mobility - Moved from abroad (%) - American Indian and Alaska Native
Geographical mobility - Moved from abroad (%) - Multirace
Geographical mobility - Moved from abroad (%) - Other Race
Place of birth for the foreign-born population - Ireland (%)
Place of birth for the foreign-born population - Denmark (%)
Place of birth for the foreign-born population - Norway (%)
Place of birth for the foreign-born population - Sweden (%)
Place of birth for the foreign-born population - United Kingdom (%)
Place of birth for the foreign-born population - England (%)
Place of birth for the foreign-born population - Scotland (%)
Place of birth for the foreign-born population - Other Northern Europe (%)
Place of birth for the foreign-born population - Austria (%)
Place of birth for the foreign-born population - Belgium (%)
Place of birth for the foreign-born population - France (%)
Place of birth for the foreign-born population - Germany (%)
Place of birth for the foreign-born population - Netherlands (%)
Place of birth for the foreign-born population - Switzerland (%)
Place of birth for the foreign-born population - Other Western Europe (%)
Place of birth for the foreign-born population - Greece (%)
Place of birth for the foreign-born population - Italy (%)
Place of birth for the foreign-born population - Portugal (%)
Place of birth for the foreign-born population - Spain (%)
Place of birth for the foreign-born population - Other Southern Europe (%)
Place of birth for the foreign-born population - Albania (%)
Place of birth for the foreign-born population - Belarus (%)
Place of birth for the foreign-born population - Bosnia and Herzegovina (%)
Place of birth for the foreign-born population - Bulgaria (%)
Place of birth for the foreign-born population - Croatia (%)
Place of birth for the foreign-born population - Czechoslovakia (%)
Place of birth for the foreign-born population - Hungary (%)
Place of birth for the foreign-born population - Latvia (%)
Place of birth for the foreign-born population - Lithuania (%)
Place of birth for the foreign-born population - North Macedonia (Macedonia) (%)
Place of birth for the foreign-born population - Moldova (%)
Place of birth for the foreign-born population - Poland (%)
Place of birth for the foreign-born population - Romania (%)
Place of birth for the foreign-born population - Russia (%)
Place of birth for the foreign-born population - Serbia (%)
Place of birth for the foreign-born population - Ukraine (%)
Place of birth for the foreign-born population - Other Eastern Europe (%)
Place of birth for the foreign-born population - China (%)
Place of birth for the foreign-born population - Hong Kong (%)
Place of birth for the foreign-born population - Taiwan (%)
Place of birth for the foreign-born population - Japan (%)
Place of birth for the foreign-born population - Korea (%)
Place of birth for the foreign-born population - Other Eastern Asia (%)
Place of birth for the foreign-born population - Afghanistan (%)
Place of birth for the foreign-born population - Bangladesh (%)
Place of birth for the foreign-born population - India (%)
Place of birth for the foreign-born population - Iran (%)
Place of birth for the foreign-born population - Kazakhstan (%)
Place of birth for the foreign-born population - Nepal (%)
Place of birth for the foreign-born population - Pakistan (%)
Place of birth for the foreign-born population - Sri Lanka (%)
Place of birth for the foreign-born population - Uzbekistan (%)
Place of birth for the foreign-born population - Other South Central Asia (%)
Place of birth for the foreign-born population - Burma (%)
Place of birth for the foreign-born population - Cambodia (%)
Place of birth for the foreign-born population - Indonesia (%)
Place of birth for the foreign-born population - Laos (%)
Place of birth for the foreign-born population - Malaysia (%)
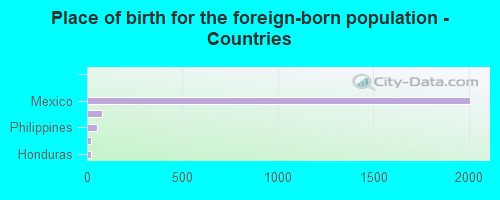
Place of birth for the foreign-born population - Philippines (%)
Place of birth for the foreign-born population - Singapore (%)
Place of birth for the foreign-born population - Thailand (%)
Place of birth for the foreign-born population - Vietnam (%)
Place of birth for the foreign-born population - Other South Eastern Asia (%)
Place of birth for the foreign-born population - Armenia (%)
Place of birth for the foreign-born population - Iraq (%)
Place of birth for the foreign-born population - Israel (%)
Place of birth for the foreign-born population - Jordan (%)
Place of birth for the foreign-born population - Kuwait (%)
Place of birth for the foreign-born population - Lebanon (%)
Place of birth for the foreign-born population - Saudi Arabia (%)
Place of birth for the foreign-born population - Syria (%)
Place of birth for the foreign-born population - Turkey (%)
Place of birth for the foreign-born population - Yemen (%)
Place of birth for the foreign-born population - Other Western Asia (%)
Place of birth for the foreign-born population - Eritrea (%)
Place of birth for the foreign-born population - Ethiopia (%)
Place of birth for the foreign-born population - Kenya (%)
Place of birth for the foreign-born population - Somalia (%)
Place of birth for the foreign-born population - Uganda (%)
Place of birth for the foreign-born population - Zimbabwe (%)
Place of birth for the foreign-born population - Other Eastern Africa (%)
Place of birth for the foreign-born population - Cameroon (%)
Place of birth for the foreign-born population - Congo (%)
Place of birth for the foreign-born population - Democratic Republic of Congo (Zaire) (%)
Place of birth for the foreign-born population - Other Middle Africa (%)
Place of birth for the foreign-born population - Egypt (%)
Place of birth for the foreign-born population - Morocco (%)
Place of birth for the foreign-born population - Sudan (%)
Place of birth for the foreign-born population - Other Northern Africa (%)
Place of birth for the foreign-born population - South Africa (%)
Place of birth for the foreign-born population - Other Southern Africa (%)
Place of birth for the foreign-born population - Cabo Verde (%)
Place of birth for the foreign-born population - Ghana (%)
Place of birth for the foreign-born population - Liberia (%)
Place of birth for the foreign-born population - Nigeria (%)
Place of birth for the foreign-born population - Senegal (%)
Place of birth for the foreign-born population - Sierra Leone (%)
Place of birth for the foreign-born population - Other Western Africa (%)
Place of birth for the foreign-born population - Australia (%)
Place of birth for the foreign-born population - New Zealand (%)
Place of birth for the foreign-born population - Fiji (%)
Place of birth for the foreign-born population - Micronesia (%)
Place of birth for the foreign-born population - Bahamas (%)
Place of birth for the foreign-born population - Barbados (%)
Place of birth for the foreign-born population - Cuba (%)
Place of birth for the foreign-born population - Dominica (%)
Place of birth for the foreign-born population - Dominican Republic (%)
Place of birth for the foreign-born population - Grenada (%)
Place of birth for the foreign-born population - Haiti (%)
Place of birth for the foreign-born population - Jamaica (%)
Place of birth for the foreign-born population - St. Vincent and the Grenadines (%)
Place of birth for the foreign-born population - Trinidad and Tobago (%)
Place of birth for the foreign-born population - West Indies (%)
Place of birth for the foreign-born population - Other Caribbean (%)
Place of birth for the foreign-born population - Belize (%)
Place of birth for the foreign-born population - Costa Rica (%)
Place of birth for the foreign-born population - El Salvador (%)
Place of birth for the foreign-born population - Guatemala (%)
Place of birth for the foreign-born population - Honduras (%)
Place of birth for the foreign-born population - Mexico (%)
Place of birth for the foreign-born population - Nicaragua (%)
Place of birth for the foreign-born population - Panama (%)
Place of birth for the foreign-born population - Other Central America (%)
Place of birth for the foreign-born population - Argentina (%)
Place of birth for the foreign-born population - Bolivia (%)
Place of birth for the foreign-born population - Brazil (%)
Place of birth for the foreign-born population - Chile (%)
Place of birth for the foreign-born population - Colombia (%)
Place of birth for the foreign-born population - Ecuador (%)
Place of birth for the foreign-born population - Guyana (%)
Place of birth for the foreign-born population - Peru (%)
Place of birth for the foreign-born population - Uruguay (%)
Place of birth for the foreign-born population - Venezuela (%)
Place of birth for the foreign-born population - Other South America (%)
Place of birth for the foreign-born population - Canada (%)
Place of birth for the foreign-born population - Other Northern America (%)
Place of birth for the foreign-born population - Other (%)
Latest news about races in Andrews, TX collected exclusively by city-data.com from local newspapers, TV, and radio stations
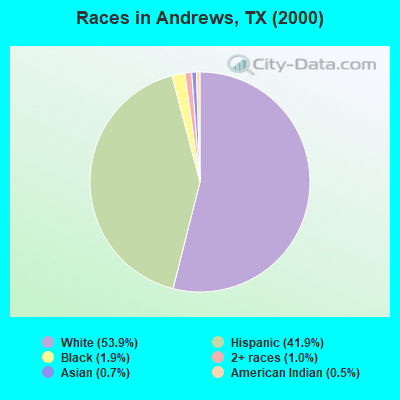
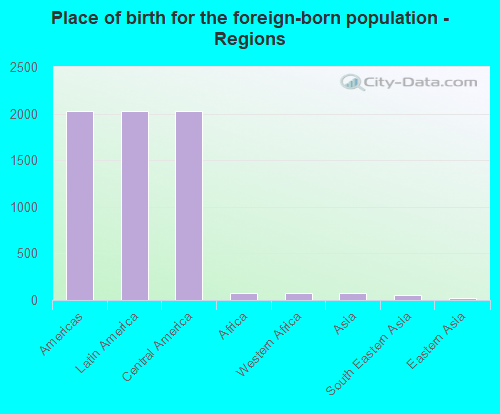
According to 2022 data, the most numerous races in Andrews, TX are Hispanic (7,394 residents), White alone (5,518 residents), and Black alone (424 residents). 65.1% of Andrews residents speak English at home. 16.0% of Andrews, TX residents are foreign-born (14.6% born in Latin America), which is 6.0% less than the foreign-born rate of 17.0% across the entire state of Texas.
Race distribution in Andrews
2000 2022
10,933,313 52.4% White alone 6,669,666 32.0% Hispanic 2,364,255 11.3% Black alone 554,445 2.7% Asian alone 230,567 1.1% Two or more races 68,859 0.3% American Indian alone 19,958 0.10% Other race alone 10,757 0.05% Native Hawaiian and Other
12,070,642 40.2% Hispanic 11,683,430 38.9% White alone 3,508,706 11.7% Black alone 1,608,173 5.4% Asian alone 956,560 3.2% Two or more races 125,763 0.4% Other race alone 47,023 0.2% American Indian alone 29,275 0.10% Native Hawaiian and Other
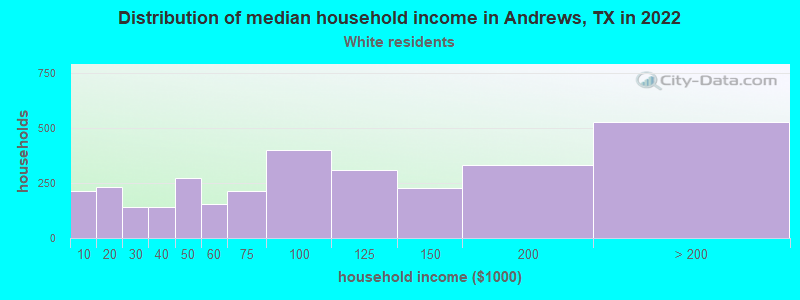
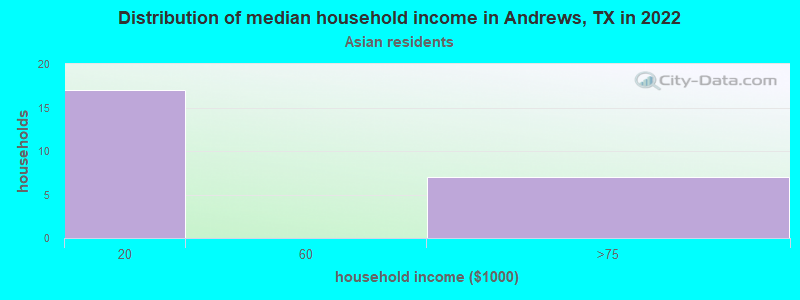
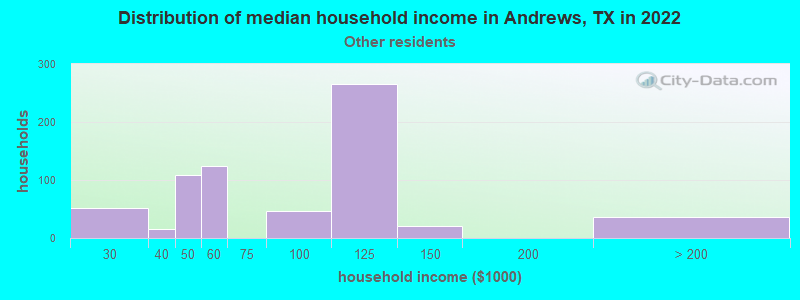
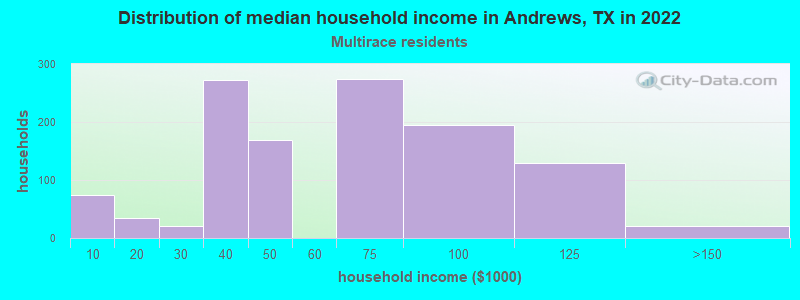
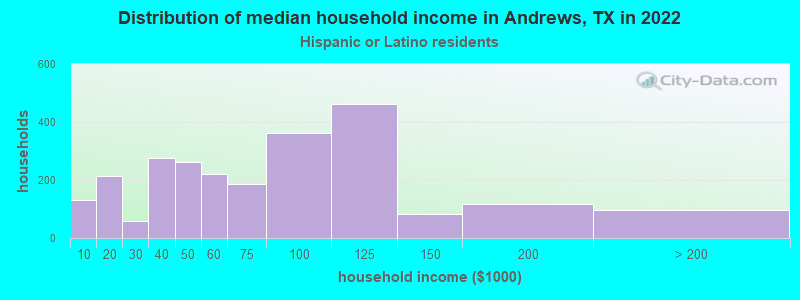
Income and house value in Andrews Median household income in 2022 $96,275 White non-Hispanic householders$80,742 Some other race householders$64,790 Two or more races householders$71,693 Hispanic or Latino race householdersMedian 2022 house value $252,300 White Non-Hispanic householders$174,092 Black or African American householders$241,051 American Indian or Alaska Native householders$174,628 Some other race householders$169,271 Two or more races householders$171,414 Hispanic or Latino householders
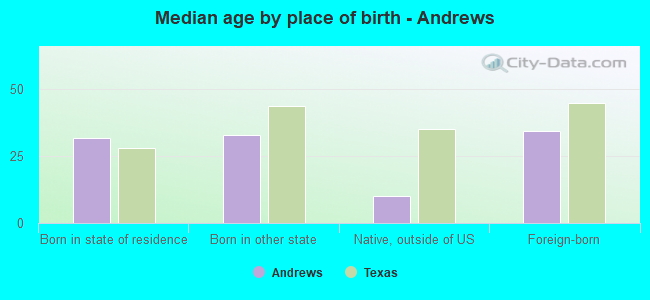
Median age by race in Andrews
35.5 Median age for White residents34.4 36.2 61.9 Median age for Black or African American residents50.3 62.2 -684,418,145.3 Median age for American Indian / Alaska Native residents-682,445,758.7 -684,418,145.3 49.3 Median age for Asian residents-683,426,442.5 55.0 -581,560,283.1 Median age for Native Hawaiian / Pacific Islander residents-612,729,233.5 -577,777,777.2 29.0 Median age for Other race residents29.0 28.8 25.4 Median age for Two or more races residents31.9 17.1 36.1 Median age for White alone residents35.7 38.1 26.2 Median age for Hispanic or Latino residents27.2 25.4
Owner/renter occupied households by race in Andrews
House owners and renters - White residents 2,218 70.4% Owner occupied933 29.6% Renter occupiedHouse owners and renters - Black or African American residents 181 70.2% Owner occupied77 29.8% Renter occupiedHouse owners and renters - Asian residents 24 100.0% Owner occupiedHouse owners and renters - Other race residents 391 57.5% Owner occupied289 42.5% Renter occupiedHouse owners and renters - Two or more races residents 963 82.1% Owner occupied210 17.9% Renter occupiedHouse owners and renters - White alone residents 1,637 68.7% Owner occupied744 31.3% Renter occupiedHouse owners and renters - Hispanic or Latino residents 1,737 70.1% Owner occupied739 29.9% Renter occupied
Language usage in Andrews
English speakers - Total 65.1% of residents of Andrews speak English at home.
33.7% of residents speak Spanish at home 2,573 60.7% Speak English very well1,663 39.3% Speak English less than very well1.0% of residents speak other language at home 120 97.6% Speak English very well3 2.4% Speak English less than very well
English speakers - Born in the United States 75.3% of residents of Andrews speak English at home.
24.5% of residents speak Spanish at home 567 84.6% Speak English very well103 15.4% Speak English less than very well0.1% of residents speak other language at home 2 100.0% Speak English very well
All residents speak only English at home
English speakers - Foreign-born 7.3% of residents of Andrews speak English at home.
86.3% of residents speak Spanish at home 361 19.5% Speak English very well1,491 80.5% Speak English less than very well5.6% of residents speak other language at home 118 97.5% Speak English very well3 2.5% Speak English less than very well
White (Caucasian) - Speak only English Native:
88.8% (5,877)Foreign-born:
2.1% (9)
White (Caucasian) - Speak another language Native:
10.8% (712)Foreign-born:
87.2% (365)
Asian - Speak only English Native:
100.0% (15)Foreign-born:
61.4% (49)
Other race - Speak another language Native:
34.5% (357)Foreign-born:
99.5% (745)
Two or more races - Speak only English Native:
50.2% (1,191)Foreign-born:
20.9% (155)
Two or more races - Speak another language Native:
49.4% (1,171)Foreign-born:
78.2% (577)
White alone - Speak only English Native:
99.5% (5,110)Foreign-born:
68.9% (11)
White alone - Speak another language Native:
0.7% (34)Foreign-born:
31.2% (5)
Hispanic or Latino - Speak only English Native:
49.9% (2,339)Foreign-born:
5.4% (106)
Hispanic or Latino - Speak another language Native:
50.4% (2,365)Foreign-born:
94.6% (1,860)
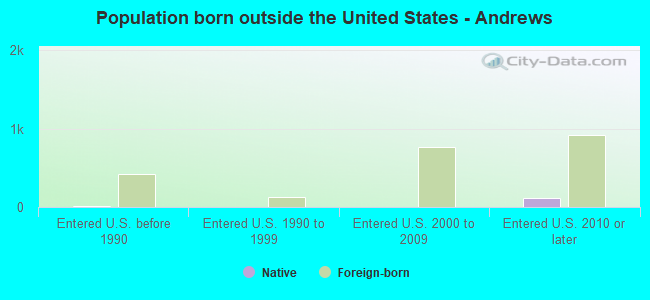
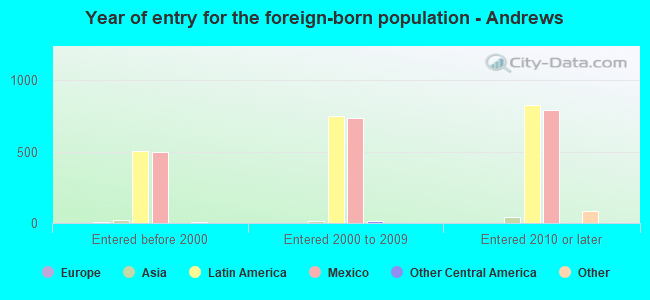
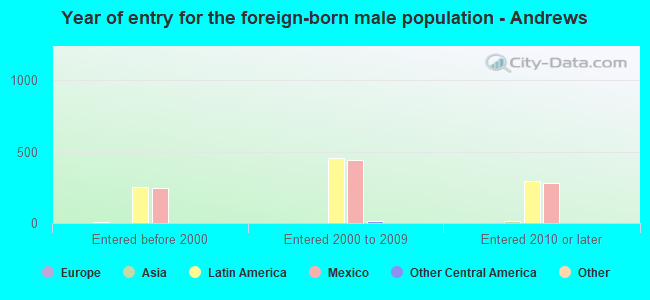
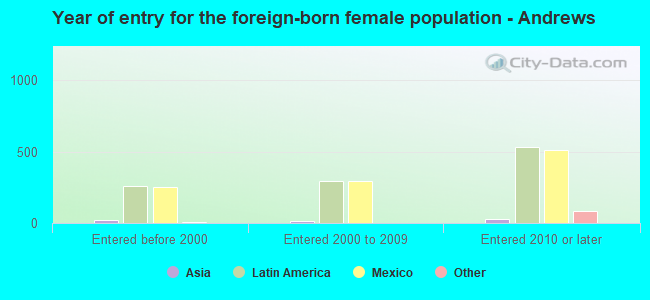
Foreign-born residents in Andrews 2,197 residents are foreign born (14.6% Latin America ).
This city:
16.0%Texas:
17.1%
Marital status for residents in Andrews Marital status - White (Caucasian) population 15 years and over
Males 25.7% Never married62.1% Now married1.4% Separated1.7% Widowed9.2% DivorcedFemales 22.9% Never married55.8% Now married3.1% Separated7.0% Widowed11.1% DivorcedWomen who gave birth in the past 12 months Now married:
81.3% (172)Unmarried:
18.7% (40)
Women who did not give birth in the past 12 months Now married:
52.8% (810)Unmarried:
47.2% (723)
Marital status - Black or African American population 15 years and over
Males 23.8% Never married12.7% Now married4.8% Separated0.0% Widowed58.7% DivorcedFemales 94.9% Never married5.1% Now married0.0% Separated0.0% Widowed0.0% DivorcedWomen who did not give birth in the past 12 months Now married:
19.8% (18)Unmarried:
80.2% (74)
Marital status - Other race population 15 years and over
Males 27.0% Never married67.5% Now married0.0% Separated0.0% Widowed5.4% DivorcedFemales 8.8% Never married91.2% Now married0.0% Separated0.0% Widowed0.0% DivorcedWomen who did not give birth in the past 12 months Now married:
90.4% (618)Unmarried:
9.6% (66)
Marital status - Two or more races population 15 years and over
Males 10.9% Never married70.2% Now married7.2% Separated1.8% Widowed9.9% DivorcedFemales 30.6% Never married51.7% Now married0.0% Separated13.1% Widowed4.5% DivorcedWomen who gave birth in the past 12 months Now married:
100.0% (137)Unmarried:
0.0% (0)
Women who did not give birth in the past 12 months Now married:
49.6% (381)Unmarried:
50.4% (388)
Marital status - White alone, not Hispanic / Latino population 15 years and over
Males 20.5% Never married60.5% Now married2.3% Separated2.8% Widowed14.0% DivorcedFemales 18.8% Never married51.4% Now married3.8% Separated10.7% Widowed15.3% DivorcedWomen who gave birth in the past 12 months Now married:
67.1% (99)Unmarried:
32.9% (49)
Women who did not give birth in the past 12 months Now married:
52.0% (573)Unmarried:
48.0% (529)
Marital status - Hispanic or Latino population 15 years and over
Males 26.5% Never married67.0% Now married1.8% Separated0.0% Widowed4.6% DivorcedFemales 25.7% Never married67.6% Now married0.9% Separated4.0% Widowed1.7% DivorcedWomen who gave birth in the past 12 months Now married:
100.0% (205)Unmarried:
0.0% (0)
Women who did not give birth in the past 12 months Now married:
64.8% (1,154)Unmarried:
35.2% (628)
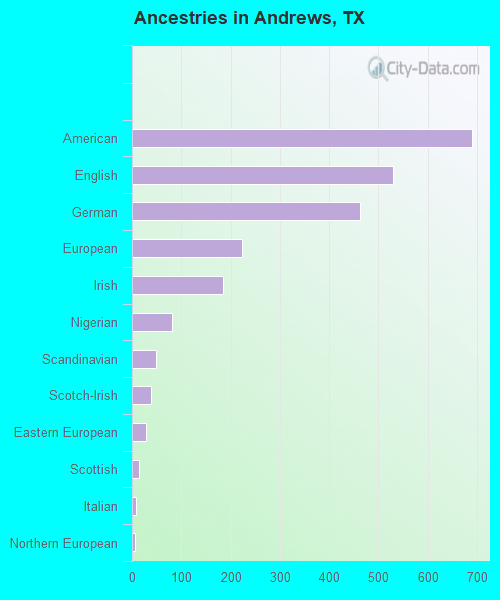
Ancestries in Andrews
690 8.7% American529 6.7% English463 5.8% German223 2.8% European184 2.3% Irish82 1.0% Nigerian48 0.6% Scandinavian39 0.5% Scotch-Irish29 0.4% Eastern European15 0.2% Scottish9 0.1% Italian7 0.09% Northern European5 0.06% French Canadian5 0.06% Polish4 0.05% British2 0.03% Dutch
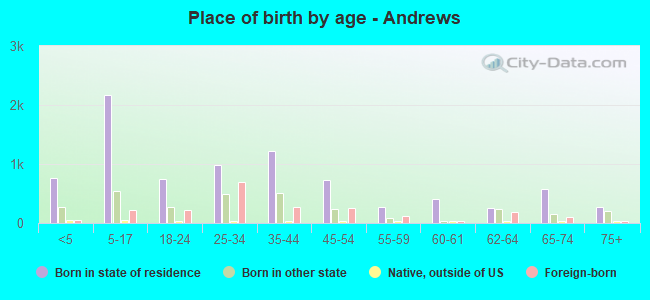
Children Nativity (place of birth) in Andrews
Children under 6 years - Living with two parents Both parents native 434 100.0% NativeBoth parents foreign-born 166 75.1% Native55 24.9% Foreign-bornOne native, one foreign-born parent 186 100.0% NativeChildren under 6 years - Living with one parent Native parent 323 100.0% NativeForeign-born parent 66 100.0% NativeChildren 6 to 17 years - Living with two parents Both parents native 1,442 100.0% Native0 0.0% Foreign-bornBoth parents foreign-born 100 39.9% Native151 60.1% Foreign-bornOne native, one foreign-born parent 329 95.7% Native15 4.3% Foreign-bornChildren 6 to 17 years - Living with one parent Native parent 448 96.2% Native17 3.8% Foreign-bornForeign-born parent 96 69.8% Native42 30.2% Foreign-born
Grandparents responsible for own grandchildren in Andrews
Grandparents (30 to 59 years) White / Caucasian 23 100.0% Not responsible for grandchildrenTwo or more races 38 100.0% Not responsible for grandchildrenWhite alone, not Hispanic / Latino 37 100.0% Not responsible for grandchildrenHispanic or Latino 22 100.0% Not responsible for grandchildrenGrandparents (60 years and over) White / Caucasian 82 84.8% Responsible for grandchildren15 15.2% Not responsible for grandchildrenTwo or more races 81 100.0% Not responsible for grandchildrenWhite alone, not Hispanic / Latino 25 55.2% Responsible for grandchildren20 44.8% Not responsible for grandchildrenHispanic or Latino 81 64.7% Responsible for grandchildren44 35.3% Not responsible for grandchildren