Races in Annandale, Virginia (VA) Detailed Stats
Data:
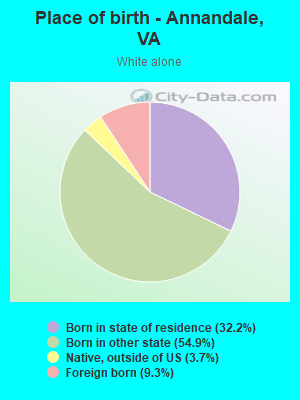
Races - White alone (%)
Races - White alone (% change since 2000)
Races - Black alone (%)
Races - Black alone (% change since 2000)
Races - American Indian alone (%)
Races - American Indian alone (% change since 2000)
Races - Asian alone (%)
Races - Asian alone (% change since 2000)
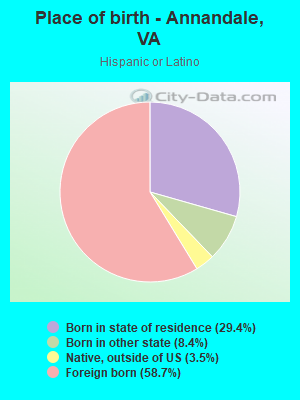
Races - Hispanic (%)
Races - Hispanic (% change since 2000)
Races - Native Hawaiian and Other Pacific Islander alone (%)
Races - Native Hawaiian and Other Pacific Islander alone (% change since 2000)
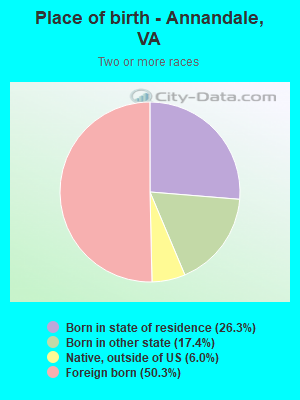
Races - Two or more races(%)
Races - Two or more races(% change since 2000)
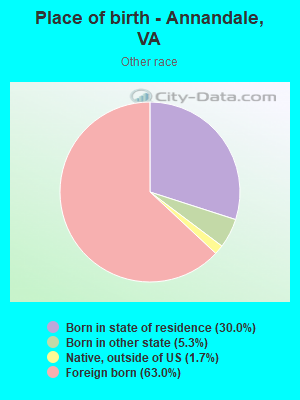
Races - Other race alone (%)
Races - Other race alone (% change since 2000)
Racial diversity
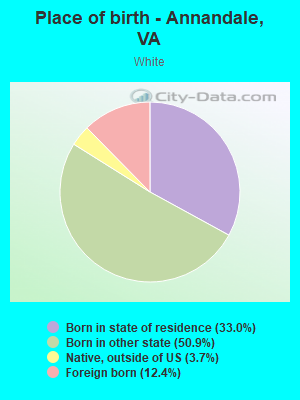
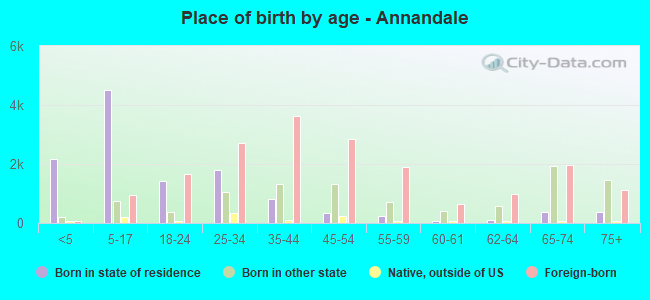
Place of birth - Born in state of residence (%)
Place of birth - Born in state of residence (%) - White
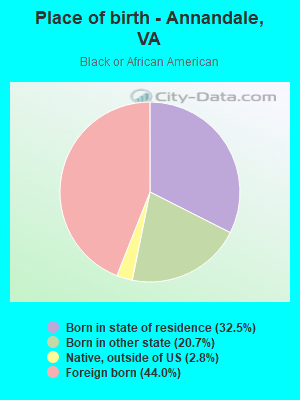
Place of birth - Born in state of residence (%) - Black or African American
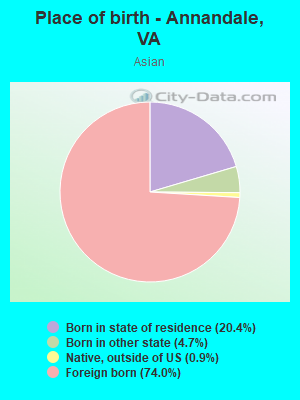
Place of birth - Born in state of residence (%) - Asian
Place of birth - Born in state of residence (%) - Hispanic or Latino
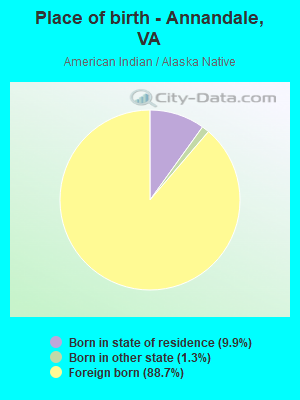
Place of birth - Born in state of residence (%) - American Indian and Alaska Native
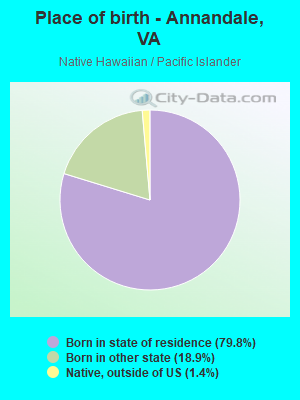
Place of birth - Born in state of residence (%) - Multirace
Place of birth - Born in state of residence (%) - Other Race
Place of birth - Born in other state (%)
Place of birth - Born in other state (%) - White
Place of birth - Born in other state (%) - Black or African American
Place of birth - Born in other state (%) - Asian
Place of birth - Born in other state (%) - Hispanic or Latino
Place of birth - Born in other state (%) - American Indian and Alaska Native
Place of birth - Born in other state (%) - Multirace
Place of birth - Born in other state (%) - Other Race
Place of birth - Native, outside of US (%)
Place of birth - Native, outside of US (%) - White
Place of birth - Native, outside of US (%) - Black or African American
Place of birth - Native, outside of US (%) - Asian
Place of birth - Native, outside of US (%) - Hispanic or Latino
Place of birth - Native, outside of US (%) - American Indian and Alaska Native
Place of birth - Native, outside of US (%) - Multirace
Place of birth - Native, outside of US (%) - Other Race
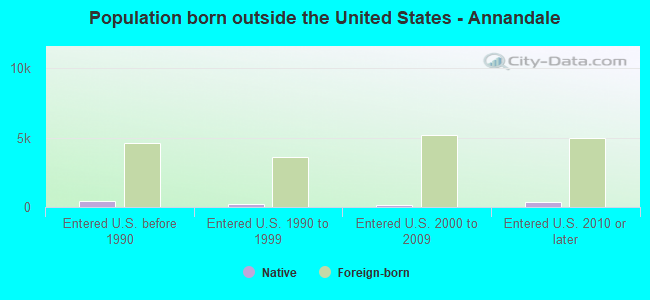
Place of birth - Foreign born (%)
Place of birth - Foreign born (%) - White
Place of birth - Foreign born (%) - Black or African American
Place of birth - Foreign born (%) - Asian
Place of birth - Foreign born (%) - Hispanic or Latino
Place of birth - Foreign born (%) - American Indian and Alaska Native
Place of birth - Foreign born (%) - Multirace
Place of birth - Foreign born (%) - Other Race
Residents speaking English at home (%)
Residents speaking English at home - Born in the United States (%)
Residents speaking English at home - Native, born elsewhere (%)
Residents speaking English at home - Foreign born (%)
Residents speaking Spanish at home (%)
Residents speaking Spanish at home - Born in the United States (%)
Residents speaking Spanish at home - Native, born elsewhere (%)
Residents speaking Spanish at home - Foreign born (%)
Residents speaking other language at home (%)
Residents speaking other language at home - Born in the United States (%)
Residents speaking other language at home - Native, born elsewhere (%)
Residents speaking other language at home - Foreign born (%)
Marital status - Never married (%)
Marital status - Now married (%)
Marital status - Separated (%)
Marital status - Widowed (%)
Marital status - Divorced (%)
Ancestries Reported - Arab (%)
Ancestries Reported - Czech (%)
Ancestries Reported - Danish (%)
Ancestries Reported - Dutch (%)
Ancestries Reported - English (%)
Ancestries Reported - French (%)
Ancestries Reported - French Canadian (%)
Ancestries Reported - German (%)
Ancestries Reported - Greek (%)
Ancestries Reported - Hungarian (%)
Ancestries Reported - Irish (%)
Ancestries Reported - Italian (%)
Ancestries Reported - Lithuanian (%)
Ancestries Reported - Norwegian (%)
Ancestries Reported - Polish (%)
Ancestries Reported - Portuguese (%)
Ancestries Reported - Russian (%)
Ancestries Reported - Scotch-Irish (%)
Ancestries Reported - Scottish (%)
Ancestries Reported - Slovak (%)
Ancestries Reported - Subsaharan African (%)
Ancestries Reported - Swedish (%)
Ancestries Reported - Swiss (%)
Ancestries Reported - Ukrainian (%)
Ancestries Reported - United States (%)
Ancestries Reported - Welsh (%)
Ancestries Reported - West Indian (%)
Ancestries Reported - Other (%)
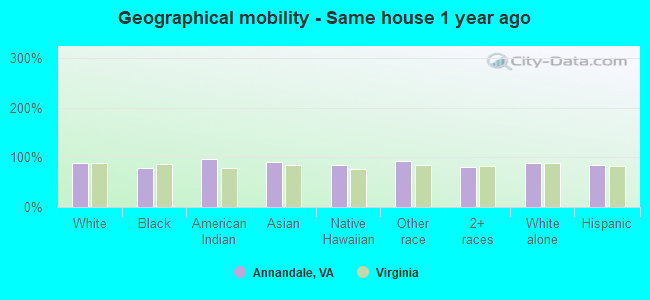
Geographical mobility - Same house 1 year ago (%)
Geographical mobility - Same house 1 year ago (%) - White
Geographical mobility - Same house 1 year ago (%) - Black or African American
Geographical mobility - Same house 1 year ago (%) - Asian
Geographical mobility - Same house 1 year ago (%) - Hispanic or Latino
Geographical mobility - Same house 1 year ago (%) - American Indian and Alaska Native
Geographical mobility - Same house 1 year ago (%) - Multirace
Geographical mobility - Same house 1 year ago (%) - Other Race
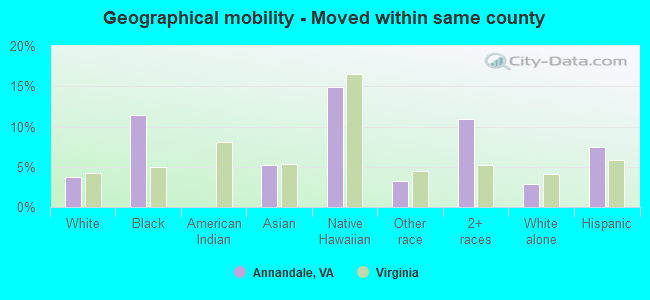
Geographical mobility - Moved within same county (%)
Geographical mobility - Moved within same county (%) - White
Geographical mobility - Moved within same county (%) - Black or African American
Geographical mobility - Moved within same county (%) - Asian
Geographical mobility - Moved within same county (%) - Hispanic or Latino
Geographical mobility - Moved within same county (%) - American Indian and Alaska Native
Geographical mobility - Moved within same county (%) - Multirace
Geographical mobility - Moved within same county (%) - Other Race
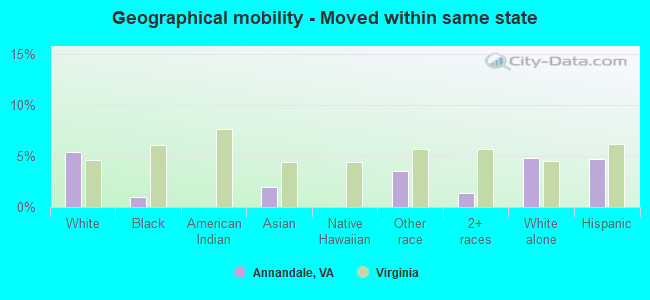
Geographical mobility - Moved from different county within same state (%)
Geographical mobility - Moved from different county within same state (%) - White
Geographical mobility - Moved from different county within same state (%) - Black or African American
Geographical mobility - Moved from different county within same state (%) - Asian
Geographical mobility - Moved from different county within same state (%) - Hispanic or Latino
Geographical mobility - Moved from different county within same state (%) - American Indian and Alaska Native
Geographical mobility - Moved from different county within same state (%) - Multirace
Geographical mobility - Moved from different county within same state (%) - Other Race
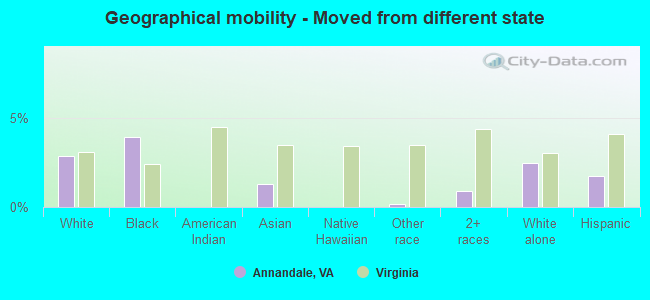
Geographical mobility - Moved from different state (%)
Geographical mobility - Moved from different state (%) - White
Geographical mobility - Moved from different state (%) - Black or African American
Geographical mobility - Moved from different state (%) - Asian
Geographical mobility - Moved from different state (%) - Hispanic or Latino
Geographical mobility - Moved from different state (%) - American Indian and Alaska Native
Geographical mobility - Moved from different state (%) - Multirace
Geographical mobility - Moved from different state (%) - Other Race
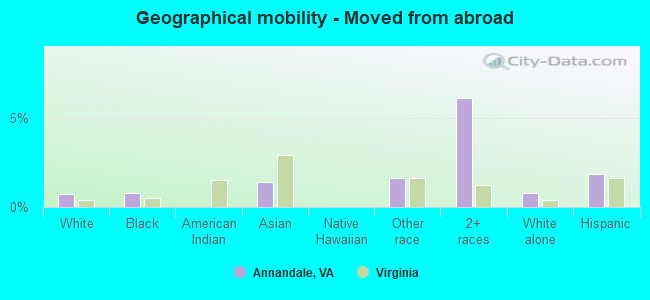
Geographical mobility - Moved from abroad (%)
Geographical mobility - Moved from abroad (%) - White
Geographical mobility - Moved from abroad (%) - Black or African American
Geographical mobility - Moved from abroad (%) - Asian
Geographical mobility - Moved from abroad (%) - Hispanic or Latino
Geographical mobility - Moved from abroad (%) - American Indian and Alaska Native
Geographical mobility - Moved from abroad (%) - Multirace
Geographical mobility - Moved from abroad (%) - Other Race
Place of birth for the foreign-born population - Ireland (%)
Place of birth for the foreign-born population - Denmark (%)
Place of birth for the foreign-born population - Norway (%)
Place of birth for the foreign-born population - Sweden (%)
Place of birth for the foreign-born population - United Kingdom (%)
Place of birth for the foreign-born population - England (%)
Place of birth for the foreign-born population - Scotland (%)
Place of birth for the foreign-born population - Other Northern Europe (%)
Place of birth for the foreign-born population - Austria (%)
Place of birth for the foreign-born population - Belgium (%)
Place of birth for the foreign-born population - France (%)
Place of birth for the foreign-born population - Germany (%)
Place of birth for the foreign-born population - Netherlands (%)
Place of birth for the foreign-born population - Switzerland (%)
Place of birth for the foreign-born population - Other Western Europe (%)
Place of birth for the foreign-born population - Greece (%)
Place of birth for the foreign-born population - Italy (%)
Place of birth for the foreign-born population - Portugal (%)
Place of birth for the foreign-born population - Spain (%)
Place of birth for the foreign-born population - Other Southern Europe (%)
Place of birth for the foreign-born population - Albania (%)
Place of birth for the foreign-born population - Belarus (%)
Place of birth for the foreign-born population - Bosnia and Herzegovina (%)
Place of birth for the foreign-born population - Bulgaria (%)
Place of birth for the foreign-born population - Croatia (%)
Place of birth for the foreign-born population - Czechoslovakia (%)
Place of birth for the foreign-born population - Hungary (%)
Place of birth for the foreign-born population - Latvia (%)
Place of birth for the foreign-born population - Lithuania (%)
Place of birth for the foreign-born population - North Macedonia (Macedonia) (%)
Place of birth for the foreign-born population - Moldova (%)
Place of birth for the foreign-born population - Poland (%)
Place of birth for the foreign-born population - Romania (%)
Place of birth for the foreign-born population - Russia (%)
Place of birth for the foreign-born population - Serbia (%)
Place of birth for the foreign-born population - Ukraine (%)
Place of birth for the foreign-born population - Other Eastern Europe (%)
Place of birth for the foreign-born population - China (%)
Place of birth for the foreign-born population - Hong Kong (%)
Place of birth for the foreign-born population - Taiwan (%)
Place of birth for the foreign-born population - Japan (%)
Place of birth for the foreign-born population - Korea (%)
Place of birth for the foreign-born population - Other Eastern Asia (%)
Place of birth for the foreign-born population - Afghanistan (%)
Place of birth for the foreign-born population - Bangladesh (%)
Place of birth for the foreign-born population - India (%)
Place of birth for the foreign-born population - Iran (%)
Place of birth for the foreign-born population - Kazakhstan (%)
Place of birth for the foreign-born population - Nepal (%)
Place of birth for the foreign-born population - Pakistan (%)
Place of birth for the foreign-born population - Sri Lanka (%)
Place of birth for the foreign-born population - Uzbekistan (%)
Place of birth for the foreign-born population - Other South Central Asia (%)
Place of birth for the foreign-born population - Burma (%)
Place of birth for the foreign-born population - Cambodia (%)
Place of birth for the foreign-born population - Indonesia (%)
Place of birth for the foreign-born population - Laos (%)
Place of birth for the foreign-born population - Malaysia (%)
Place of birth for the foreign-born population - Philippines (%)
Place of birth for the foreign-born population - Singapore (%)
Place of birth for the foreign-born population - Thailand (%)
Place of birth for the foreign-born population - Vietnam (%)
Place of birth for the foreign-born population - Other South Eastern Asia (%)
Place of birth for the foreign-born population - Armenia (%)
Place of birth for the foreign-born population - Iraq (%)
Place of birth for the foreign-born population - Israel (%)
Place of birth for the foreign-born population - Jordan (%)
Place of birth for the foreign-born population - Kuwait (%)
Place of birth for the foreign-born population - Lebanon (%)
Place of birth for the foreign-born population - Saudi Arabia (%)
Place of birth for the foreign-born population - Syria (%)
Place of birth for the foreign-born population - Turkey (%)
Place of birth for the foreign-born population - Yemen (%)
Place of birth for the foreign-born population - Other Western Asia (%)
Place of birth for the foreign-born population - Eritrea (%)
Place of birth for the foreign-born population - Ethiopia (%)
Place of birth for the foreign-born population - Kenya (%)
Place of birth for the foreign-born population - Somalia (%)
Place of birth for the foreign-born population - Uganda (%)
Place of birth for the foreign-born population - Zimbabwe (%)
Place of birth for the foreign-born population - Other Eastern Africa (%)
Place of birth for the foreign-born population - Cameroon (%)
Place of birth for the foreign-born population - Congo (%)
Place of birth for the foreign-born population - Democratic Republic of Congo (Zaire) (%)
Place of birth for the foreign-born population - Other Middle Africa (%)
Place of birth for the foreign-born population - Egypt (%)
Place of birth for the foreign-born population - Morocco (%)
Place of birth for the foreign-born population - Sudan (%)
Place of birth for the foreign-born population - Other Northern Africa (%)
Place of birth for the foreign-born population - South Africa (%)
Place of birth for the foreign-born population - Other Southern Africa (%)
Place of birth for the foreign-born population - Cabo Verde (%)
Place of birth for the foreign-born population - Ghana (%)
Place of birth for the foreign-born population - Liberia (%)
Place of birth for the foreign-born population - Nigeria (%)
Place of birth for the foreign-born population - Senegal (%)
Place of birth for the foreign-born population - Sierra Leone (%)
Place of birth for the foreign-born population - Other Western Africa (%)
Place of birth for the foreign-born population - Australia (%)
Place of birth for the foreign-born population - New Zealand (%)
Place of birth for the foreign-born population - Fiji (%)
Place of birth for the foreign-born population - Micronesia (%)
Place of birth for the foreign-born population - Bahamas (%)
Place of birth for the foreign-born population - Barbados (%)
Place of birth for the foreign-born population - Cuba (%)
Place of birth for the foreign-born population - Dominica (%)
Place of birth for the foreign-born population - Dominican Republic (%)
Place of birth for the foreign-born population - Grenada (%)
Place of birth for the foreign-born population - Haiti (%)
Place of birth for the foreign-born population - Jamaica (%)
Place of birth for the foreign-born population - St. Vincent and the Grenadines (%)
Place of birth for the foreign-born population - Trinidad and Tobago (%)
Place of birth for the foreign-born population - West Indies (%)
Place of birth for the foreign-born population - Other Caribbean (%)
Place of birth for the foreign-born population - Belize (%)
Place of birth for the foreign-born population - Costa Rica (%)
Place of birth for the foreign-born population - El Salvador (%)
Place of birth for the foreign-born population - Guatemala (%)
Place of birth for the foreign-born population - Honduras (%)
Place of birth for the foreign-born population - Mexico (%)
Place of birth for the foreign-born population - Nicaragua (%)
Place of birth for the foreign-born population - Panama (%)
Place of birth for the foreign-born population - Other Central America (%)
Place of birth for the foreign-born population - Argentina (%)
Place of birth for the foreign-born population - Bolivia (%)
Place of birth for the foreign-born population - Brazil (%)
Place of birth for the foreign-born population - Chile (%)
Place of birth for the foreign-born population - Colombia (%)
Place of birth for the foreign-born population - Ecuador (%)
Place of birth for the foreign-born population - Guyana (%)
Place of birth for the foreign-born population - Peru (%)
Place of birth for the foreign-born population - Uruguay (%)
Place of birth for the foreign-born population - Venezuela (%)
Place of birth for the foreign-born population - Other South America (%)
Place of birth for the foreign-born population - Canada (%)
Place of birth for the foreign-born population - Other Northern America (%)
Place of birth for the foreign-born population - Other (%)
Latest news about races in Annandale, VA collected exclusively by city-data.com from local newspapers, TV, and radio stations
According to 2022 data, the most numerous races in Annandale, VA are White alone (13,026 residents), Black alone (3,942 residents), and Hispanic (13,804 residents). 42.7% of Annandale residents speak English at home. 43.9% of Annandale, VA residents are foreign-born (19.6% born in Latin America, 18.7% born in Asia), which is 72.6% greater than the foreign-born rate of 12.0% across the entire state of Virginia.
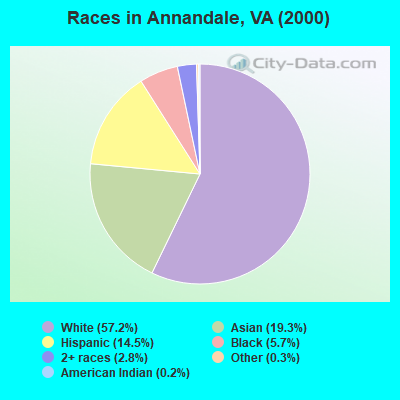
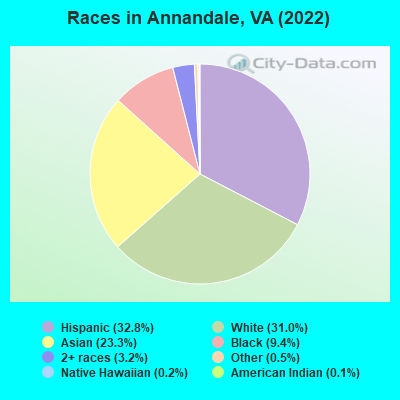
Race distribution in Annandale
2000 2022
31,453 57.2% White alone 10,623 19.3% Asian alone 7,966 14.5% Hispanic 3,128 5.7% Black alone 1,524 2.8% Two or more races 147 0.3% Other race alone 114 0.2% American Indian alone 39 0.07% Native Hawaiian and Other
13,804 32.8% Hispanic 13,026 31.0% White alone 9,805 23.3% Asian alone 3,942 9.4% Black alone 1,345 3.2% Two or more races 211 0.5% Other race alone 87 0.2% Native Hawaiian and Other 61 0.1% American Indian alone
2000 2022
4,965,637 70.2% White alone 1,376,378 19.4% Black alone 329,540 4.7% Hispanic 259,277 3.7% Asian alone 114,022 1.6% Two or more races 18,596 0.3% American Indian alone 11,685 0.2% Other race alone 3,380 0.05% Native Hawaiian and Other
5,095,130 58.7% White alone 1,594,785 18.4% Black alone 905,750 10.4% Hispanic 602,881 6.9% Asian alone 406,047 4.7% Two or more races 60,419 0.7% Other race alone 11,738 0.1% American Indian alone 6,869 0.08% Native Hawaiian and Other
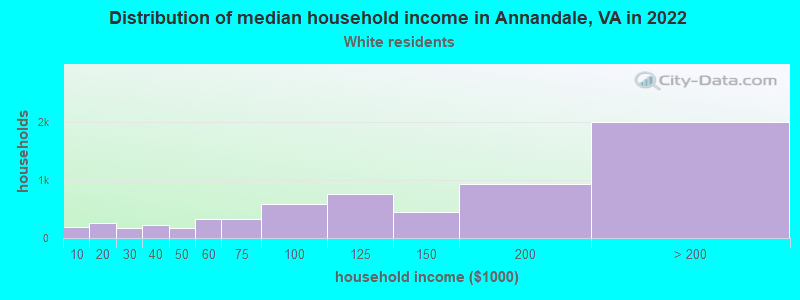
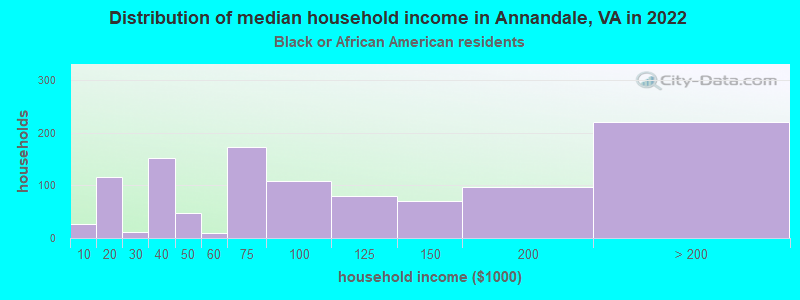
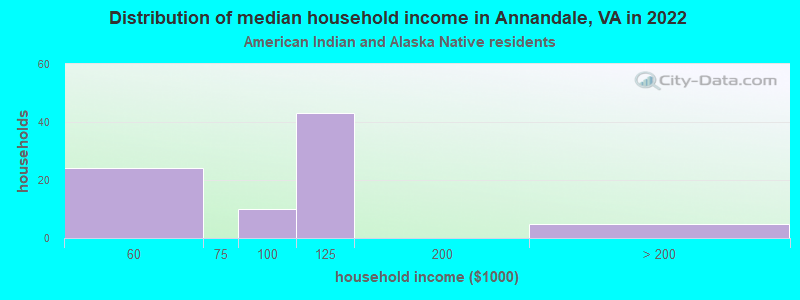
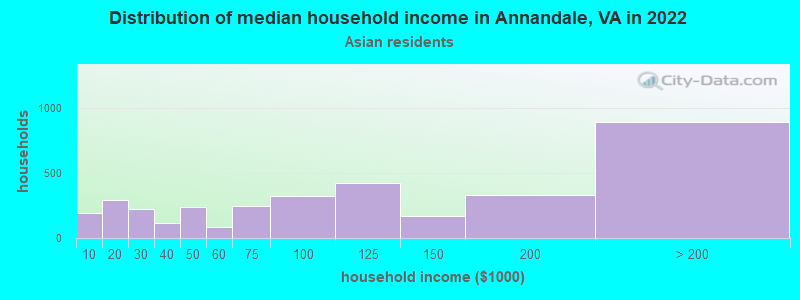
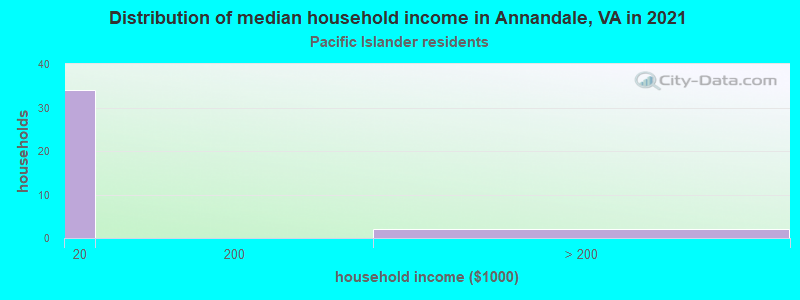
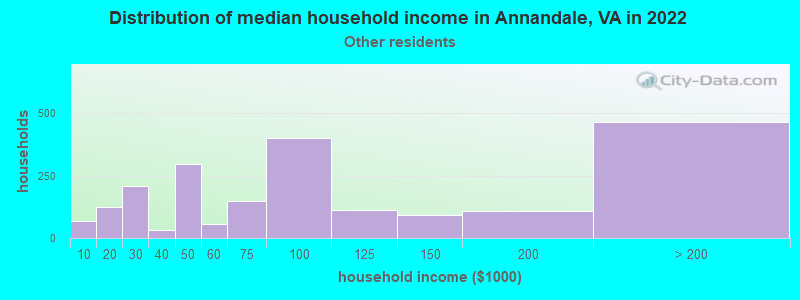
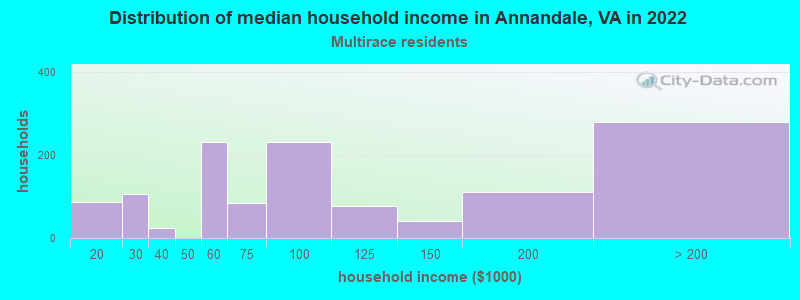
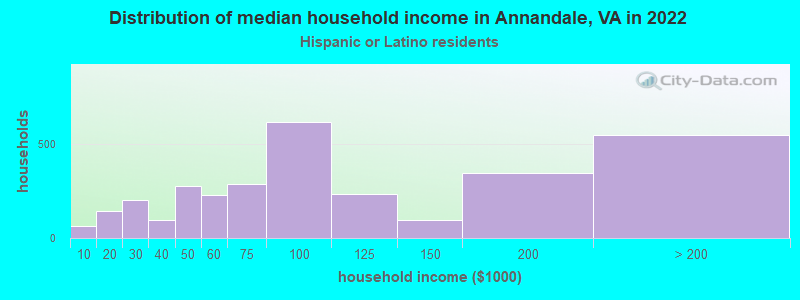
Income and house value in Annandale Median household income in 2022 $138,062 White non-Hispanic householders$77,236 Black householders$104,995 American Indian and Alaska Native householders$97,587 Asian householders$81,839 Some other race householders$82,921 Two or more races householders$79,294 Hispanic or Latino race householdersMedian 2022 house value $711,383 White Non-Hispanic householders$598,373 Black or African American householders$470,875 American Indian or Alaska Native householders $590,260 Asian householders$532,306 Some other race householders$608,805 Two or more races householders$556,357 Hispanic or Latino householders
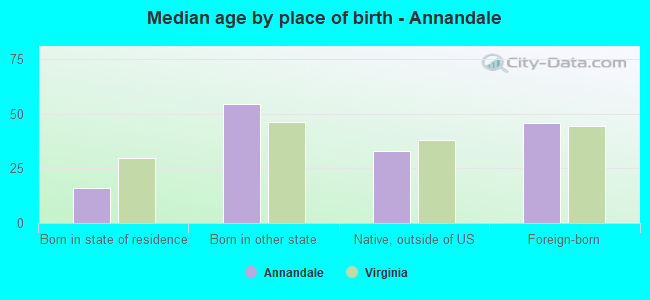
Median age by race in Annandale
48.5 Median age for White residents47.0 51.2 35.5 Median age for Black or African American residents37.9 35.5 32.4 Median age for American Indian / Alaska Native residents40.4 28.7 43.7 Median age for Asian residents42.3 43.9 18.4 Median age for Native Hawaiian / Pacific Islander residents11.6 37.3 32.1 Median age for Other race residents30.3 33.0 40.2 Median age for Two or more races residents40.3 42.5 52.4 Median age for White alone residents49.1 54.5 32.8 Median age for Hispanic or Latino residents31.4 35.1
Owner/renter occupied households by race in Annandale
House owners and renters - White residents 4,913 77.0% Owner occupied1,471 23.0% Renter occupiedHouse owners and renters - Black or African American residents 350 31.7% Owner occupied756 68.3% Renter occupiedHouse owners and renters - American Indian / Alaska Native residents 40 48.1% Owner occupied43 51.9% Renter occupiedHouse owners and renters - Asian residents 2,334 66.9% Owner occupied1,156 33.1% Renter occupiedHouse owners and renters - Native Hawaiian / Pacific Islander residents 2 6.8% Owner occupied27 93.2% Renter occupiedHouse owners and renters - Other race residents 760 35.8% Owner occupied1,364 64.2% Renter occupiedHouse owners and renters - Two or more races residents 841 66.0% Owner occupied433 34.0% Renter occupiedHouse owners and renters - White alone residents 4,583 79.6% Owner occupied1,175 20.4% Renter occupiedHouse owners and renters - Hispanic or Latino residents 1,468 44.8% Owner occupied1,811 55.2% Renter occupied
Language usage in Annandale
English speakers - Total 42.7% of residents of Annandale speak English at home.
28.4% of residents speak Spanish at home 5,225 46.5% Speak English very well6,009 53.5% Speak English less than very well28.3% of residents speak other language at home 6,449 57.7% Speak English very well4,734 42.3% Speak English less than very well
English speakers - Born in the United States 88.5% of residents of Annandale speak English at home.
6.5% of residents speak Spanish at home 444 69.2% Speak English very well198 30.8% Speak English less than very well5.4% of residents speak other language at home 486 91.4% Speak English very well46 8.6% Speak English less than very well
English speakers - Native, born elsewhere 53.5% of residents of Annandale speak English at home.
31.5% of residents speak Spanish at home 158 42.4% Speak English very well215 57.6% Speak English less than very well14.8% of residents speak other language at home 162 92.6% Speak English very well13 7.4% Speak English less than very well
English speakers - Foreign-born 10.6% of residents of Annandale speak English at home.
41.5% of residents speak Spanish at home 2,640 34.5% Speak English very well5,008 65.5% Speak English less than very well47.6% of residents speak other language at home 4,278 48.9% Speak English very well4,477 51.1% Speak English less than very well
White (Caucasian) - Speak only English Native:
87.7% (10,855)Foreign-born:
15.3% (276)
White (Caucasian) - Speak another language Native:
10.7% (1,322)Foreign-born:
81.0% (1,462)
Black or African American - Speak only English Native:
78.4% (1,498)Foreign-born:
24.4% (424)
Black or African American - Speak another language Native:
23.6% (452)Foreign-born:
75.7% (1,316)
American Indian / Alaska Native - Speak only English Native:
85.1% (43)Foreign-born:
4.2% (16)
American Indian / Alaska Native - Speak another language Native:
15.4% (8)Foreign-born:
96.1% (362)
Asian - Speak only English Native:
33.8% (731)Foreign-born:
11.1% (814)
Asian - Speak another language Native:
67.6% (1,465)Foreign-born:
88.6% (6,490)
Other race - Speak only English Native:
12.0% (368)Foreign-born:
4.2% (265)
Other race - Speak another language Native:
78.5% (2,406)Foreign-born:
94.9% (5,927)
Two or more races - Speak only English Native:
76.8% (1,414)Foreign-born:
13.1% (296)
Two or more races - Speak another language Native:
23.0% (424)Foreign-born:
86.8% (1,957)
White alone - Speak only English Native:
93.1% (10,677)Foreign-born:
23.8% (286)
White alone - Speak another language Native:
6.7% (773)Foreign-born:
75.6% (911)
Hispanic or Latino - Speak only English Native:
19.8% (895)Foreign-born:
4.2% (336)
Hispanic or Latino - Speak another language Native:
75.3% (3,400)Foreign-born:
95.8% (7,629)
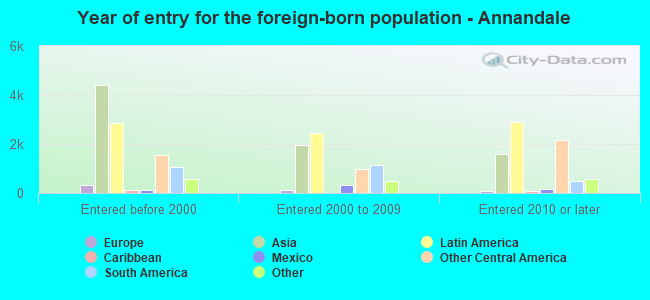
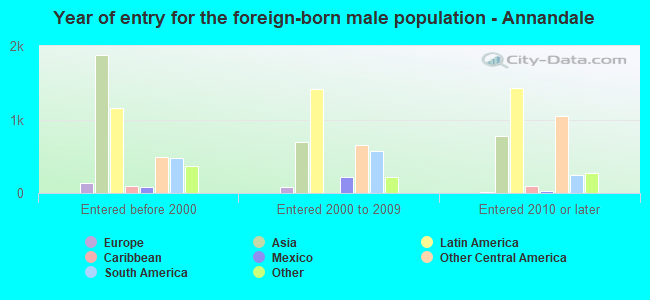
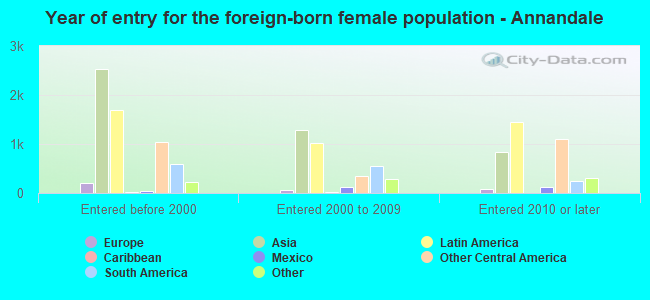
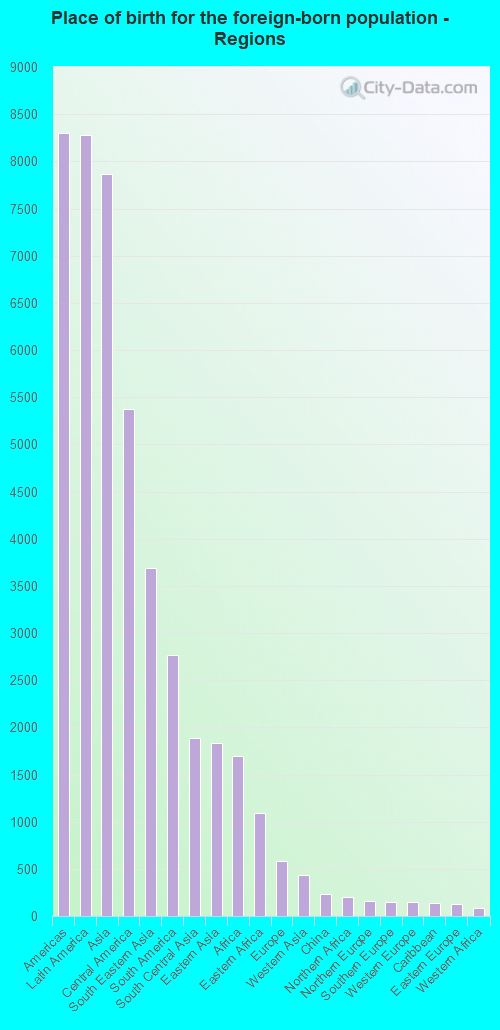
Foreign-born residents in Annandale 18,453 residents are foreign born (19.6% Latin America , 18.7% Asia ).
This city:
43.9%Virginia:
12.6%
Marital status for residents in Annandale Marital status - White (Caucasian) population 15 years and over
Males 34.3% Never married52.2% Now married1.2% Separated3.0% Widowed9.3% DivorcedFemales 28.5% Never married46.3% Now married1.2% Separated11.7% Widowed12.3% DivorcedWomen who gave birth in the past 12 months Now married:
55.6% (85)Unmarried:
44.4% (68)
Women who did not give birth in the past 12 months Now married:
40.1% (1,091)Unmarried:
59.9% (1,629)
Marital status - Black or African American population 15 years and over
Males 37.9% Never married41.2% Now married2.9% Separated2.4% Widowed15.6% DivorcedFemales 47.3% Never married34.4% Now married0.7% Separated5.6% Widowed11.9% DivorcedWomen who gave birth in the past 12 months Now married:
100.0% (38)Unmarried:
0.0% (0)
Women who did not give birth in the past 12 months Now married:
26.0% (271)Unmarried:
74.0% (770)
Marital status - American Indian / Alaska Native population 15 years and over
Males 51.5% Never married48.5% Now married0.0% Separated0.0% Widowed0.0% DivorcedFemales 71.9% Never married14.8% Now married0.0% Separated13.3% Widowed0.0% DivorcedWomen who did not give birth in the past 12 months Now married:
6.7% (5)Unmarried:
93.3% (74)
Marital status - Asian population 15 years and over
Males 34.8% Never married56.3% Now married2.7% Separated1.2% Widowed5.0% DivorcedFemales 31.8% Never married49.4% Now married2.1% Separated9.9% Widowed6.8% DivorcedWomen who gave birth in the past 12 months Now married:
86.4% (204)Unmarried:
13.6% (32)
Women who did not give birth in the past 12 months Now married:
46.4% (1,163)Unmarried:
53.6% (1,343)
Marital status - Native Hawaiian / Pacific Islander population 15 years and over
Males 92.9% Never married7.1% Now married0.0% Separated0.0% Widowed0.0% DivorcedFemales 0.0% Never married6.7% Now married0.0% Separated0.0% Widowed93.3% DivorcedWomen who did not give birth in the past 12 months Now married:
6.7% (2)Unmarried:
93.3% (29)
Marital status - Other race population 15 years and over
Males 49.4% Never married40.9% Now married4.2% Separated0.0% Widowed5.5% DivorcedFemales 42.5% Never married43.1% Now married4.3% Separated4.6% Widowed5.5% DivorcedWomen who gave birth in the past 12 months Now married:
0.0% (0)Unmarried:
100.0% (127)
Women who did not give birth in the past 12 months Now married:
46.9% (1,084)Unmarried:
53.1% (1,229)
Marital status - Two or more races population 15 years and over
Males 43.3% Never married48.2% Now married0.0% Separated0.0% Widowed8.5% DivorcedFemales 38.1% Never married41.9% Now married0.8% Separated10.7% Widowed8.4% DivorcedWomen who gave birth in the past 12 months Now married:
100.0% (87)Unmarried:
0.0% (0)
Women who did not give birth in the past 12 months Now married:
45.6% (412)Unmarried:
54.4% (491)
Marital status - White alone, not Hispanic / Latino population 15 years and over
Males 31.6% Never married54.4% Now married1.0% Separated3.5% Widowed9.5% DivorcedFemales 28.9% Never married47.7% Now married0.5% Separated11.6% Widowed11.3% DivorcedWomen who gave birth in the past 12 months Now married:
54.5% (35)Unmarried:
45.5% (29)
Women who did not give birth in the past 12 months Now married:
39.0% (881)Unmarried:
61.0% (1,379)
Marital status - Hispanic or Latino population 15 years and over
Males 49.1% Never married42.5% Now married3.0% Separated0.1% Widowed5.2% DivorcedFemales 37.3% Never married41.4% Now married3.5% Separated8.2% Widowed9.6% DivorcedWomen who gave birth in the past 12 months Now married:
45.4% (123)Unmarried:
54.6% (148)
Women who did not give birth in the past 12 months Now married:
45.6% (1,431)Unmarried:
54.4% (1,705)
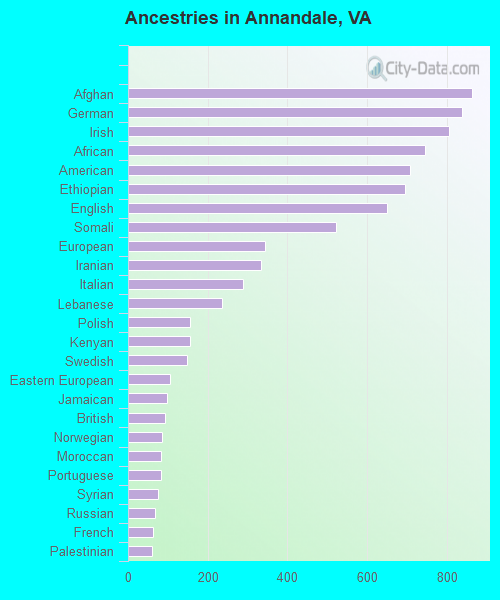
Ancestries in Annandale
863 3.2% Afghan839 3.1% German806 3.0% Irish745 2.8% African707 2.6% American695 2.6% Ethiopian651 2.4% English523 1.9% Somali343 1.3% European335 1.2% Iranian288 1.1% Italian236 0.9% Lebanese156 0.6% Polish155 0.6% Kenyan147 0.5% Swedish106 0.4% Eastern European99 0.4% Jamaican94 0.3% British85 0.3% Norwegian84 0.3% Moroccan84 0.3% Portuguese76 0.3% Syrian67 0.2% Russian64 0.2% French60 0.2% Palestinian59 0.2% Scotch-Irish50 0.2% Northern European50 0.2% Dutch47 0.2% Austrian32 0.1% French Canadian29 0.1% Scottish28 0.1% Ghanaian24 0.09% Hungarian22 0.08% Sierra Leonean21 0.08% Cajun16 0.06% Greek16 0.06% Welsh16 0.06% Barbadian14 0.05% Danish13 0.05% Czech12 0.04% Arab12 0.04% Lithuanian12 0.04% Canadian11 0.04% Croatian10 0.04% Belgian10 0.04% Slovak10 0.04% Ukrainian8 0.03% Brazilian8 0.03% Finnish7 0.03% Armenian7 0.03% Israeli7 0.03% Egyptian6 0.02% Latvian4 0.01% Australian3 0.01% Bulgarian
Geographical mobility in Annandale Same house 1 year ago 12,997 87.6% White (Caucasian)3,081 78.7% Black or African American270 96.1% American Indian / Alaska Native8,855 89.8% Asian105 85.5% Native Hawaiian / Pacific Islander9,274 92.5% Other race3,425 80.8% Two or more races11,576 89.2% White alone, not Hispanic / Latino11,413 84.0% Hispanic or LatinoMoved within same county 545 3.7% White / Caucasian449 11.5% Black or African American517 5.2% Asian18 14.9% Native Hawaiian / Pacific Islander320 3.2% Other race463 10.9% Two or more races373 2.9% White alone, not Hispanic / Latino1,018 7.5% Hispanic or LatinoMoved within same state 807 5.4% White / Caucasian38 1.0% Black or African American192 1.9% Asian357 3.6% Other race60 1.4% Two or more races629 4.8% White alone, not Hispanic / Latino641 4.7% Hispanic or LatinoMoved from different state 419 2.8% White / Caucasian152 3.9% Black or African American127 1.3% Asian17 0.2% Other race39 0.9% Two or more races320 2.5% White alone, not Hispanic / Latino235 1.7% Hispanic or LatinoMoved from abroad 108 0.7% White31 0.8% Black or African American139 1.4% Asian160 1.6% Other race258 6.1% Two or more races102 0.8% White alone, not Hispanic / Latino249 1.8% Hispanic or Latino
Children Nativity (place of birth) in Annandale
Children under 6 years - Living with two parents Both parents native 447 100.0% NativeBoth parents foreign-born 708 96.4% Native27 3.6% Foreign-bornOne native, one foreign-born parent 437 100.0% NativeChildren under 6 years - Living with one parent Native parent 287 100.0% NativeForeign-born parent 874 95.7% Native39 4.3% Foreign-bornChildren 6 to 17 years - Living with two parents Both parents native 1,266 99.7% Native4 0.3% Foreign-bornBoth parents foreign-born 1,327 81.6% Native300 18.4% Foreign-bornOne native, one foreign-born parent 657 100.0% NativeChildren 6 to 17 years - Living with one parent Foreign-born parent 1,914 59.6% Native1,297 40.4% Foreign-born
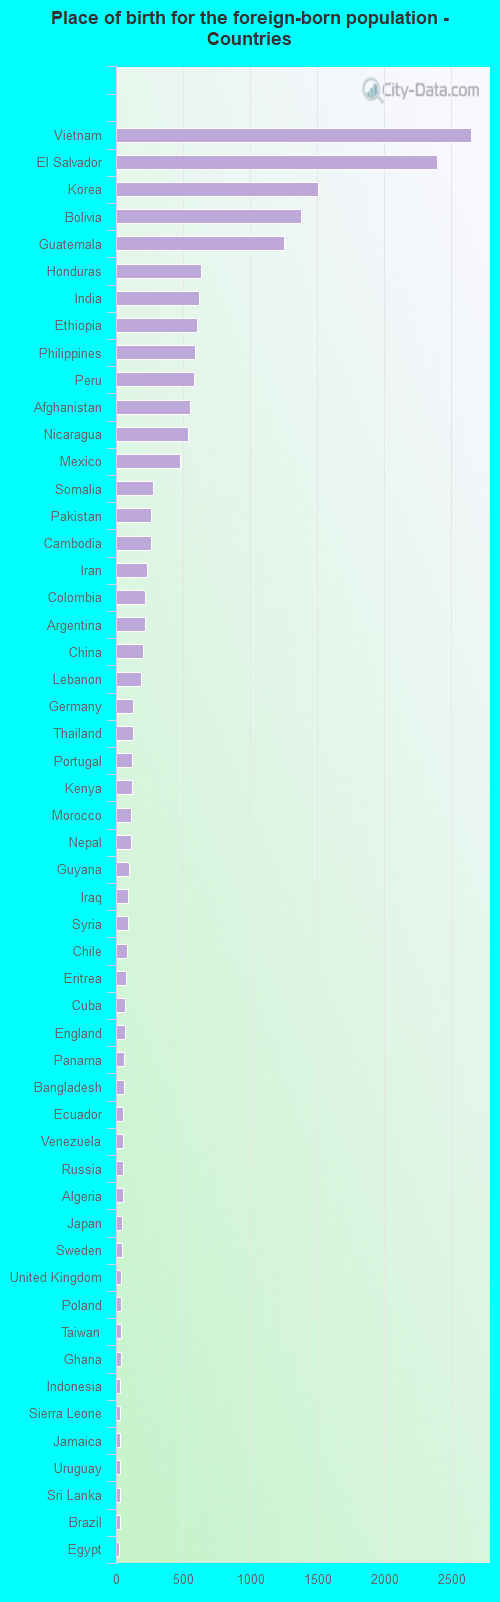
Place of birth for residents in Annandale 8,300 Americas8,275 Latin America7,870 Asia5,374 Central America3,688 South Eastern Asia2,762 South America1,890 South Central Asia1,834 Eastern Asia1,694 Africa1,095 Eastern Africa584 Europe433 Western Asia237 China204 Northern Africa162 Northern Europe148 Southern Europe144 Western Europe138 Caribbean129 Eastern Europe82 Western Africa33 Middle Africa24 Northern America4 Southern Africa3 Oceania3 Australia and New Zealand Subregion2,651 Vietnam2,394 El Salvador1,511 Korea1,384 Bolivia1,250 Guatemala637 Honduras620 India603 Ethiopia593 Philippines585 Peru552 Afghanistan541 Nicaragua475 Mexico276 Somalia260 Pakistan258 Cambodia231 Iran215 Colombia213 Argentina198 China184 Lebanon129 Germany127 Thailand121 Portugal121 Kenya110 Morocco109 Nepal94 Guyana91 Iraq89 Syria83 Chile77 Eritrea68 Cuba67 England62 Panama60 Bangladesh55 Ecuador55 Venezuela53 Russia50 Algeria43 Japan42 Sweden40 United Kingdom39 Poland39 Taiwan34 Ghana33 Indonesia33 Sierra Leone32 Jamaica31 Uruguay28 Sri Lanka27 Brazil25 Egypt24 Canada21 Jordan20 Ukraine17 Singapore16 Sudan15 Italy14 Israel13 Trinidad and Tobago12 Dominican Republic12 Democratic Republic of Congo (Zaire)11 Turkey10 Spain10 United Arab Emirates9 Barbados7 Moldova7 Netherlands7 Armenia6 Bulgaria6 Nigeria6 France4 South Africa4 Burma (Myanmar)3 Australia
Grandparents responsible for own grandchildren in Annandale
Grandparents (30 to 59 years) White / Caucasian 21 100.0% Not responsible for grandchildrenAsian 4 2.4% Responsible for grandchildren155 97.6% Not responsible for grandchildrenOther race 79 44.7% Responsible for grandchildren98 55.3% Not responsible for grandchildrenTwo or more races 21 63.6% Responsible for grandchildren12 36.4% Not responsible for grandchildrenWhite alone, not Hispanic / Latino 9 100.0% Not responsible for grandchildrenHispanic or Latino 72 45.5% Responsible for grandchildren86 54.5% Not responsible for grandchildrenGrandparents (60 years and over) White / Caucasian 30 13.6% Responsible for grandchildren189 86.4% Not responsible for grandchildrenAsian 2 0.5% Responsible for grandchildren336 99.5% Not responsible for grandchildrenOther race 16 3.4% Responsible for grandchildren472 96.6% Not responsible for grandchildrenTwo or more races 44 69.0% Responsible for grandchildren20 31.0% Not responsible for grandchildrenWhite alone, not Hispanic / Latino 32 17.8% Responsible for grandchildren150 82.2% Not responsible for grandchildrenHispanic or Latino 15 2.7% Responsible for grandchildren544 97.3% Not responsible for grandchildren