Races in Anoka, Minnesota (MN) Detailed Stats
Data:
Races - White alone (%)
Races - White alone (% change since 2000)
Races - Black alone (%)
Races - Black alone (% change since 2000)
Races - American Indian alone (%)
Races - American Indian alone (% change since 2000)
Races - Asian alone (%)
Races - Asian alone (% change since 2000)
Races - Hispanic (%)
Races - Hispanic (% change since 2000)
Races - Native Hawaiian and Other Pacific Islander alone (%)
Races - Native Hawaiian and Other Pacific Islander alone (% change since 2000)
Races - Two or more races(%)
Races - Two or more races(% change since 2000)
Races - Other race alone (%)
Races - Other race alone (% change since 2000)
Racial diversity
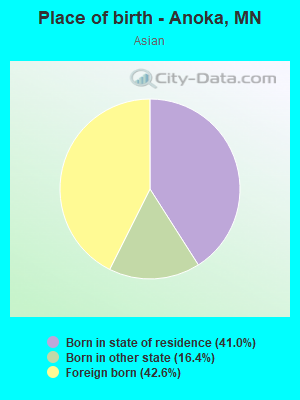
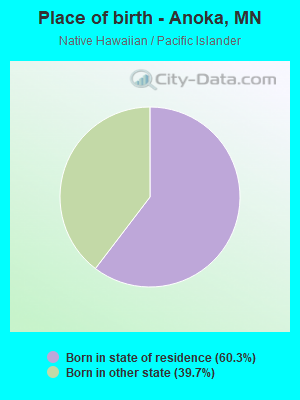
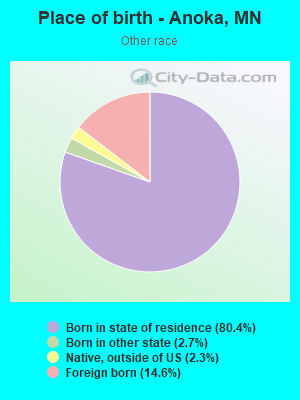
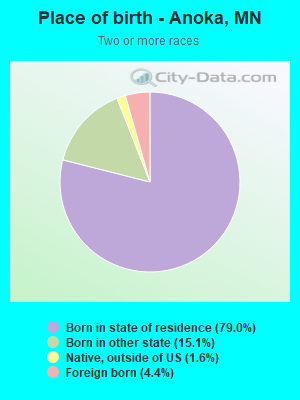
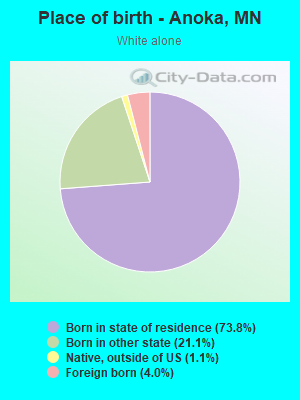
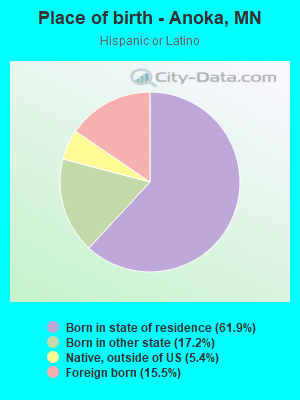
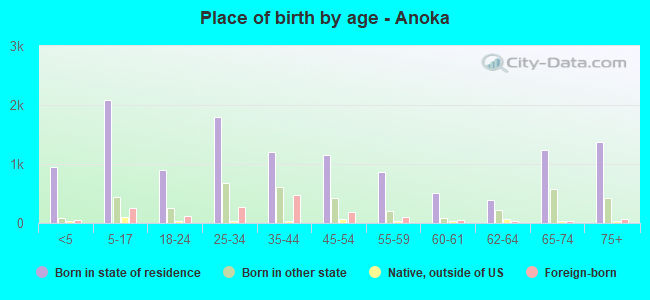
Place of birth - Born in state of residence (%)
Place of birth - Born in state of residence (%) - White
Place of birth - Born in state of residence (%) - Black or African American
Place of birth - Born in state of residence (%) - Asian
Place of birth - Born in state of residence (%) - Hispanic or Latino
Place of birth - Born in state of residence (%) - American Indian and Alaska Native
Place of birth - Born in state of residence (%) - Multirace
Place of birth - Born in state of residence (%) - Other Race
Place of birth - Born in other state (%)
Place of birth - Born in other state (%) - White
Place of birth - Born in other state (%) - Black or African American
Place of birth - Born in other state (%) - Asian
Place of birth - Born in other state (%) - Hispanic or Latino
Place of birth - Born in other state (%) - American Indian and Alaska Native
Place of birth - Born in other state (%) - Multirace
Place of birth - Born in other state (%) - Other Race
Place of birth - Native, outside of US (%)
Place of birth - Native, outside of US (%) - White
Place of birth - Native, outside of US (%) - Black or African American
Place of birth - Native, outside of US (%) - Asian
Place of birth - Native, outside of US (%) - Hispanic or Latino
Place of birth - Native, outside of US (%) - American Indian and Alaska Native
Place of birth - Native, outside of US (%) - Multirace
Place of birth - Native, outside of US (%) - Other Race
Place of birth - Foreign born (%)
Place of birth - Foreign born (%) - White
Place of birth - Foreign born (%) - Black or African American
Place of birth - Foreign born (%) - Asian
Place of birth - Foreign born (%) - Hispanic or Latino
Place of birth - Foreign born (%) - American Indian and Alaska Native
Place of birth - Foreign born (%) - Multirace
Place of birth - Foreign born (%) - Other Race
Residents speaking English at home (%)
Residents speaking English at home - Born in the United States (%)
Residents speaking English at home - Native, born elsewhere (%)
Residents speaking English at home - Foreign born (%)
Residents speaking Spanish at home (%)
Residents speaking Spanish at home - Born in the United States (%)
Residents speaking Spanish at home - Native, born elsewhere (%)
Residents speaking Spanish at home - Foreign born (%)
Residents speaking other language at home (%)
Residents speaking other language at home - Born in the United States (%)
Residents speaking other language at home - Native, born elsewhere (%)
Residents speaking other language at home - Foreign born (%)
Marital status - Never married (%)
Marital status - Now married (%)
Marital status - Separated (%)
Marital status - Widowed (%)
Marital status - Divorced (%)
Ancestries Reported - Arab (%)
Ancestries Reported - Czech (%)
Ancestries Reported - Danish (%)
Ancestries Reported - Dutch (%)
Ancestries Reported - English (%)
Ancestries Reported - French (%)
Ancestries Reported - French Canadian (%)
Ancestries Reported - German (%)
Ancestries Reported - Greek (%)
Ancestries Reported - Hungarian (%)
Ancestries Reported - Irish (%)
Ancestries Reported - Italian (%)
Ancestries Reported - Lithuanian (%)
Ancestries Reported - Norwegian (%)
Ancestries Reported - Polish (%)
Ancestries Reported - Portuguese (%)
Ancestries Reported - Russian (%)
Ancestries Reported - Scotch-Irish (%)
Ancestries Reported - Scottish (%)
Ancestries Reported - Slovak (%)
Ancestries Reported - Subsaharan African (%)
Ancestries Reported - Swedish (%)
Ancestries Reported - Swiss (%)
Ancestries Reported - Ukrainian (%)
Ancestries Reported - United States (%)
Ancestries Reported - Welsh (%)
Ancestries Reported - West Indian (%)
Ancestries Reported - Other (%)
Geographical mobility - Same house 1 year ago (%)
Geographical mobility - Same house 1 year ago (%) - White
Geographical mobility - Same house 1 year ago (%) - Black or African American
Geographical mobility - Same house 1 year ago (%) - Asian
Geographical mobility - Same house 1 year ago (%) - Hispanic or Latino
Geographical mobility - Same house 1 year ago (%) - American Indian and Alaska Native
Geographical mobility - Same house 1 year ago (%) - Multirace
Geographical mobility - Same house 1 year ago (%) - Other Race
Geographical mobility - Moved within same county (%)
Geographical mobility - Moved within same county (%) - White
Geographical mobility - Moved within same county (%) - Black or African American
Geographical mobility - Moved within same county (%) - Asian
Geographical mobility - Moved within same county (%) - Hispanic or Latino
Geographical mobility - Moved within same county (%) - American Indian and Alaska Native
Geographical mobility - Moved within same county (%) - Multirace
Geographical mobility - Moved within same county (%) - Other Race
Geographical mobility - Moved from different county within same state (%)
Geographical mobility - Moved from different county within same state (%) - White
Geographical mobility - Moved from different county within same state (%) - Black or African American
Geographical mobility - Moved from different county within same state (%) - Asian
Geographical mobility - Moved from different county within same state (%) - Hispanic or Latino
Geographical mobility - Moved from different county within same state (%) - American Indian and Alaska Native
Geographical mobility - Moved from different county within same state (%) - Multirace
Geographical mobility - Moved from different county within same state (%) - Other Race
Geographical mobility - Moved from different state (%)
Geographical mobility - Moved from different state (%) - White
Geographical mobility - Moved from different state (%) - Black or African American
Geographical mobility - Moved from different state (%) - Asian
Geographical mobility - Moved from different state (%) - Hispanic or Latino
Geographical mobility - Moved from different state (%) - American Indian and Alaska Native
Geographical mobility - Moved from different state (%) - Multirace
Geographical mobility - Moved from different state (%) - Other Race
Geographical mobility - Moved from abroad (%)
Geographical mobility - Moved from abroad (%) - White
Geographical mobility - Moved from abroad (%) - Black or African American
Geographical mobility - Moved from abroad (%) - Asian
Geographical mobility - Moved from abroad (%) - Hispanic or Latino
Geographical mobility - Moved from abroad (%) - American Indian and Alaska Native
Geographical mobility - Moved from abroad (%) - Multirace
Geographical mobility - Moved from abroad (%) - Other Race
Place of birth for the foreign-born population - Ireland (%)
Place of birth for the foreign-born population - Denmark (%)
Place of birth for the foreign-born population - Norway (%)
Place of birth for the foreign-born population - Sweden (%)
Place of birth for the foreign-born population - United Kingdom (%)
Place of birth for the foreign-born population - England (%)
Place of birth for the foreign-born population - Scotland (%)
Place of birth for the foreign-born population - Other Northern Europe (%)
Place of birth for the foreign-born population - Austria (%)
Place of birth for the foreign-born population - Belgium (%)
Place of birth for the foreign-born population - France (%)
Place of birth for the foreign-born population - Germany (%)
Place of birth for the foreign-born population - Netherlands (%)
Place of birth for the foreign-born population - Switzerland (%)
Place of birth for the foreign-born population - Other Western Europe (%)
Place of birth for the foreign-born population - Greece (%)
Place of birth for the foreign-born population - Italy (%)
Place of birth for the foreign-born population - Portugal (%)
Place of birth for the foreign-born population - Spain (%)
Place of birth for the foreign-born population - Other Southern Europe (%)
Place of birth for the foreign-born population - Albania (%)
Place of birth for the foreign-born population - Belarus (%)
Place of birth for the foreign-born population - Bosnia and Herzegovina (%)
Place of birth for the foreign-born population - Bulgaria (%)
Place of birth for the foreign-born population - Croatia (%)
Place of birth for the foreign-born population - Czechoslovakia (%)
Place of birth for the foreign-born population - Hungary (%)
Place of birth for the foreign-born population - Latvia (%)
Place of birth for the foreign-born population - Lithuania (%)
Place of birth for the foreign-born population - North Macedonia (Macedonia) (%)
Place of birth for the foreign-born population - Moldova (%)
Place of birth for the foreign-born population - Poland (%)
Place of birth for the foreign-born population - Romania (%)
Place of birth for the foreign-born population - Russia (%)
Place of birth for the foreign-born population - Serbia (%)
Place of birth for the foreign-born population - Ukraine (%)
Place of birth for the foreign-born population - Other Eastern Europe (%)
Place of birth for the foreign-born population - China (%)
Place of birth for the foreign-born population - Hong Kong (%)
Place of birth for the foreign-born population - Taiwan (%)
Place of birth for the foreign-born population - Japan (%)
Place of birth for the foreign-born population - Korea (%)
Place of birth for the foreign-born population - Other Eastern Asia (%)
Place of birth for the foreign-born population - Afghanistan (%)
Place of birth for the foreign-born population - Bangladesh (%)
Place of birth for the foreign-born population - India (%)
Place of birth for the foreign-born population - Iran (%)
Place of birth for the foreign-born population - Kazakhstan (%)
Place of birth for the foreign-born population - Nepal (%)
Place of birth for the foreign-born population - Pakistan (%)
Place of birth for the foreign-born population - Sri Lanka (%)
Place of birth for the foreign-born population - Uzbekistan (%)
Place of birth for the foreign-born population - Other South Central Asia (%)
Place of birth for the foreign-born population - Burma (%)
Place of birth for the foreign-born population - Cambodia (%)
Place of birth for the foreign-born population - Indonesia (%)
Place of birth for the foreign-born population - Laos (%)
Place of birth for the foreign-born population - Malaysia (%)
Place of birth for the foreign-born population - Philippines (%)
Place of birth for the foreign-born population - Singapore (%)
Place of birth for the foreign-born population - Thailand (%)
Place of birth for the foreign-born population - Vietnam (%)
Place of birth for the foreign-born population - Other South Eastern Asia (%)
Place of birth for the foreign-born population - Armenia (%)
Place of birth for the foreign-born population - Iraq (%)
Place of birth for the foreign-born population - Israel (%)
Place of birth for the foreign-born population - Jordan (%)
Place of birth for the foreign-born population - Kuwait (%)
Place of birth for the foreign-born population - Lebanon (%)
Place of birth for the foreign-born population - Saudi Arabia (%)
Place of birth for the foreign-born population - Syria (%)
Place of birth for the foreign-born population - Turkey (%)
Place of birth for the foreign-born population - Yemen (%)
Place of birth for the foreign-born population - Other Western Asia (%)
Place of birth for the foreign-born population - Eritrea (%)
Place of birth for the foreign-born population - Ethiopia (%)
Place of birth for the foreign-born population - Kenya (%)
Place of birth for the foreign-born population - Somalia (%)
Place of birth for the foreign-born population - Uganda (%)
Place of birth for the foreign-born population - Zimbabwe (%)
Place of birth for the foreign-born population - Other Eastern Africa (%)
Place of birth for the foreign-born population - Cameroon (%)
Place of birth for the foreign-born population - Congo (%)
Place of birth for the foreign-born population - Democratic Republic of Congo (Zaire) (%)
Place of birth for the foreign-born population - Other Middle Africa (%)
Place of birth for the foreign-born population - Egypt (%)
Place of birth for the foreign-born population - Morocco (%)
Place of birth for the foreign-born population - Sudan (%)
Place of birth for the foreign-born population - Other Northern Africa (%)
Place of birth for the foreign-born population - South Africa (%)
Place of birth for the foreign-born population - Other Southern Africa (%)
Place of birth for the foreign-born population - Cabo Verde (%)
Place of birth for the foreign-born population - Ghana (%)
Place of birth for the foreign-born population - Liberia (%)
Place of birth for the foreign-born population - Nigeria (%)
Place of birth for the foreign-born population - Senegal (%)
Place of birth for the foreign-born population - Sierra Leone (%)
Place of birth for the foreign-born population - Other Western Africa (%)
Place of birth for the foreign-born population - Australia (%)
Place of birth for the foreign-born population - New Zealand (%)
Place of birth for the foreign-born population - Fiji (%)
Place of birth for the foreign-born population - Micronesia (%)
Place of birth for the foreign-born population - Bahamas (%)
Place of birth for the foreign-born population - Barbados (%)
Place of birth for the foreign-born population - Cuba (%)
Place of birth for the foreign-born population - Dominica (%)
Place of birth for the foreign-born population - Dominican Republic (%)
Place of birth for the foreign-born population - Grenada (%)
Place of birth for the foreign-born population - Haiti (%)
Place of birth for the foreign-born population - Jamaica (%)
Place of birth for the foreign-born population - St. Vincent and the Grenadines (%)
Place of birth for the foreign-born population - Trinidad and Tobago (%)
Place of birth for the foreign-born population - West Indies (%)
Place of birth for the foreign-born population - Other Caribbean (%)
Place of birth for the foreign-born population - Belize (%)
Place of birth for the foreign-born population - Costa Rica (%)
Place of birth for the foreign-born population - El Salvador (%)
Place of birth for the foreign-born population - Guatemala (%)
Place of birth for the foreign-born population - Honduras (%)
Place of birth for the foreign-born population - Mexico (%)
Place of birth for the foreign-born population - Nicaragua (%)
Place of birth for the foreign-born population - Panama (%)
Place of birth for the foreign-born population - Other Central America (%)
Place of birth for the foreign-born population - Argentina (%)
Place of birth for the foreign-born population - Bolivia (%)
Place of birth for the foreign-born population - Brazil (%)
Place of birth for the foreign-born population - Chile (%)
Place of birth for the foreign-born population - Colombia (%)
Place of birth for the foreign-born population - Ecuador (%)
Place of birth for the foreign-born population - Guyana (%)
Place of birth for the foreign-born population - Peru (%)
Place of birth for the foreign-born population - Uruguay (%)
Place of birth for the foreign-born population - Venezuela (%)
Place of birth for the foreign-born population - Other South America (%)
Place of birth for the foreign-born population - Canada (%)
Place of birth for the foreign-born population - Other Northern America (%)
Place of birth for the foreign-born population - Other (%)
Latest news about races in Anoka, MN collected exclusively by city-data.com from local newspapers, TV, and radio stations
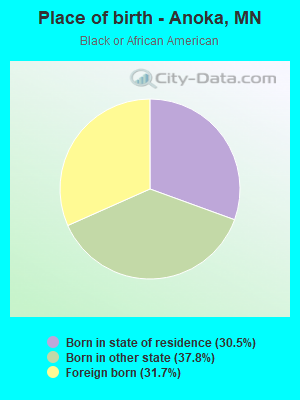
According to 2022 data, the most numerous races in Anoka, MN are White alone (13,399 residents), Black alone (1,479 residents), and Hispanic (1,178 residents). 85.9% of Anoka residents speak English at home. 7.9% of Anoka, MN residents are foreign-born (3.3% born in Asia, 2.2% born in Africa, 1.1% born in Latin America, 1.0% born in Europe), which is about the same as the foreign-born rate of 8.0% across the entire state of Minnesota.
Race distribution in Anoka
2000 2022
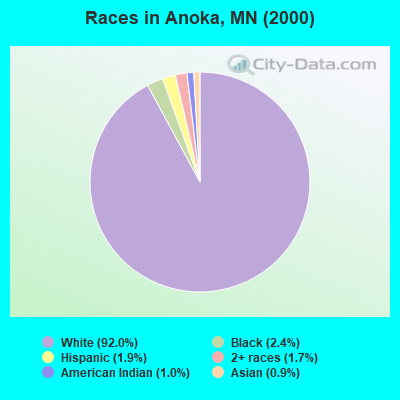
4,337,143 88.2% White alone 168,813 3.4% Black alone 143,382 2.9% Hispanic 141,083 2.9% Asian alone 70,304 1.4% Two or more races 52,009 1.1% American Indian alone 5,031 0.1% Other race alone 1,714 0.03% Native Hawaiian and Other
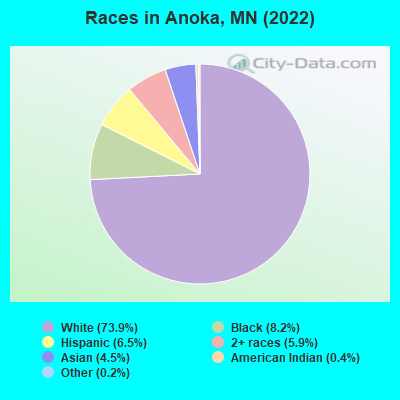
4,356,347 76.2% White alone 395,179 6.9% Black alone 333,830 5.8% Hispanic 294,800 5.2% Asian alone 259,649 4.5% Two or more races 42,125 0.7% American Indian alone 32,976 0.6% Other race alone 2,278 0.04% Native Hawaiian and Other
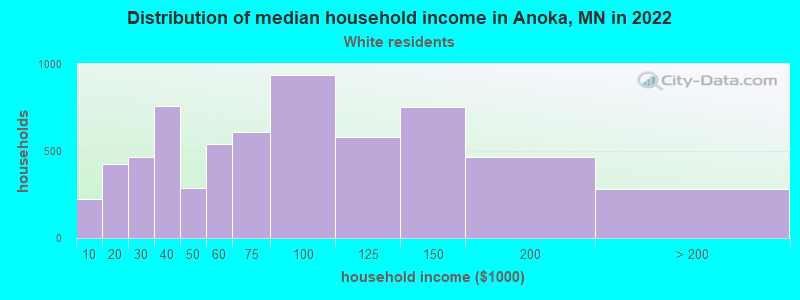
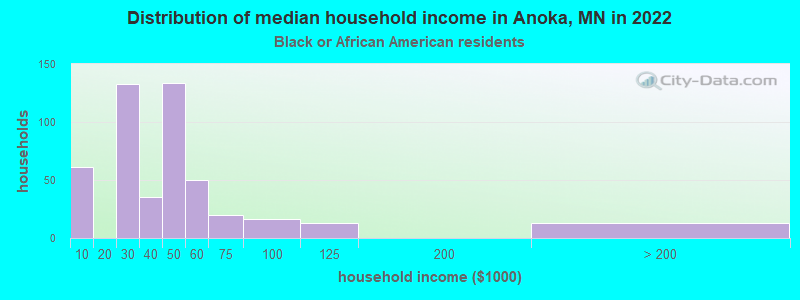
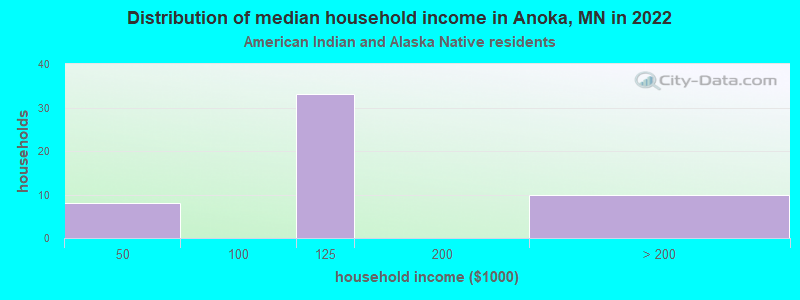
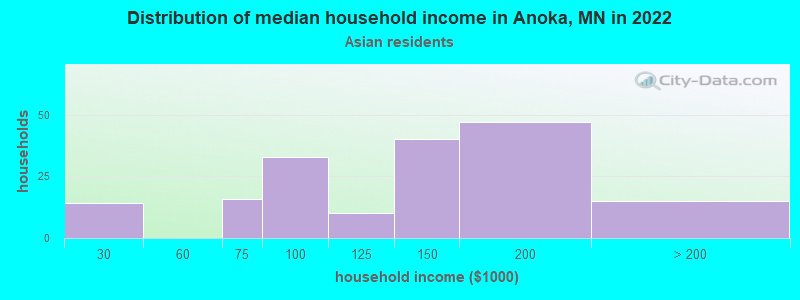
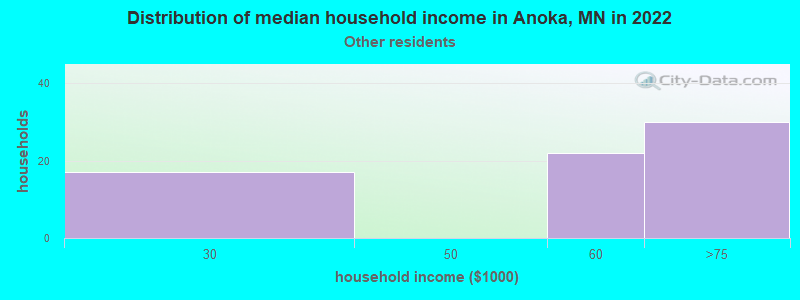
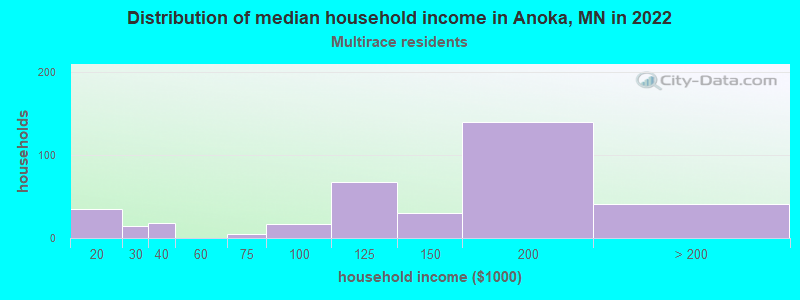
Income and house value in Anoka Median household income in 2022 $73,586 White non-Hispanic householders$31,650 Black householders$111,345 American Indian and Alaska Native householders$147,682 Asian householders$59,290 Some other race householders$122,708 Two or more races householdersMedian 2022 house value $303,725 White Non-Hispanic householders$287,376 Black or African American householders$415,100 American Indian or Alaska Native householders $311,899 Asian householders$324,672 Some other race householders$233,477 Two or more races householders$331,824 Hispanic or Latino householders
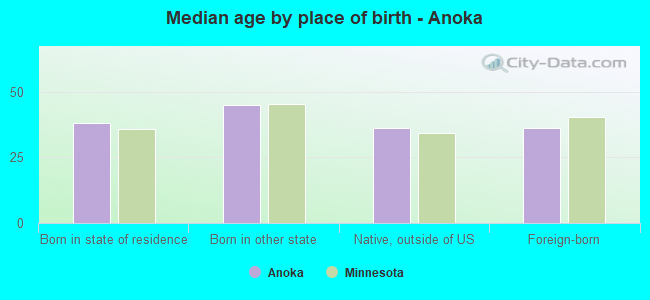
Median age by race in Anoka
46.8 Median age for White residents42.2 52.8 22.8 Median age for Black or African American residents25.6 18.6 51.8 Median age for American Indian / Alaska Native residents70.7 52.6 29.9 Median age for Asian residents28.7 32.4 -670,553,935.2 Median age for Native Hawaiian / Pacific Islander residents-670,553,935.2 -534,959,349.1 19.0 Median age for Other race residents17.3 21.0 18.8 Median age for Two or more races residents20.3 19.8 46.0 Median age for White alone residents41.8 52.3 17.6 Median age for Hispanic or Latino residents17.9 13.1
Owner/renter occupied households by race in Anoka
House owners and renters - White residents 3,632 58.9% Owner occupied2,531 41.1% Renter occupiedHouse owners and renters - Black or African American residents 13 2.7% Owner occupied468 97.3% Renter occupiedHouse owners and renters - American Indian / Alaska Native residents 24 100.0% Owner occupiedHouse owners and renters - Asian residents 155 80.4% Owner occupied38 19.6% Renter occupiedHouse owners and renters - Native Hawaiian / Pacific Islander residents 22 100.0% Owner occupiedHouse owners and renters - Other race residents 67 71.2% Owner occupied27 28.8% Renter occupiedHouse owners and renters - Two or more races residents 201 63.8% Owner occupied114 36.2% Renter occupiedHouse owners and renters - White alone residents 3,564 58.6% Owner occupied2,514 41.4% Renter occupiedHouse owners and renters - Hispanic or Latino residents 209 76.5% Owner occupied64 23.5% Renter occupied
Language usage in Anoka
English speakers - Total 85.9% of residents of Anoka speak English at home.
3.1% of residents speak Spanish at home 328 63.0% Speak English very well193 37.0% Speak English less than very well10.7% of residents speak other language at home 895 49.2% Speak English very well923 50.8% Speak English less than very well
English speakers - Born in the United States 91.3% of residents of Anoka speak English at home.
2.0% of residents speak Spanish at home 73 96.1% Speak English very well3 3.9% Speak English less than very well6.2% of residents speak other language at home 214 88.8% Speak English very well27 11.2% Speak English less than very well
English speakers - Native, born elsewhere 69.4% of residents of Anoka speak English at home.
1.2% of residents speak Spanish at home 3 100.0% Speak English less than very well18.8% of residents speak other language at home 21 43.8% Speak English very well27 56.2% Speak English less than very well
English speakers - Foreign-born 20.1% of residents of Anoka speak English at home.
8.4% of residents speak Spanish at home 62 47.7% Speak English very well68 52.3% Speak English less than very well72.0% of residents speak other language at home 334 30.0% Speak English very well778 70.0% Speak English less than very well
White (Caucasian) - Speak only English Native:
97.4% (12,015)Foreign-born:
19.8% (102)
White (Caucasian) - Speak another language Native:
2.6% (320)Foreign-born:
80.1% (413)
Black or African American - Speak only English Native:
91.7% (734)Foreign-born:
20.1% (91)
Black or African American - Speak another language Native:
3.3% (26)Foreign-born:
79.9% (362)
American Indian / Alaska Native - Speak another language Native:
6.2% (7)Foreign-born:
100.0% (11)
Asian - Speak only English Native:
18.0% (72)Foreign-born:
11.2% (41)
Asian - Speak another language Native:
87.5% (350)Foreign-born:
89.4% (327)
Other race - Speak only English Native:
28.9% (117)Foreign-born:
51.3% (36)
Other race - Speak another language Native:
65.8% (266)Foreign-born:
38.3% (27)
Two or more races - Speak only English Native:
88.8% (1,440)Foreign-born:
17.6% (13)
Two or more races - Speak another language Native:
9.8% (159)Foreign-born:
75.8% (56)
White alone - Speak only English Native:
97.6% (11,977)Foreign-born:
21.0% (113)
White alone - Speak another language Native:
2.5% (308)Foreign-born:
78.8% (423)
Hispanic or Latino - Speak only English Native:
53.4% (441)Foreign-born:
27.4% (47)
Hispanic or Latino - Speak another language Native:
41.5% (343)Foreign-born:
74.2% (128)
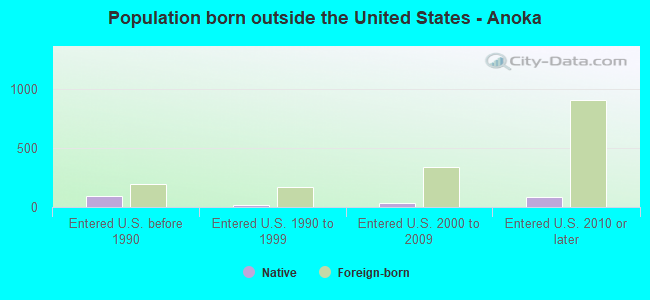
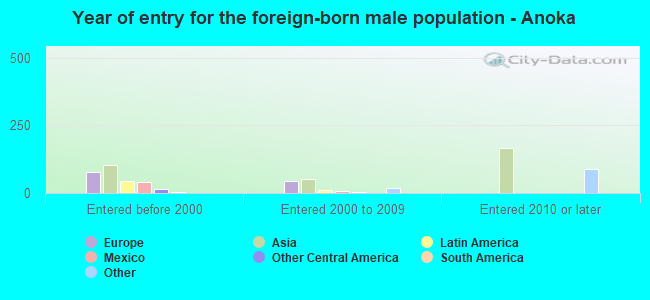
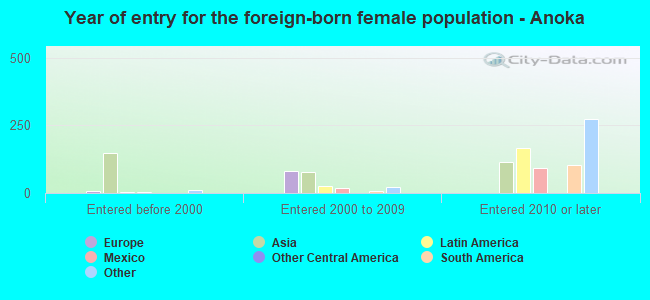
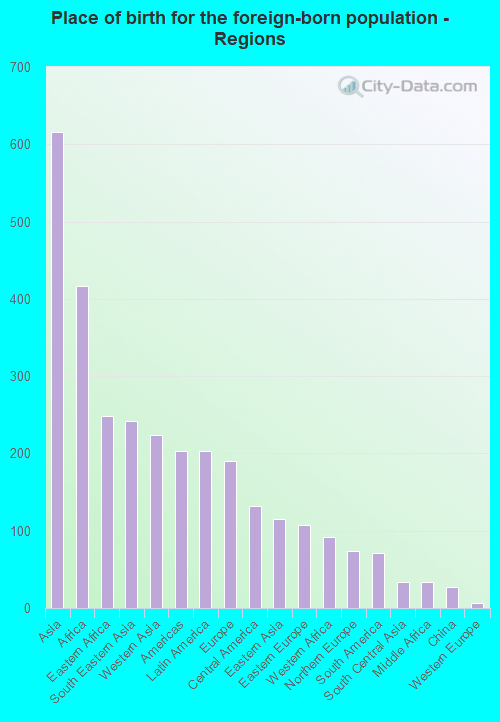
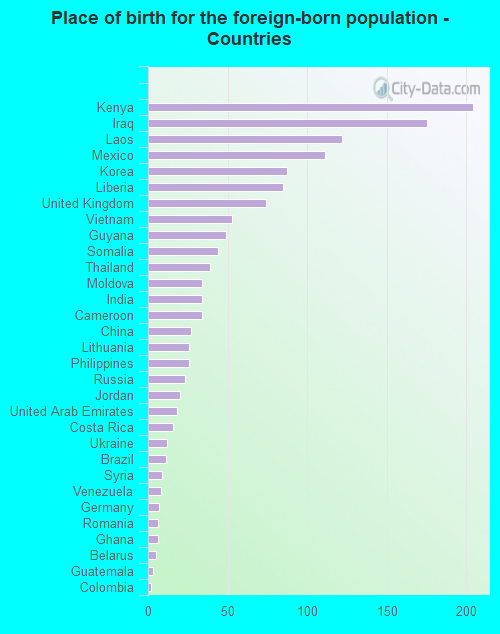
Foreign-born residents in Anoka 1,427 residents are foreign born (3.3% Asia , 2.2% Africa , 1.1% Latin America , 1.0% Europe ).
This city:
7.9%Minnesota:
8.5%
Marital status for residents in Anoka Marital status - White (Caucasian) population 15 years and over
Males 31.5% Never married50.9% Now married1.9% Separated2.9% Widowed12.8% DivorcedFemales 20.5% Never married51.3% Now married1.2% Separated11.5% Widowed15.5% DivorcedWomen who gave birth in the past 12 months Now married:
68.2% (110)Unmarried:
31.8% (51)
Women who did not give birth in the past 12 months Now married:
53.3% (1,175)Unmarried:
46.7% (1,029)
Marital status - Black or African American population 15 years and over
Males 42.3% Never married38.1% Now married0.0% Separated0.0% Widowed19.6% DivorcedFemales 41.0% Never married35.2% Now married6.0% Separated1.8% Widowed16.1% DivorcedWomen who gave birth in the past 12 months Now married:
30.9% (22)Unmarried:
69.1% (50)
Women who did not give birth in the past 12 months Now married:
46.2% (188)Unmarried:
53.8% (219)
Marital status - American Indian / Alaska Native population 15 years and over
Males 40.8% Never married34.7% Now married0.0% Separated0.0% Widowed24.5% DivorcedFemales 20.8% Never married79.2% Now married0.0% Separated0.0% Widowed0.0% DivorcedWomen who did not give birth in the past 12 months Now married:
47.6% (10)Unmarried:
52.4% (11)
Marital status - Asian population 15 years and over
Males 58.4% Never married28.9% Now married12.7% Separated0.0% Widowed0.0% DivorcedFemales 33.2% Never married51.0% Now married0.0% Separated10.9% Widowed4.9% DivorcedWomen who did not give birth in the past 12 months Now married:
45.7% (97)Unmarried:
54.3% (115)
Marital status - Other race population 15 years and over
Males 93.8% Never married6.2% Now married0.0% Separated0.0% Widowed0.0% DivorcedFemales 62.7% Never married31.3% Now married6.0% Separated0.0% Widowed0.0% DivorcedWomen who did not give birth in the past 12 months Now married:
34.2% (48)Unmarried:
65.8% (93)
Marital status - Two or more races population 15 years and over
Males 59.3% Never married30.5% Now married2.8% Separated7.3% Widowed0.0% DivorcedFemales 49.0% Never married29.8% Now married0.0% Separated4.4% Widowed16.8% DivorcedWomen who gave birth in the past 12 months Now married:
100.0% (10)Unmarried:
0.0% (0)
Women who did not give birth in the past 12 months Now married:
32.4% (143)Unmarried:
67.6% (300)
Marital status - White alone, not Hispanic / Latino population 15 years and over
Males 32.1% Never married50.1% Now married1.9% Separated2.9% Widowed13.0% DivorcedFemales 20.7% Never married51.1% Now married1.2% Separated11.6% Widowed15.4% DivorcedWomen who gave birth in the past 12 months Now married:
68.2% (112)Unmarried:
31.8% (52)
Women who did not give birth in the past 12 months Now married:
53.4% (1,186)Unmarried:
46.6% (1,035)
Marital status - Hispanic or Latino population 15 years and over
Males 54.3% Never married36.9% Now married0.0% Separated6.9% Widowed1.9% DivorcedFemales 57.8% Never married33.6% Now married2.2% Separated0.0% Widowed6.3% DivorcedWomen who did not give birth in the past 12 months Now married:
24.3% (51)Unmarried:
75.7% (158)
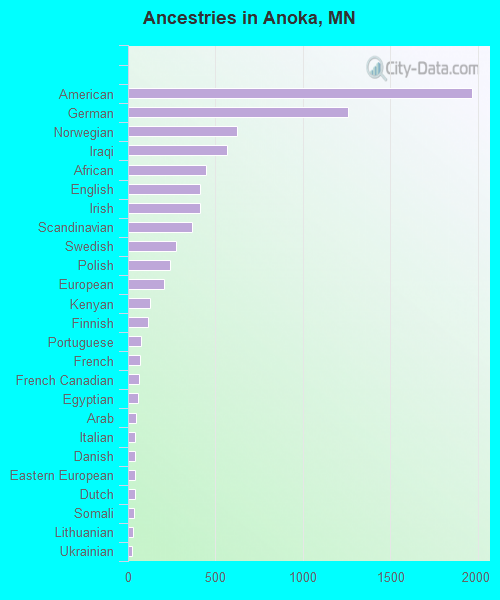
Ancestries in Anoka
1,966 21.9% American1,258 14.0% German621 6.9% Norwegian564 6.3% Iraqi447 5.0% African414 4.6% English412 4.6% Irish364 4.1% Scandinavian276 3.1% Swedish238 2.7% Polish203 2.3% European127 1.4% Kenyan115 1.3% Finnish74 0.8% Portuguese67 0.7% French63 0.7% French Canadian59 0.7% Egyptian46 0.5% Arab42 0.5% Italian41 0.5% Danish40 0.4% Eastern European38 0.4% Dutch32 0.4% Somali26 0.3% Lithuanian23 0.3% Ukrainian22 0.2% Romanian19 0.2% Scotch-Irish19 0.2% Slovak16 0.2% Russian13 0.1% Greek12 0.1% Czechoslovakian8 0.09% Syrian8 0.09% Hungarian6 0.07% British6 0.07% Slovene5 0.06% Scottish4 0.04% Czech2 0.02% Liberian1 0.01% Ghanaian
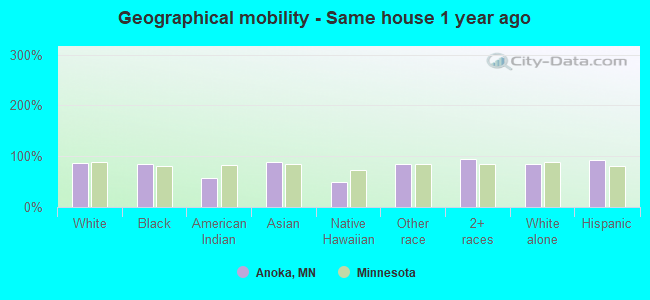
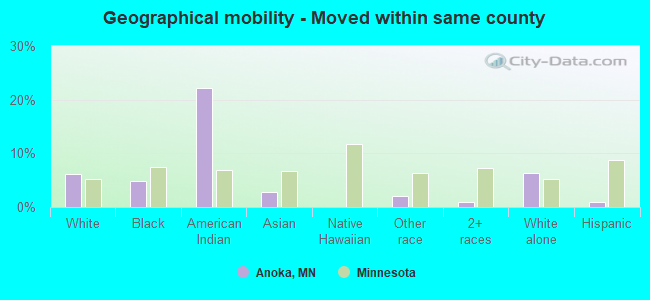
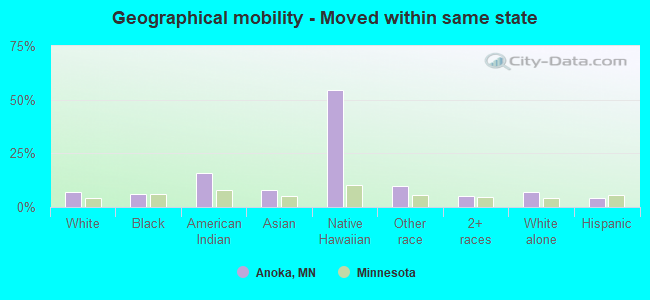
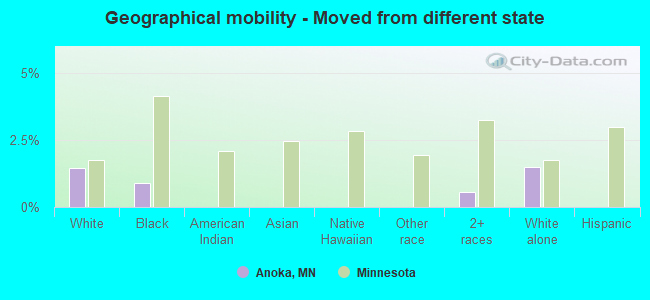
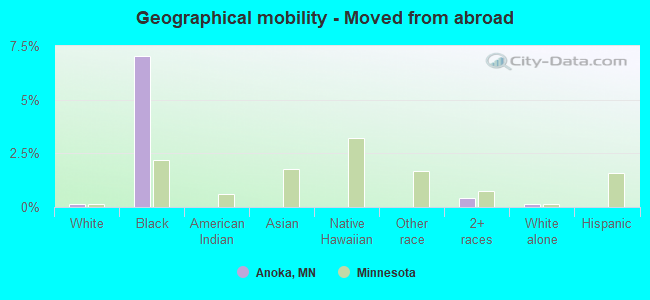
Geographical mobility in Anoka Same house 1 year ago 11,467 85.9% White (Caucasian)1,284 84.4% Black or African American86 57.4% American Indian / Alaska Native667 89.6% Asian14 48.7% Native Hawaiian / Pacific Islander395 84.0% Other race1,577 94.5% Two or more races11,386 85.6% White alone, not Hispanic / Latino1,087 92.9% Hispanic or LatinoMoved within same county 828 6.2% White / Caucasian74 4.9% Black or African American33 22.2% American Indian / Alaska Native21 2.9% Asian10 2.1% Other race17 1.0% Two or more races851 6.4% White alone, not Hispanic / Latino12 1.0% Hispanic or LatinoMoved within same state 908 6.8% White / Caucasian92 6.1% Black or African American24 15.8% American Indian / Alaska Native59 7.9% Asian16 54.3% Native Hawaiian / Pacific Islander47 9.9% Other race86 5.1% Two or more races923 6.9% White alone, not Hispanic / Latino47 4.0% Hispanic or LatinoMoved from different state 192 1.4% White / Caucasian14 0.9% Black or African American9 0.5% Two or more races197 1.5% White alone, not Hispanic / LatinoMoved from abroad 18 0.1% White107 7.0% Black or African American7 0.4% Two or more races18 0.1% White alone, not Hispanic / Latino
Children Nativity (place of birth) in Anoka
Children under 6 years - Living with two parents Both parents native 506 100.0% NativeBoth parents foreign-born 198 100.0% NativeOne native, one foreign-born parent 66 100.0% NativeChildren under 6 years - Living with one parent Native parent 184 100.0% NativeForeign-born parent 102 79.4% Native26 20.6% Foreign-bornChildren 6 to 17 years - Living with two parents Both parents native 888 93.8% Native59 6.2% Foreign-bornBoth parents foreign-born 95 59.5% Native65 40.5% Foreign-bornOne native, one foreign-born parent 233 88.3% Native31 11.7% Foreign-bornChildren 6 to 17 years - Living with one parent Native parent 688 100.0% NativeForeign-born parent 434 56.5% Native335 43.5% Foreign-born
Grandparents responsible for own grandchildren in Anoka
Grandparents (30 to 59 years) White / Caucasian 8 10.7% Responsible for grandchildren67 89.3% Not responsible for grandchildrenWhite alone, not Hispanic / Latino 8 10.1% Responsible for grandchildren72 89.9% Not responsible for grandchildrenGrandparents (60 years and over) White / Caucasian 43 20.9% Responsible for grandchildren163 79.1% Not responsible for grandchildrenWhite alone, not Hispanic / Latino 43 20.9% Responsible for grandchildren163 79.1% Not responsible for grandchildren