Races in Appleton, Wisconsin (WI) Detailed Stats
Data:
Races - White alone (%)
Races - White alone (% change since 2000)
Races - Black alone (%)
Races - Black alone (% change since 2000)
Races - American Indian alone (%)
Races - American Indian alone (% change since 2000)
Races - Asian alone (%)
Races - Asian alone (% change since 2000)
Races - Hispanic (%)
Races - Hispanic (% change since 2000)
Races - Native Hawaiian and Other Pacific Islander alone (%)
Races - Native Hawaiian and Other Pacific Islander alone (% change since 2000)
Races - Two or more races(%)
Races - Two or more races(% change since 2000)
Races - Other race alone (%)
Races - Other race alone (% change since 2000)
Racial diversity
Place of birth - Born in state of residence (%)
Place of birth - Born in state of residence (%) - White
Place of birth - Born in state of residence (%) - Black or African American
Place of birth - Born in state of residence (%) - Asian
Place of birth - Born in state of residence (%) - Hispanic or Latino
Place of birth - Born in state of residence (%) - American Indian and Alaska Native
Place of birth - Born in state of residence (%) - Multirace
Place of birth - Born in state of residence (%) - Other Race
Place of birth - Born in other state (%)
Place of birth - Born in other state (%) - White
Place of birth - Born in other state (%) - Black or African American
Place of birth - Born in other state (%) - Asian
Place of birth - Born in other state (%) - Hispanic or Latino
Place of birth - Born in other state (%) - American Indian and Alaska Native
Place of birth - Born in other state (%) - Multirace
Place of birth - Born in other state (%) - Other Race
Place of birth - Native, outside of US (%)
Place of birth - Native, outside of US (%) - White
Place of birth - Native, outside of US (%) - Black or African American
Place of birth - Native, outside of US (%) - Asian
Place of birth - Native, outside of US (%) - Hispanic or Latino
Place of birth - Native, outside of US (%) - American Indian and Alaska Native
Place of birth - Native, outside of US (%) - Multirace
Place of birth - Native, outside of US (%) - Other Race
Place of birth - Foreign born (%)
Place of birth - Foreign born (%) - White
Place of birth - Foreign born (%) - Black or African American
Place of birth - Foreign born (%) - Asian
Place of birth - Foreign born (%) - Hispanic or Latino
Place of birth - Foreign born (%) - American Indian and Alaska Native
Place of birth - Foreign born (%) - Multirace
Place of birth - Foreign born (%) - Other Race
Residents speaking English at home (%)
Residents speaking English at home - Born in the United States (%)
Residents speaking English at home - Native, born elsewhere (%)
Residents speaking English at home - Foreign born (%)
Residents speaking Spanish at home (%)
Residents speaking Spanish at home - Born in the United States (%)
Residents speaking Spanish at home - Native, born elsewhere (%)
Residents speaking Spanish at home - Foreign born (%)
Residents speaking other language at home (%)
Residents speaking other language at home - Born in the United States (%)
Residents speaking other language at home - Native, born elsewhere (%)
Residents speaking other language at home - Foreign born (%)
Marital status - Never married (%)
Marital status - Now married (%)
Marital status - Separated (%)
Marital status - Widowed (%)
Marital status - Divorced (%)
Ancestries Reported - Arab (%)
Ancestries Reported - Czech (%)
Ancestries Reported - Danish (%)
Ancestries Reported - Dutch (%)
Ancestries Reported - English (%)
Ancestries Reported - French (%)
Ancestries Reported - French Canadian (%)
Ancestries Reported - German (%)
Ancestries Reported - Greek (%)
Ancestries Reported - Hungarian (%)
Ancestries Reported - Irish (%)
Ancestries Reported - Italian (%)
Ancestries Reported - Lithuanian (%)
Ancestries Reported - Norwegian (%)
Ancestries Reported - Polish (%)
Ancestries Reported - Portuguese (%)
Ancestries Reported - Russian (%)
Ancestries Reported - Scotch-Irish (%)
Ancestries Reported - Scottish (%)
Ancestries Reported - Slovak (%)
Ancestries Reported - Subsaharan African (%)
Ancestries Reported - Swedish (%)
Ancestries Reported - Swiss (%)
Ancestries Reported - Ukrainian (%)
Ancestries Reported - United States (%)
Ancestries Reported - Welsh (%)
Ancestries Reported - West Indian (%)
Ancestries Reported - Other (%)
Geographical mobility - Same house 1 year ago (%)
Geographical mobility - Same house 1 year ago (%) - White
Geographical mobility - Same house 1 year ago (%) - Black or African American
Geographical mobility - Same house 1 year ago (%) - Asian
Geographical mobility - Same house 1 year ago (%) - Hispanic or Latino
Geographical mobility - Same house 1 year ago (%) - American Indian and Alaska Native
Geographical mobility - Same house 1 year ago (%) - Multirace
Geographical mobility - Same house 1 year ago (%) - Other Race
Geographical mobility - Moved within same county (%)
Geographical mobility - Moved within same county (%) - White
Geographical mobility - Moved within same county (%) - Black or African American
Geographical mobility - Moved within same county (%) - Asian
Geographical mobility - Moved within same county (%) - Hispanic or Latino
Geographical mobility - Moved within same county (%) - American Indian and Alaska Native
Geographical mobility - Moved within same county (%) - Multirace
Geographical mobility - Moved within same county (%) - Other Race
Geographical mobility - Moved from different county within same state (%)
Geographical mobility - Moved from different county within same state (%) - White
Geographical mobility - Moved from different county within same state (%) - Black or African American
Geographical mobility - Moved from different county within same state (%) - Asian
Geographical mobility - Moved from different county within same state (%) - Hispanic or Latino
Geographical mobility - Moved from different county within same state (%) - American Indian and Alaska Native
Geographical mobility - Moved from different county within same state (%) - Multirace
Geographical mobility - Moved from different county within same state (%) - Other Race
Geographical mobility - Moved from different state (%)
Geographical mobility - Moved from different state (%) - White
Geographical mobility - Moved from different state (%) - Black or African American
Geographical mobility - Moved from different state (%) - Asian
Geographical mobility - Moved from different state (%) - Hispanic or Latino
Geographical mobility - Moved from different state (%) - American Indian and Alaska Native
Geographical mobility - Moved from different state (%) - Multirace
Geographical mobility - Moved from different state (%) - Other Race
Geographical mobility - Moved from abroad (%)
Geographical mobility - Moved from abroad (%) - White
Geographical mobility - Moved from abroad (%) - Black or African American
Geographical mobility - Moved from abroad (%) - Asian
Geographical mobility - Moved from abroad (%) - Hispanic or Latino
Geographical mobility - Moved from abroad (%) - American Indian and Alaska Native
Geographical mobility - Moved from abroad (%) - Multirace
Geographical mobility - Moved from abroad (%) - Other Race
Place of birth for the foreign-born population - Ireland (%)
Place of birth for the foreign-born population - Denmark (%)
Place of birth for the foreign-born population - Norway (%)
Place of birth for the foreign-born population - Sweden (%)
Place of birth for the foreign-born population - United Kingdom (%)
Place of birth for the foreign-born population - England (%)
Place of birth for the foreign-born population - Scotland (%)
Place of birth for the foreign-born population - Other Northern Europe (%)
Place of birth for the foreign-born population - Austria (%)
Place of birth for the foreign-born population - Belgium (%)
Place of birth for the foreign-born population - France (%)
Place of birth for the foreign-born population - Germany (%)
Place of birth for the foreign-born population - Netherlands (%)
Place of birth for the foreign-born population - Switzerland (%)
Place of birth for the foreign-born population - Other Western Europe (%)
Place of birth for the foreign-born population - Greece (%)
Place of birth for the foreign-born population - Italy (%)
Place of birth for the foreign-born population - Portugal (%)
Place of birth for the foreign-born population - Spain (%)
Place of birth for the foreign-born population - Other Southern Europe (%)
Place of birth for the foreign-born population - Albania (%)
Place of birth for the foreign-born population - Belarus (%)
Place of birth for the foreign-born population - Bosnia and Herzegovina (%)
Place of birth for the foreign-born population - Bulgaria (%)
Place of birth for the foreign-born population - Croatia (%)
Place of birth for the foreign-born population - Czechoslovakia (%)
Place of birth for the foreign-born population - Hungary (%)
Place of birth for the foreign-born population - Latvia (%)
Place of birth for the foreign-born population - Lithuania (%)
Place of birth for the foreign-born population - North Macedonia (Macedonia) (%)
Place of birth for the foreign-born population - Moldova (%)
Place of birth for the foreign-born population - Poland (%)
Place of birth for the foreign-born population - Romania (%)
Place of birth for the foreign-born population - Russia (%)
Place of birth for the foreign-born population - Serbia (%)
Place of birth for the foreign-born population - Ukraine (%)
Place of birth for the foreign-born population - Other Eastern Europe (%)
Place of birth for the foreign-born population - China (%)
Place of birth for the foreign-born population - Hong Kong (%)
Place of birth for the foreign-born population - Taiwan (%)
Place of birth for the foreign-born population - Japan (%)
Place of birth for the foreign-born population - Korea (%)
Place of birth for the foreign-born population - Other Eastern Asia (%)
Place of birth for the foreign-born population - Afghanistan (%)
Place of birth for the foreign-born population - Bangladesh (%)
Place of birth for the foreign-born population - India (%)
Place of birth for the foreign-born population - Iran (%)
Place of birth for the foreign-born population - Kazakhstan (%)
Place of birth for the foreign-born population - Nepal (%)
Place of birth for the foreign-born population - Pakistan (%)
Place of birth for the foreign-born population - Sri Lanka (%)
Place of birth for the foreign-born population - Uzbekistan (%)
Place of birth for the foreign-born population - Other South Central Asia (%)
Place of birth for the foreign-born population - Burma (%)
Place of birth for the foreign-born population - Cambodia (%)
Place of birth for the foreign-born population - Indonesia (%)
Place of birth for the foreign-born population - Laos (%)
Place of birth for the foreign-born population - Malaysia (%)
Place of birth for the foreign-born population - Philippines (%)
Place of birth for the foreign-born population - Singapore (%)
Place of birth for the foreign-born population - Thailand (%)
Place of birth for the foreign-born population - Vietnam (%)
Place of birth for the foreign-born population - Other South Eastern Asia (%)
Place of birth for the foreign-born population - Armenia (%)
Place of birth for the foreign-born population - Iraq (%)
Place of birth for the foreign-born population - Israel (%)
Place of birth for the foreign-born population - Jordan (%)
Place of birth for the foreign-born population - Kuwait (%)
Place of birth for the foreign-born population - Lebanon (%)
Place of birth for the foreign-born population - Saudi Arabia (%)
Place of birth for the foreign-born population - Syria (%)
Place of birth for the foreign-born population - Turkey (%)
Place of birth for the foreign-born population - Yemen (%)
Place of birth for the foreign-born population - Other Western Asia (%)
Place of birth for the foreign-born population - Eritrea (%)
Place of birth for the foreign-born population - Ethiopia (%)
Place of birth for the foreign-born population - Kenya (%)
Place of birth for the foreign-born population - Somalia (%)
Place of birth for the foreign-born population - Uganda (%)
Place of birth for the foreign-born population - Zimbabwe (%)
Place of birth for the foreign-born population - Other Eastern Africa (%)
Place of birth for the foreign-born population - Cameroon (%)
Place of birth for the foreign-born population - Congo (%)
Place of birth for the foreign-born population - Democratic Republic of Congo (Zaire) (%)
Place of birth for the foreign-born population - Other Middle Africa (%)
Place of birth for the foreign-born population - Egypt (%)
Place of birth for the foreign-born population - Morocco (%)
Place of birth for the foreign-born population - Sudan (%)
Place of birth for the foreign-born population - Other Northern Africa (%)
Place of birth for the foreign-born population - South Africa (%)
Place of birth for the foreign-born population - Other Southern Africa (%)
Place of birth for the foreign-born population - Cabo Verde (%)
Place of birth for the foreign-born population - Ghana (%)
Place of birth for the foreign-born population - Liberia (%)
Place of birth for the foreign-born population - Nigeria (%)
Place of birth for the foreign-born population - Senegal (%)
Place of birth for the foreign-born population - Sierra Leone (%)
Place of birth for the foreign-born population - Other Western Africa (%)
Place of birth for the foreign-born population - Australia (%)
Place of birth for the foreign-born population - New Zealand (%)
Place of birth for the foreign-born population - Fiji (%)
Place of birth for the foreign-born population - Micronesia (%)
Place of birth for the foreign-born population - Bahamas (%)
Place of birth for the foreign-born population - Barbados (%)
Place of birth for the foreign-born population - Cuba (%)
Place of birth for the foreign-born population - Dominica (%)
Place of birth for the foreign-born population - Dominican Republic (%)
Place of birth for the foreign-born population - Grenada (%)
Place of birth for the foreign-born population - Haiti (%)
Place of birth for the foreign-born population - Jamaica (%)
Place of birth for the foreign-born population - St. Vincent and the Grenadines (%)
Place of birth for the foreign-born population - Trinidad and Tobago (%)
Place of birth for the foreign-born population - West Indies (%)
Place of birth for the foreign-born population - Other Caribbean (%)
Place of birth for the foreign-born population - Belize (%)
Place of birth for the foreign-born population - Costa Rica (%)
Place of birth for the foreign-born population - El Salvador (%)
Place of birth for the foreign-born population - Guatemala (%)
Place of birth for the foreign-born population - Honduras (%)
Place of birth for the foreign-born population - Mexico (%)
Place of birth for the foreign-born population - Nicaragua (%)
Place of birth for the foreign-born population - Panama (%)
Place of birth for the foreign-born population - Other Central America (%)
Place of birth for the foreign-born population - Argentina (%)
Place of birth for the foreign-born population - Bolivia (%)
Place of birth for the foreign-born population - Brazil (%)
Place of birth for the foreign-born population - Chile (%)
Place of birth for the foreign-born population - Colombia (%)
Place of birth for the foreign-born population - Ecuador (%)
Place of birth for the foreign-born population - Guyana (%)
Place of birth for the foreign-born population - Peru (%)
Place of birth for the foreign-born population - Uruguay (%)
Place of birth for the foreign-born population - Venezuela (%)
Place of birth for the foreign-born population - Other South America (%)
Place of birth for the foreign-born population - Canada (%)
Place of birth for the foreign-born population - Other Northern America (%)
Place of birth for the foreign-born population - Other (%)
Latest news about races in Appleton, WI collected exclusively by city-data.com from local newspapers, TV, and radio stations
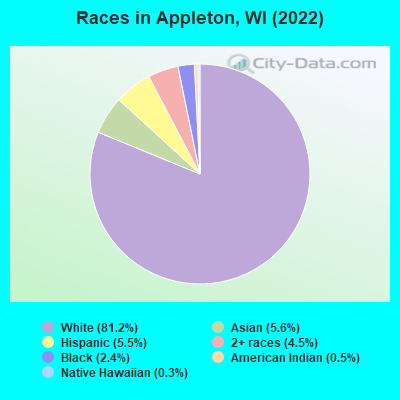
According to 2022 data, the most numerous races in Appleton, WI are White alone (60,906 residents), Hispanic (4,118 residents), and Black alone (1,818 residents). 90.8% of Appleton residents speak English at home. 6.5% of Appleton, WI residents are foreign-born (3.8% born in Asia, 1.3% born in Latin America), which is 22.8% greater than the foreign-born rate of 5.0% across the entire state of Wisconsin.
Race distribution in Appleton
2000 2022
4,681,630 87.3% White alone 300,245 5.6% Black alone 192,921 3.6% Hispanic 87,995 1.6% Asian alone 51,921 1.0% Two or more races 43,980 0.8% American Indian alone 3,637 0.07% Other race alone 1,346 0.03% Native Hawaiian and Other
4,654,031 79.0% White alone 447,022 7.6% Hispanic 345,678 5.9% Black alone 217,532 3.7% Two or more races 172,242 2.9% Asian alone 33,762 0.6% American Indian alone 19,680 0.3% Other race alone 2,592 0.04% Native Hawaiian and Other
Income and house value in Appleton Median household income in 2022 $76,443 White non-Hispanic householders$39,838 Black householders$58,874 American Indian and Alaska Native householders$94,122 Asian householders$33,231 Some other race householders$48,894 Two or more races householders$30,900 Hispanic or Latino race householdersMedian 2022 house value $216,262 White Non-Hispanic householders$410,656 Black or African American householders$228,412 American Indian or Alaska Native householders $202,566 Asian householders$187,766 Native Hawaiian and other Pacific Islander householders$279,661 Some other race householders$213,170 Two or more races householders$242,770 Hispanic or Latino householders
Median age by race in Appleton
41.2 Median age for White residents38.4 43.9 37.9 Median age for Black or African American residents37.2 51.0 27.0 Median age for American Indian / Alaska Native residents33.2 -666,666,666.0 29.5 Median age for Asian residents31.1 28.5 12.5 Median age for Native Hawaiian / Pacific Islander residents-666,666,666.0 -666,666,666.0 42.3 Median age for Other race residents42.1 54.3 19.4 Median age for Two or more races residents18.8 21.0 41.5 Median age for White alone residents39.3 44.1 27.7 Median age for Hispanic or Latino residents27.5 27.9
Owner/renter occupied households by race in Appleton
House owners and renters - White residents 19,620 67.0% Owner occupied9,678 33.0% Renter occupiedHouse owners and renters - Black or African American residents 189 35.4% Owner occupied345 64.6% Renter occupiedHouse owners and renters - American Indian / Alaska Native residents 73 69.0% Owner occupied33 31.0% Renter occupiedHouse owners and renters - Asian residents 726 64.9% Owner occupied392 35.1% Renter occupiedHouse owners and renters - Other race residents 214 45.9% Owner occupied252 54.1% Renter occupiedHouse owners and renters - Two or more races residents 881 48.5% Owner occupied935 51.5% Renter occupiedHouse owners and renters - White alone residents 19,527 67.2% Owner occupied9,515 32.8% Renter occupiedHouse owners and renters - Hispanic or Latino residents 457 33.5% Owner occupied909 66.5% Renter occupied
Language usage in Appleton
English speakers - Total 90.8% of residents of Appleton speak English at home.
2.5% of residents speak Spanish at home 797 45.6% Speak English very well950 54.4% Speak English less than very well6.7% of residents speak other language at home 3,241 67.6% Speak English very well1,555 32.4% Speak English less than very well
English speakers - Born in the United States 93.4% of residents of Appleton speak English at home.
2.8% of residents speak Spanish at home 472 94.6% Speak English very well27 5.4% Speak English less than very well3.7% of residents speak other language at home 599 91.6% Speak English very well55 8.4% Speak English less than very well
English speakers - Native, born elsewhere 57.6% of residents of Appleton speak English at home.
27.5% of residents speak Spanish at home 30 25.9% Speak English very well86 74.1% Speak English less than very well14.9% of residents speak other language at home 63 100.0% Speak English very well
English speakers - Foreign-born 6.9% of residents of Appleton speak English at home.
22.5% of residents speak Spanish at home 94 10.1% Speak English very well837 89.9% Speak English less than very well70.6% of residents speak other language at home 1,672 57.3% Speak English very well1,247 42.7% Speak English less than very well
White (Caucasian) - Speak only English Native:
98.1% (55,815)Foreign-born:
42.0% (346)
White (Caucasian) - Speak another language Native:
1.7% (972)Foreign-born:
53.3% (439)
Black or African American - Speak only English Native:
96.9% (1,481)Foreign-born:
23.7% (116)
Black or African American - Speak another language Native:
2.5% (38)Foreign-born:
80.6% (395)
American Indian / Alaska Native - Speak another language Native:
14.5% (42)Foreign-born:
100.0% (23)
Asian - Speak only English Native:
20.6% (335)Foreign-born:
3.9% (79)
Asian - Speak another language Native:
79.4% (1,289)Foreign-born:
96.1% (1,951)
Other race - Speak only English Native:
11.7% (64)Foreign-born:
1.4% (10)
Other race - Speak another language Native:
100.0% (547)Foreign-born:
100.0% (697)
Two or more races - Speak only English Native:
87.2% (4,156)Foreign-born:
2.7% (17)
Two or more races - Speak another language Native:
11.9% (568)Foreign-born:
95.9% (588)
White alone - Speak only English Native:
98.4% (55,194)Foreign-born:
43.9% (353)
White alone - Speak another language Native:
1.6% (883)Foreign-born:
50.8% (409)
Hispanic or Latino - Speak only English Native:
65.6% (2,170)Foreign-born:
1.6% (21)
Hispanic or Latino - Speak another language Native:
34.1% (1,130)Foreign-born:
98.4% (1,238)
Foreign-born residents in Appleton 4,907 residents are foreign born (3.8% Asia , 1.3% Latin America ).
This city:
6.5%Wisconsin:
5.0%
Marital status for residents in Appleton Marital status - White (Caucasian) population 15 years and over
Males 39.7% Never married47.9% Now married1.0% Separated3.1% Widowed8.4% DivorcedFemales 30.5% Never married50.3% Now married0.6% Separated6.8% Widowed11.9% DivorcedWomen who gave birth in the past 12 months Now married:
87.6% (687)Unmarried:
12.4% (97)
Women who did not give birth in the past 12 months Now married:
40.6% (5,692)Unmarried:
59.4% (8,336)
Marital status - Black or African American population 15 years and over
Males 56.7% Never married27.8% Now married2.8% Separated0.0% Widowed12.7% DivorcedFemales 52.1% Never married27.7% Now married5.0% Separated1.1% Widowed14.2% DivorcedWomen who gave birth in the past 12 months Now married:
0.0% (0)Unmarried:
100.0% (29)
Women who did not give birth in the past 12 months Now married:
36.2% (169)Unmarried:
63.8% (298)
Marital status - American Indian / Alaska Native population 15 years and over
Males 52.1% Never married40.6% Now married0.0% Separated0.0% Widowed7.3% DivorcedFemales 48.2% Never married22.8% Now married0.0% Separated0.0% Widowed28.9% DivorcedWomen who gave birth in the past 12 months Now married:
0.0% (0)Unmarried:
100.0% (12)
Women who did not give birth in the past 12 months Now married:
14.9% (9)Unmarried:
85.1% (54)
Marital status - Asian population 15 years and over
Males 51.7% Never married44.0% Now married0.0% Separated0.0% Widowed4.3% DivorcedFemales 33.3% Never married53.2% Now married0.5% Separated7.9% Widowed5.0% DivorcedWomen who gave birth in the past 12 months Now married:
33.3% (18)Unmarried:
66.7% (36)
Women who did not give birth in the past 12 months Now married:
53.7% (583)Unmarried:
46.3% (502)
Marital status - Other race population 15 years and over
Males 25.2% Never married54.4% Now married0.0% Separated0.0% Widowed20.4% DivorcedFemales 40.7% Never married51.9% Now married0.0% Separated3.9% Widowed3.5% DivorcedWomen who gave birth in the past 12 months Now married:
100.0% (14)Unmarried:
0.0% (0)
Women who did not give birth in the past 12 months Now married:
54.8% (78)Unmarried:
45.2% (64)
Marital status - Two or more races population 15 years and over
Males 54.5% Never married39.0% Now married0.0% Separated0.0% Widowed6.5% DivorcedFemales 50.0% Never married34.7% Now married1.0% Separated0.2% Widowed14.1% DivorcedWomen who gave birth in the past 12 months Now married:
0.0% (0)Unmarried:
100.0% (30)
Women who did not give birth in the past 12 months Now married:
34.8% (407)Unmarried:
65.2% (764)
Marital status - White alone, not Hispanic / Latino population 15 years and over
Males 38.9% Never married48.5% Now married1.0% Separated3.1% Widowed8.5% DivorcedFemales 30.4% Never married50.1% Now married0.6% Separated6.9% Widowed12.0% DivorcedWomen who gave birth in the past 12 months Now married:
91.0% (687)Unmarried:
9.0% (68)
Women who did not give birth in the past 12 months Now married:
39.8% (5,510)Unmarried:
60.2% (8,336)
Marital status - Hispanic or Latino population 15 years and over
Males 47.7% Never married41.2% Now married0.0% Separated0.0% Widowed11.1% DivorcedFemales 45.9% Never married36.5% Now married3.8% Separated0.9% Widowed12.9% DivorcedWomen who gave birth in the past 12 months Now married:
61.3% (46)Unmarried:
38.7% (29)
Women who did not give birth in the past 12 months Now married:
40.7% (375)Unmarried:
59.3% (547)
Ancestries in Appleton
11,778 34.9% German2,125 6.3% American1,701 5.0% Polish1,149 3.4% Irish1,146 3.4% English1,117 3.3% European674 2.0% Dutch553 1.6% Norwegian355 1.1% Italian354 1.0% Scandinavian212 0.6% Swedish193 0.6% Czech166 0.5% Belgian152 0.5% Eastern European134 0.4% French118 0.3% French Canadian117 0.3% Scottish115 0.3% Croatian88 0.3% Finnish85 0.3% Scotch-Irish70 0.2% Greek58 0.2% Danish57 0.2% Canadian57 0.2% Ukrainian40 0.1% Ethiopian35 0.1% Northern European34 0.1% Hungarian32 0.09% British26 0.08% Turkish25 0.07% Austrian25 0.07% Russian24 0.07% Jamaican19 0.06% Welsh17 0.05% Swiss16 0.05% Luxembourger14 0.04% Lithuanian12 0.04% Czechoslovakian12 0.04% Nigerian8 0.02% Latvian8 0.02% Portuguese6 0.02% Lebanese4 0.01% Liberian3 0.01% Haitian2 0.01% Serbian
Geographical mobility in Appleton Same house 1 year ago 54,610 89.2% White (Caucasian)969 53.3% Black or African American307 78.6% American Indian / Alaska Native3,912 81.2% Asian72 100.0% Native Hawaiian / Pacific Islander811 78.8% Other race5,165 87.0% Two or more races53,885 89.6% White alone, not Hispanic / Latino4,290 85.9% Hispanic or LatinoMoved within same county 2,287 3.7% White / Caucasian199 10.9% Black or African American25 6.4% American Indian / Alaska Native101 2.1% Asian122 11.9% Other race325 5.5% Two or more races2,258 3.8% White alone, not Hispanic / Latino304 6.1% Hispanic or LatinoMoved within same state 2,999 4.9% White / Caucasian182 10.0% Black or African American71 18.2% American Indian / Alaska Native539 11.2% Asian44 4.3% Other race164 2.8% Two or more races2,910 4.8% White alone, not Hispanic / Latino88 1.8% Hispanic or LatinoMoved from different state 1,254 2.0% White / Caucasian14 0.8% Black or African American12 3.1% American Indian / Alaska Native17 0.4% Asian13 1.2% Other race246 4.2% Two or more races1,109 1.8% White alone, not Hispanic / Latino189 3.8% Hispanic or LatinoMoved from abroad 98 0.2% White454 25.0% Black or African American164 3.4% Asian31 3.0% Other race48 1.0% Hispanic or Latino
Children Nativity (place of birth) in Appleton
Children under 6 years - Living with two parents Both parents native 3,453 99.7% Native11 0.3% Foreign-bornBoth parents foreign-born 195 100.0% NativeOne native, one foreign-born parent 266 96.6% Native9 3.4% Foreign-bornChildren under 6 years - Living with one parent Native parent 1,387 100.0% NativeForeign-born parent 26 100.0% NativeChildren 6 to 17 years - Living with two parents Both parents native 6,567 99.0% Native69 1.0% Foreign-bornBoth parents foreign-born 452 59.6% Native306 40.4% Foreign-bornOne native, one foreign-born parent 444 96.8% Native15 3.2% Foreign-bornChildren 6 to 17 years - Living with one parent Native parent 3,253 100.0% NativeForeign-born parent 134 61.8% Native82 38.2% Foreign-born
Grandparents responsible for own grandchildren in Appleton
Grandparents (30 to 59 years) White / Caucasian 130 65.9% Responsible for grandchildren67 34.1% Not responsible for grandchildrenAsian 7 21.9% Responsible for grandchildren27 78.1% Not responsible for grandchildrenWhite alone, not Hispanic / Latino 135 65.9% Responsible for grandchildren70 34.1% Not responsible for grandchildrenGrandparents (60 years and over) White / Caucasian 88 39.6% Responsible for grandchildren134 60.4% Not responsible for grandchildrenAsian 33 100.0% Not responsible for grandchildrenWhite alone, not Hispanic / Latino 89 39.0% Responsible for grandchildren139 61.0% Not responsible for grandchildren