Races in Archdale, North Carolina (NC) Detailed Stats
Ancestries, Foreign-born residents, place of birth
Settings
X


Recent posts about races in Archdale, North Carolina on our local forum with over 2,400,000 registered users:
 | Need info on Greensboro w Salem for possible move (52 replies) |
| Regions of North Carolina (39 replies) |
| Walking to Archdale Station (4 replies) |
| Possible relocation to Charlotte....not impressed, HELP! (130 replies) |
| CMPD says NO definitive evidence of Scott pointing gun. (224 replies) |
| House Building (6 replies) |
Latest news about races in Archdale, NC collected exclusively by city-data.com from local newspapers, TV, and radio stations
According to 2022 data, the most numerous races in Archdale, NC are White alone (9,439 residents), Black alone (789 residents), and Hispanic (747 residents). 90.5% of Archdale residents speak English at home. 6.6% of Archdale, NC residents are foreign-born (3.2% born in Asia, 1.7% born in Latin America, 1.1% born in Europe), which is 21.6% less than the foreign-born rate of 8.0% across the entire state of North Carolina.
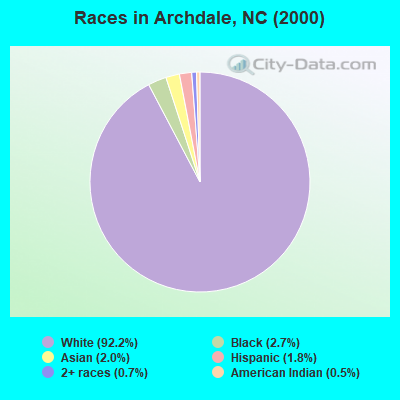
Race distribution in Archdale
2000
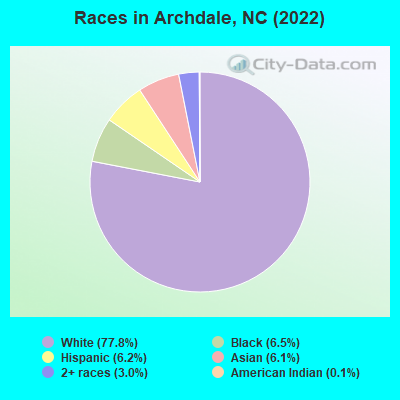
2022

- 8,31592.2%White alone
- 2472.7%Black alone
- 1832.0%Asian alone
- 1631.8%Hispanic
- 600.7%Two or more races
- 420.5%American Indian alone
- 30.03%Other race alone
- 10.01%Native Hawaiian and Other
Pacific Islander alone
-
- 9,43977.8%White alone
- 7896.5%Black alone
- 7476.2%Hispanic
- 7366.1%Asian alone
- 3633.0%Two or more races
- 160.1%American Indian alone
2000
2022
-
- 5,647,15570.2%White alone
- 1,723,30121.4%Black alone
- 378,9634.7%Hispanic
- 112,4161.4%Asian alone
- 95,3331.2%American Indian alone
- 79,9651.0%Two or more races
- 9,0150.1%Other race alone
- 3,1650.04%Native Hawaiian and Other
Pacific Islander alone

-
- 6,497,51960.7%White alone
- 2,155,65020.1%Black alone
- 1,114,79910.4%Hispanic
- 438,0614.1%Two or more races
- 341,0523.2%Asian alone
- 91,7580.9%American Indian alone
- 50,1800.5%Other race alone
- 9,9540.09%Native Hawaiian and Other
Pacific Islander alone

Income and house value in Archdale
- Median household income in 2022
- $60,677White non-Hispanic householders
- $63,148Black householders
- $79,528Some other race householders
- $57,228Two or more races householders
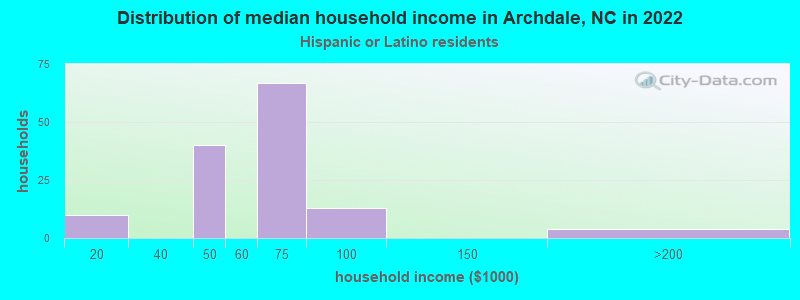
- $77,230Hispanic or Latino race householders
- Median 2022 house value
- $190,753White Non-Hispanic householders
- $232,213Black or African American householders
- $114,109American Indian or Alaska Native householders
- $165,459Asian householders
- $142,637Some other race householders
- $261,501Two or more races householders
- $142,637Hispanic or Latino householders
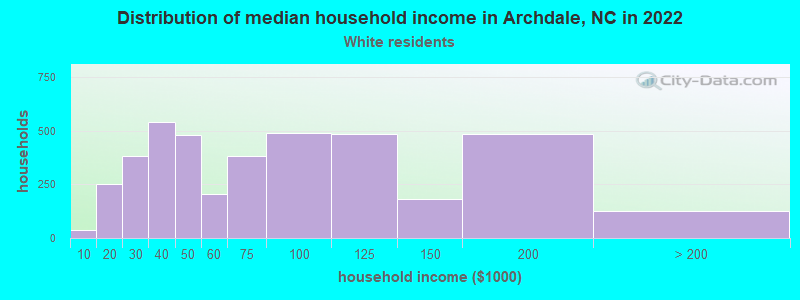
Household income for White non-Hispanic householders
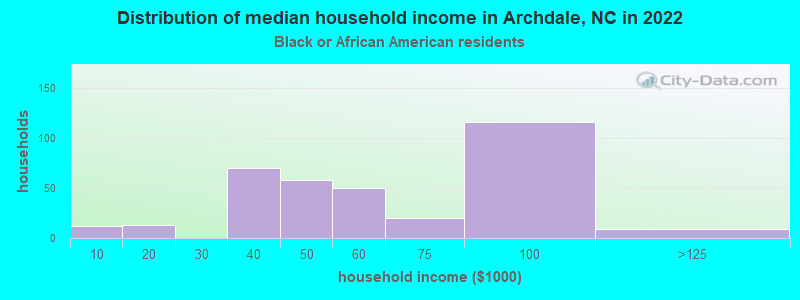
Household income for Black householders
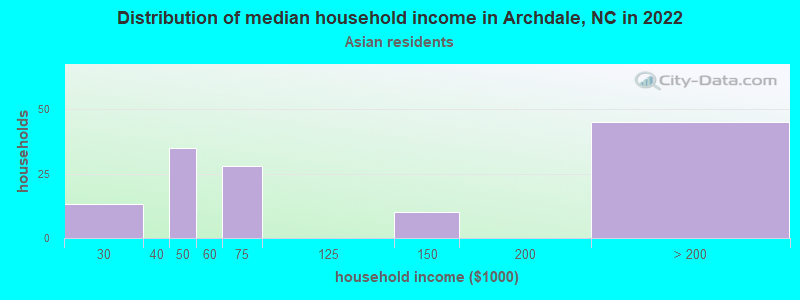
Household income for Asian householders
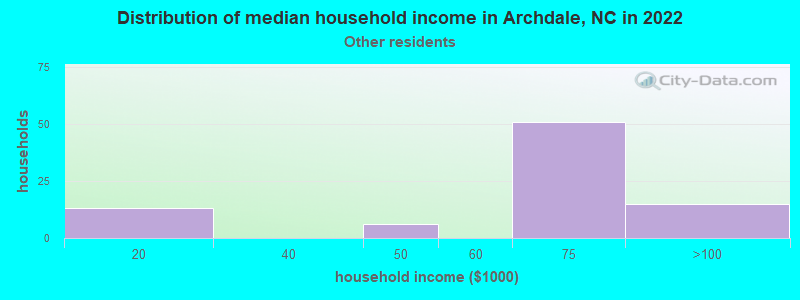
Household income for Some other race householders
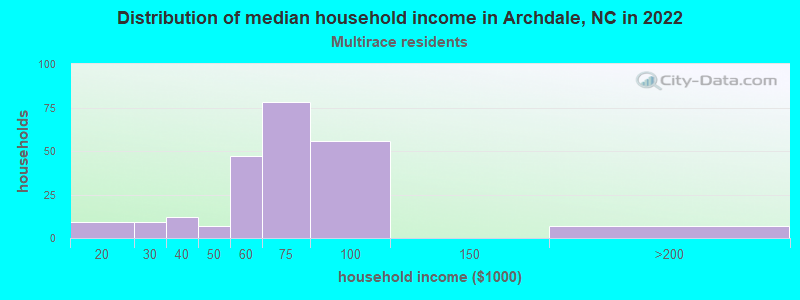
Household income for Two or more races householders
Household income for Hispanic or Latino race householders
Median age by race in Archdale
- 49.5Median age for White residents
- 49.6Males
- 49.4Females
- 43.0Median age for Black or African American residents
- 39.3Males
- 45.8Females
- -578,651,684.8Median age for American Indian / Alaska Native residents
- -895,686,273.6Males
- -664,495,113.3Females
- 34.1Median age for Asian residents
- 59.4Males
- 31.8Females
- -609,884,331.7Median age for Native Hawaiian / Pacific Islander residents
- -666,666,666.0Males
- -612,403,100.2Females
- 22.3Median age for Other race residents
- 23.9Males
- 22.9Females
- 27.8Median age for Two or more races residents
- 18.4Males
- 74.3Females
- 50.5Median age for White alone residents
- 49.4Males
- 51.4Females
- 22.5Median age for Hispanic or Latino residents
- 25.5Males
- 23.1Females
Owner/renter occupied households by race in Archdale
- House owners and renters - White residents
- 3,42785.8%Owner occupied
- 56614.2%Renter occupied
- House owners and renters - Black or African American residents
- 18755.5%Owner occupied
- 15144.5%Renter occupied
- House owners and renters - American Indian / Alaska Native residents
- 13100.0%Renter occupied
- House owners and renters - Asian residents
- 132100.0%Owner occupied
- House owners and renters - Other race residents
- 8794.5%Owner occupied
- 55.5%Renter occupied
- House owners and renters - Two or more races residents
- 11150.4%Owner occupied
- 10949.6%Renter occupied
- House owners and renters - White alone residents
- 3,42185.2%Owner occupied
- 59214.8%Renter occupied
- House owners and renters - Hispanic or Latino residents
- 11784.7%Owner occupied
- 2115.3%Renter occupied
Language usage in Archdale
- English speakers - Total
- 90.5% of residents of Archdale speak English at home.
- 4.0% of residents speak Spanish at home
- 29663.7%Speak English very well
- 16936.3%Speak English less than very well
- 6.2% of residents speak other language at home
- 23032.4%Speak English very well
- 48067.6%Speak English less than very well
- English speakers - Born in the United States
- 96.2% of residents of Archdale speak English at home.
- 3.1% of residents speak Spanish at home
- 107100.0%Speak English very well
- 0.4% of residents speak other language at home
- 14100.0%Speak English very well
- English speakers - Native, born elsewhere
- 0.0% of residents of Archdale speak English at home.
- 200.0% of residents speak Spanish at home
- 34100.0%Speak English very well
- English speakers - Foreign-born
- 16.8% of residents of Archdale speak English at home.
- 18.6% of residents speak Spanish at home
- 136100.0%Speak English less than very well
- 81.7% of residents speak other language at home
- 20834.8%Speak English very well
- 38965.2%Speak English less than very well
White (Caucasian) - Speak only English
| Native: | 100.0% (8,810) |
| Foreign-born: | 57.7% (59) |
White (Caucasian) - Speak another language
| Native: | 0.3% (26) |
| Foreign-born: | 55.2% (56) |
Black or African American - Speak another language
| Native: | 9.5% (74) |
| Foreign-born: | 99.2% (23) |
Asian - Speak only English
| Native: | 46.4% (129) |
| Foreign-born: | 12.3% (49) |
Asian - Speak another language
| Native: | 53.7% (149) |
| Foreign-born: | 87.8% (354) |
Other race - Speak another language
| Native: | 78.4% (261) |
| Foreign-born: | 98.9% (172) |
White alone - Speak only English
| Native: | 99.9% (8,765) |
| Foreign-born: | 16.6% (43) |
White alone - Speak another language
| Native: | 0.3% (24) |
| Foreign-born: | 100.0% (257) |
Hispanic or Latino - Speak only English
| Native: | 59.1% (335) |
| Foreign-born: | 14.8% (28) |
Hispanic or Latino - Speak another language
| Native: | 38.2% (216) |
| Foreign-born: | 84.6% (162) |
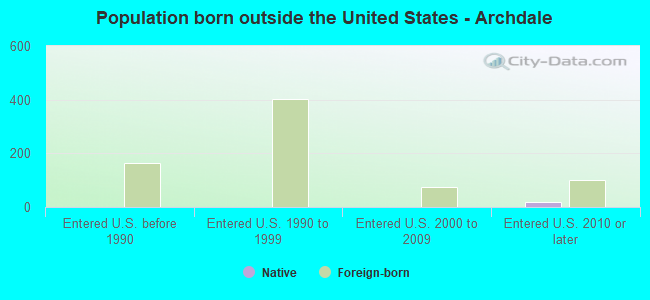
Foreign-born residents in Archdale
790 residents are foreign born (3.2% Asia, 1.7% Latin America, 1.1% Europe).
| This city: | 6.6% |
| North Carolina: | 8.3% |
Marital status for residents in Archdale
Marital status - White (Caucasian) population 15 years and over
- Males
- 22.9%Never married
- 58.1%Now married
- 1.7%Separated
- 2.5%Widowed
- 14.8%Divorced
- Females
- 21.4%Never married
- 48.3%Now married
- 2.1%Separated
- 11.8%Widowed
- 16.5%Divorced
Women who gave birth in the past 12 months
| Now married: | 100.0% (43) |
| Unmarried: | 0.0% (0) |
Women who did not give birth in the past 12 months
| Now married: | 47.7% (838) |
| Unmarried: | 52.3% (919) |
Marital status - Black or African American population 15 years and over
- Males
- 53.6%Never married
- 42.5%Now married
- 0.0%Separated
- 0.0%Widowed
- 3.9%Divorced
- Females
- 33.3%Never married
- 38.0%Now married
- 15.1%Separated
- 6.7%Widowed
- 6.9%Divorced
Women who did not give birth in the past 12 months
| Now married: | 51.6% (144) |
| Unmarried: | 48.4% (135) |
Marital status - Asian population 15 years and over
- Males
- 8.1%Never married
- 85.6%Now married
- 0.0%Separated
- 0.0%Widowed
- 6.3%Divorced
- Females
- 12.4%Never married
- 60.7%Now married
- 0.0%Separated
- 6.0%Widowed
- 20.9%Divorced
Women who did not give birth in the past 12 months
| Now married: | 41.8% (69) |
| Unmarried: | 58.2% (96) |
Marital status - Other race population 15 years and over
- Males
- 51.8%Never married
- 29.2%Now married
- 0.0%Separated
- 0.0%Widowed
- 19.0%Divorced
- Females
- 22.0%Never married
- 41.0%Now married
- 37.0%Separated
- 0.0%Widowed
- 0.0%Divorced
Women who did not give birth in the past 12 months
| Now married: | 80.0% (93) |
| Unmarried: | 20.0% (23) |
Marital status - Two or more races population 15 years and over
- Males
- 55.7%Never married
- 44.3%Now married
- 0.0%Separated
- 0.0%Widowed
- 0.0%Divorced
- Females
- 10.1%Never married
- 39.9%Now married
- 0.0%Separated
- 4.7%Widowed
- 45.3%Divorced
Women who did not give birth in the past 12 months
| Now married: | 23.2% (18) |
| Unmarried: | 76.8% (59) |
Marital status - White alone, not Hispanic / Latino population 15 years and over
- Males
- 22.8%Never married
- 58.6%Now married
- 1.7%Separated
- 2.5%Widowed
- 14.3%Divorced
- Females
- 19.8%Never married
- 49.3%Now married
- 1.8%Separated
- 12.1%Widowed
- 17.0%Divorced
Women who gave birth in the past 12 months
| Now married: | 100.0% (45) |
| Unmarried: | 0.0% (0) |
Women who did not give birth in the past 12 months
| Now married: | 49.8% (845) |
| Unmarried: | 50.2% (850) |
Marital status - Hispanic or Latino population 15 years and over
- Males
- 38.4%Never married
- 41.8%Now married
- 0.0%Separated
- 0.0%Widowed
- 19.8%Divorced
- Females
- 53.3%Never married
- 26.0%Now married
- 20.7%Separated
- 0.0%Widowed
- 0.0%Divorced
Women who did not give birth in the past 12 months
| Now married: | 42.1% (107) |
| Unmarried: | 57.9% (147) |
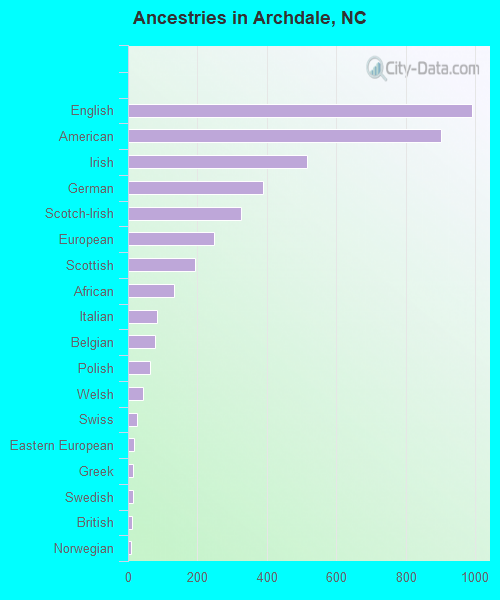
Ancestries in Archdale

- 99113.5%English
- 90212.3%American
- 5157.0%Irish
- 3905.3%German
- 3254.4%Scotch-Irish
- 2493.4%European
- 1932.6%Scottish
- 1331.8%African
- 831.1%Italian
- 771.0%Belgian
- 640.9%Polish
- 440.6%Welsh
- 250.3%Swiss
- 170.2%Eastern European
- 130.2%Greek
- 130.2%Swedish
- 120.2%British
- 100.1%Norwegian
- 80.1%French
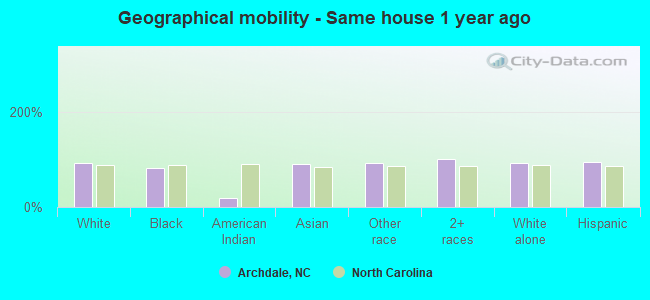
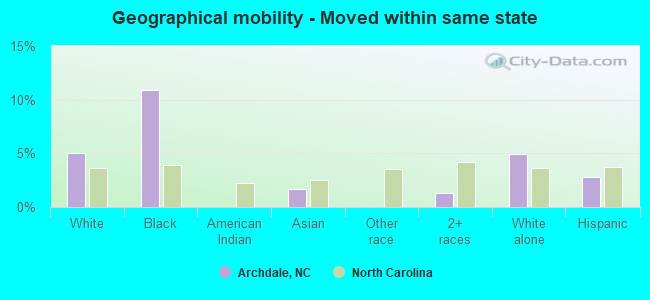
Geographical mobility in Archdale

- Same house 1 year ago
- 8,56493.1%White (Caucasian)
- 65681.1%Black or African American
- 319.3%American Indian / Alaska Native
- 67391.0%Asian
- 44691.7%Other race
- 635100.0%Two or more races
- 8,60093.0%White alone, not Hispanic / Latino
- 70794.5%Hispanic or Latino
-
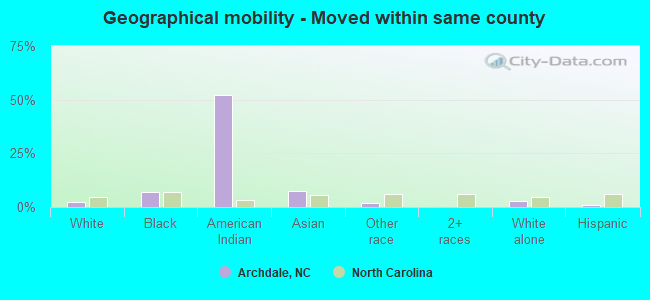
- Moved within same county
- 2272.5%White / Caucasian
- 567.0%Black or African American
- 952.2%American Indian / Alaska Native
- 567.6%Asian
- 102.1%Other race
- 2432.6%White alone, not Hispanic / Latino
- 81.0%Hispanic or Latino
-
- Moved within same state
- 4625.0%White / Caucasian
- 8810.9%Black or African American
- 121.7%Asian
- 81.3%Two or more races
- 4584.9%White alone, not Hispanic / Latino
- 212.8%Hispanic or Latino
-
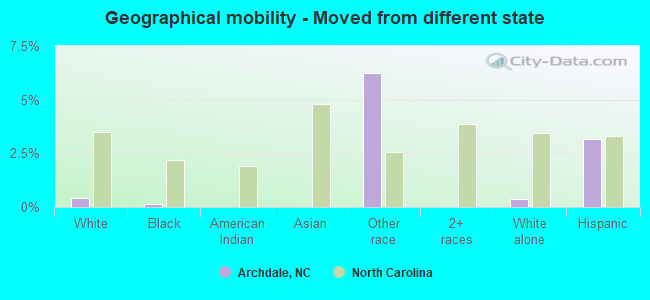
- Moved from different state
- 390.4%White / Caucasian
- 10.1%Black or African American
- 306.2%Other race
- 360.4%White alone, not Hispanic / Latino
- 243.2%Hispanic or Latino
-
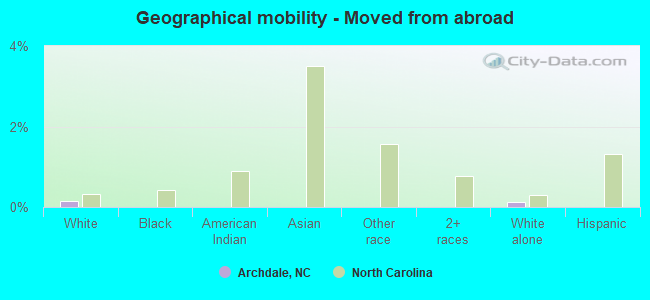
- Moved from abroad
- 130.1%White
- 130.1%White alone, not Hispanic / Latino
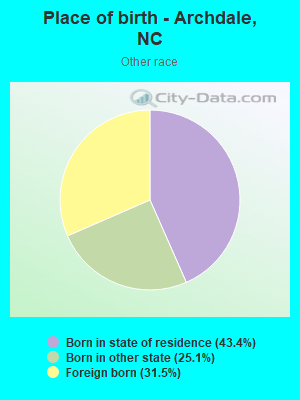
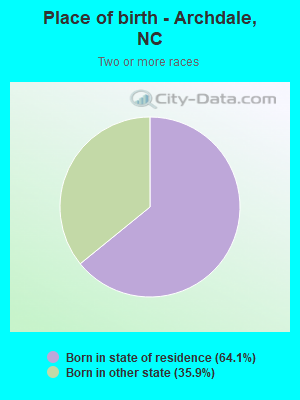
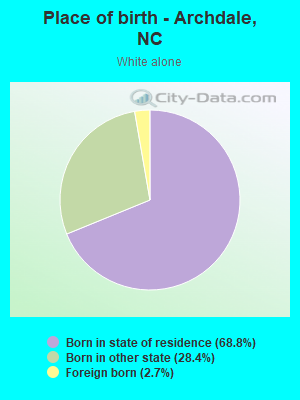
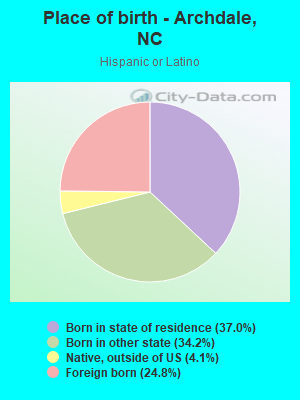
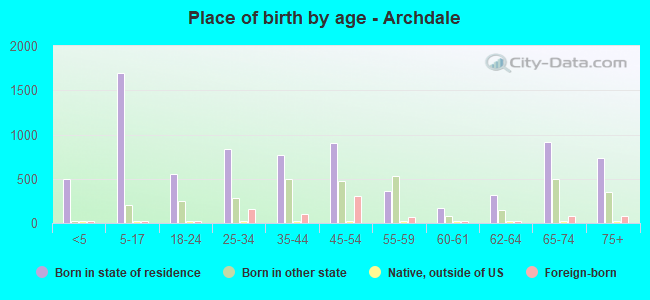
Children Nativity (place of birth) in Archdale
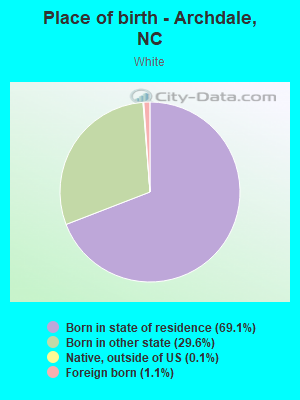
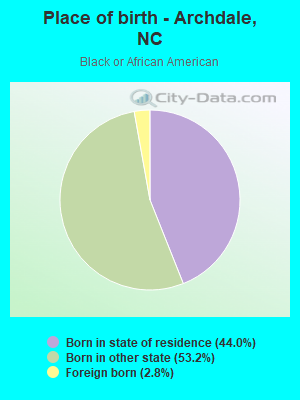
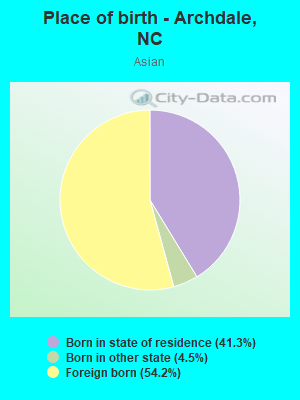
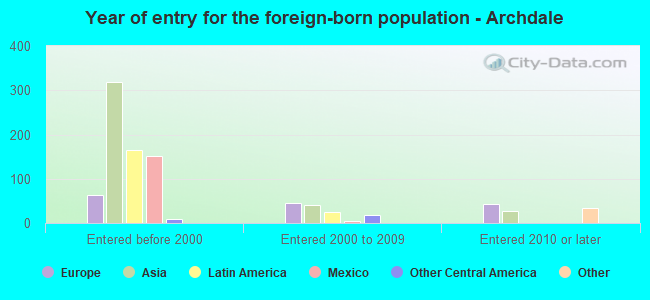
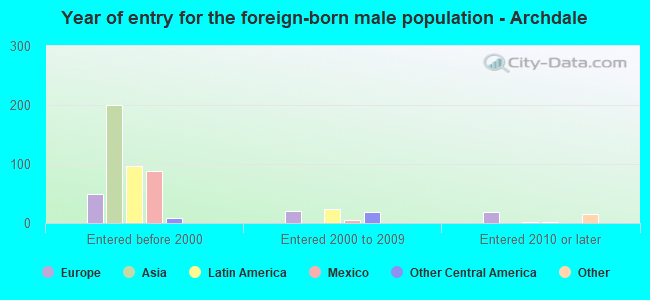
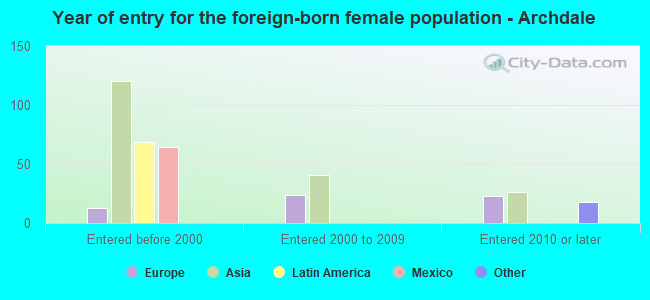
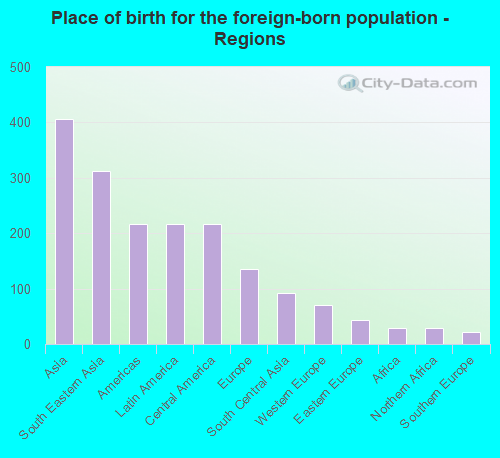
Place of birth for residents in Archdale
![Place of birth for the foreign-born population - Regions]()
- 406Asia
- 313South Eastern Asia
- 217Americas
- 217Latin America
- 217Central America
- 136Europe
- 92South Central Asia
- 71Western Europe
- 43Eastern Europe
- 29Africa
- 29Northern Africa
- 21Southern Europe
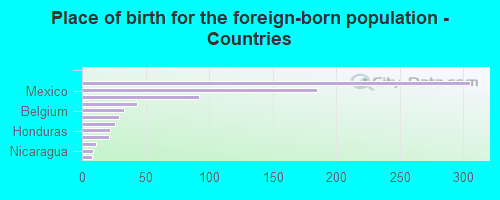
![Place of birth for the foreign-born population - Countries]()
- 305Vietnam
- 185Mexico
- 92Pakistan
- 43Poland
- 33Belgium
- 29Algeria
- 26Germany
- 22Honduras
- 21Italy
- 11Switzerland
- 9Nicaragua
- 8Thailand