Races in Ardmore, Pennsylvania (PA) Detailed Stats
Data:
Races - White alone (%)
Races - White alone (% change since 2000)
Races - Black alone (%)
Races - Black alone (% change since 2000)
Races - American Indian alone (%)
Races - American Indian alone (% change since 2000)
Races - Asian alone (%)
Races - Asian alone (% change since 2000)
Races - Hispanic (%)
Races - Hispanic (% change since 2000)
Races - Native Hawaiian and Other Pacific Islander alone (%)
Races - Native Hawaiian and Other Pacific Islander alone (% change since 2000)
Races - Two or more races(%)
Races - Two or more races(% change since 2000)
Races - Other race alone (%)
Races - Other race alone (% change since 2000)
Racial diversity
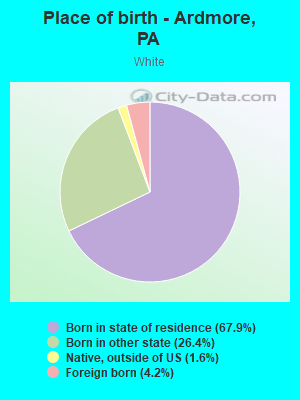
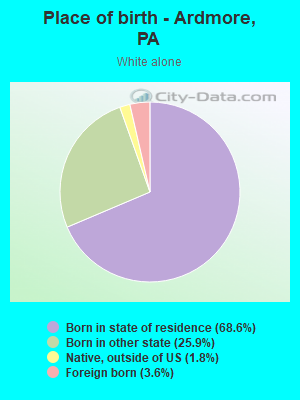
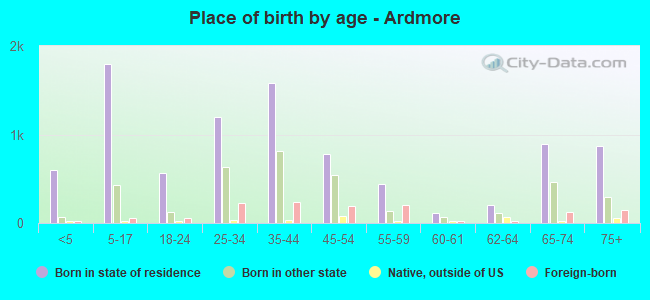
Place of birth - Born in state of residence (%)
Place of birth - Born in state of residence (%) - White
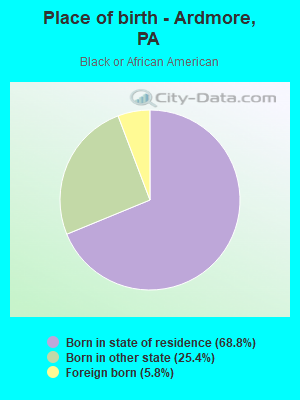
Place of birth - Born in state of residence (%) - Black or African American
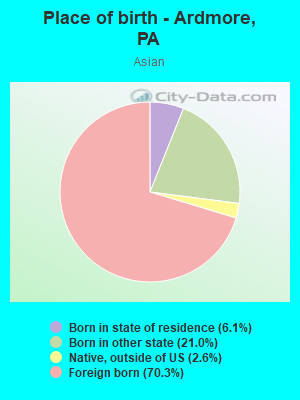
Place of birth - Born in state of residence (%) - Asian
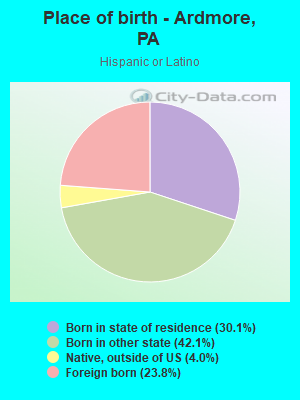
Place of birth - Born in state of residence (%) - Hispanic or Latino
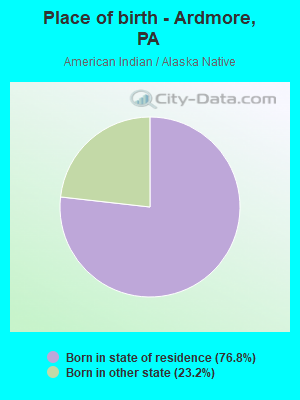
Place of birth - Born in state of residence (%) - American Indian and Alaska Native
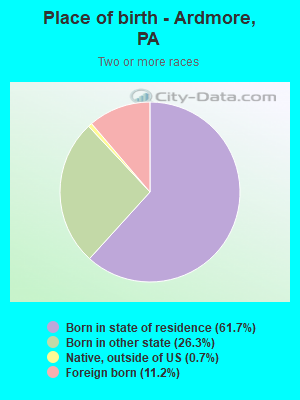
Place of birth - Born in state of residence (%) - Multirace
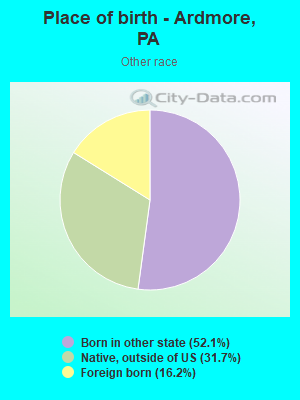
Place of birth - Born in state of residence (%) - Other Race
Place of birth - Born in other state (%)
Place of birth - Born in other state (%) - White
Place of birth - Born in other state (%) - Black or African American
Place of birth - Born in other state (%) - Asian
Place of birth - Born in other state (%) - Hispanic or Latino
Place of birth - Born in other state (%) - American Indian and Alaska Native
Place of birth - Born in other state (%) - Multirace
Place of birth - Born in other state (%) - Other Race
Place of birth - Native, outside of US (%)
Place of birth - Native, outside of US (%) - White
Place of birth - Native, outside of US (%) - Black or African American
Place of birth - Native, outside of US (%) - Asian
Place of birth - Native, outside of US (%) - Hispanic or Latino
Place of birth - Native, outside of US (%) - American Indian and Alaska Native
Place of birth - Native, outside of US (%) - Multirace
Place of birth - Native, outside of US (%) - Other Race
Place of birth - Foreign born (%)
Place of birth - Foreign born (%) - White
Place of birth - Foreign born (%) - Black or African American
Place of birth - Foreign born (%) - Asian
Place of birth - Foreign born (%) - Hispanic or Latino
Place of birth - Foreign born (%) - American Indian and Alaska Native
Place of birth - Foreign born (%) - Multirace
Place of birth - Foreign born (%) - Other Race
Residents speaking English at home (%)
Residents speaking English at home - Born in the United States (%)
Residents speaking English at home - Native, born elsewhere (%)
Residents speaking English at home - Foreign born (%)
Residents speaking Spanish at home (%)
Residents speaking Spanish at home - Born in the United States (%)
Residents speaking Spanish at home - Native, born elsewhere (%)
Residents speaking Spanish at home - Foreign born (%)
Residents speaking other language at home (%)
Residents speaking other language at home - Born in the United States (%)
Residents speaking other language at home - Native, born elsewhere (%)
Residents speaking other language at home - Foreign born (%)
Marital status - Never married (%)
Marital status - Now married (%)
Marital status - Separated (%)
Marital status - Widowed (%)
Marital status - Divorced (%)
Ancestries Reported - Arab (%)
Ancestries Reported - Czech (%)
Ancestries Reported - Danish (%)
Ancestries Reported - Dutch (%)
Ancestries Reported - English (%)
Ancestries Reported - French (%)
Ancestries Reported - French Canadian (%)
Ancestries Reported - German (%)
Ancestries Reported - Greek (%)
Ancestries Reported - Hungarian (%)
Ancestries Reported - Irish (%)
Ancestries Reported - Italian (%)
Ancestries Reported - Lithuanian (%)
Ancestries Reported - Norwegian (%)
Ancestries Reported - Polish (%)
Ancestries Reported - Portuguese (%)
Ancestries Reported - Russian (%)
Ancestries Reported - Scotch-Irish (%)
Ancestries Reported - Scottish (%)
Ancestries Reported - Slovak (%)
Ancestries Reported - Subsaharan African (%)
Ancestries Reported - Swedish (%)
Ancestries Reported - Swiss (%)
Ancestries Reported - Ukrainian (%)
Ancestries Reported - United States (%)
Ancestries Reported - Welsh (%)
Ancestries Reported - West Indian (%)
Ancestries Reported - Other (%)
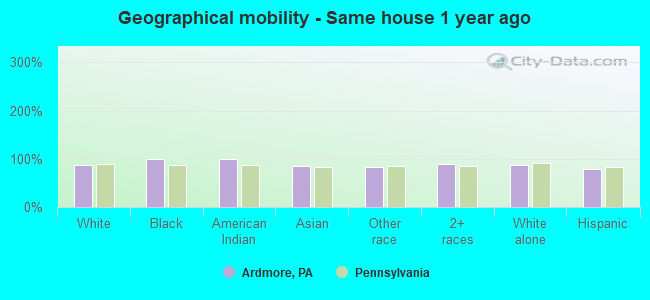
Geographical mobility - Same house 1 year ago (%)
Geographical mobility - Same house 1 year ago (%) - White
Geographical mobility - Same house 1 year ago (%) - Black or African American
Geographical mobility - Same house 1 year ago (%) - Asian
Geographical mobility - Same house 1 year ago (%) - Hispanic or Latino
Geographical mobility - Same house 1 year ago (%) - American Indian and Alaska Native
Geographical mobility - Same house 1 year ago (%) - Multirace
Geographical mobility - Same house 1 year ago (%) - Other Race
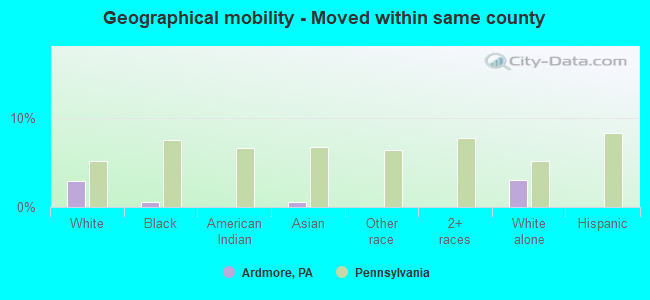
Geographical mobility - Moved within same county (%)
Geographical mobility - Moved within same county (%) - White
Geographical mobility - Moved within same county (%) - Black or African American
Geographical mobility - Moved within same county (%) - Asian
Geographical mobility - Moved within same county (%) - Hispanic or Latino
Geographical mobility - Moved within same county (%) - American Indian and Alaska Native
Geographical mobility - Moved within same county (%) - Multirace
Geographical mobility - Moved within same county (%) - Other Race
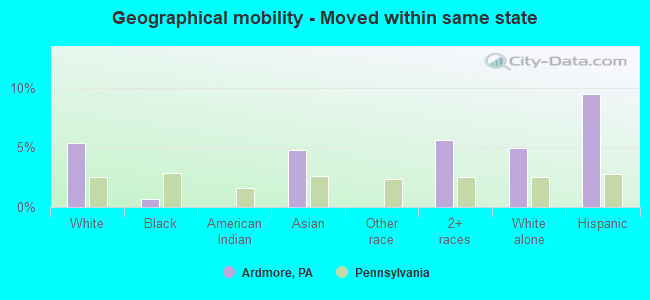
Geographical mobility - Moved from different county within same state (%)
Geographical mobility - Moved from different county within same state (%) - White
Geographical mobility - Moved from different county within same state (%) - Black or African American
Geographical mobility - Moved from different county within same state (%) - Asian
Geographical mobility - Moved from different county within same state (%) - Hispanic or Latino
Geographical mobility - Moved from different county within same state (%) - American Indian and Alaska Native
Geographical mobility - Moved from different county within same state (%) - Multirace
Geographical mobility - Moved from different county within same state (%) - Other Race
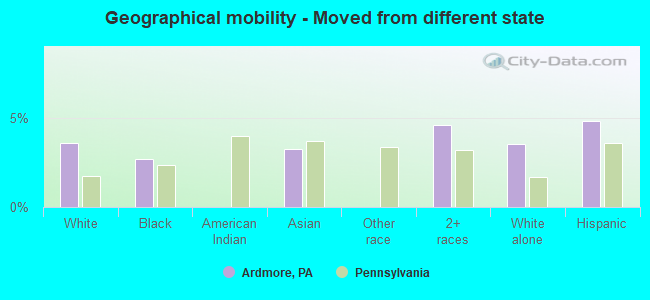
Geographical mobility - Moved from different state (%)
Geographical mobility - Moved from different state (%) - White
Geographical mobility - Moved from different state (%) - Black or African American
Geographical mobility - Moved from different state (%) - Asian
Geographical mobility - Moved from different state (%) - Hispanic or Latino
Geographical mobility - Moved from different state (%) - American Indian and Alaska Native
Geographical mobility - Moved from different state (%) - Multirace
Geographical mobility - Moved from different state (%) - Other Race
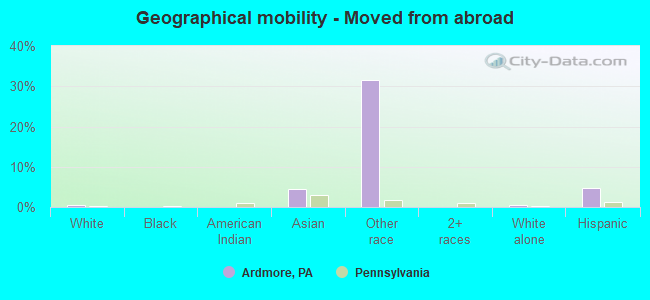
Geographical mobility - Moved from abroad (%)
Geographical mobility - Moved from abroad (%) - White
Geographical mobility - Moved from abroad (%) - Black or African American
Geographical mobility - Moved from abroad (%) - Asian
Geographical mobility - Moved from abroad (%) - Hispanic or Latino
Geographical mobility - Moved from abroad (%) - American Indian and Alaska Native
Geographical mobility - Moved from abroad (%) - Multirace
Geographical mobility - Moved from abroad (%) - Other Race
Place of birth for the foreign-born population - Ireland (%)
Place of birth for the foreign-born population - Denmark (%)
Place of birth for the foreign-born population - Norway (%)
Place of birth for the foreign-born population - Sweden (%)
Place of birth for the foreign-born population - United Kingdom (%)
Place of birth for the foreign-born population - England (%)
Place of birth for the foreign-born population - Scotland (%)
Place of birth for the foreign-born population - Other Northern Europe (%)
Place of birth for the foreign-born population - Austria (%)
Place of birth for the foreign-born population - Belgium (%)
Place of birth for the foreign-born population - France (%)
Place of birth for the foreign-born population - Germany (%)
Place of birth for the foreign-born population - Netherlands (%)
Place of birth for the foreign-born population - Switzerland (%)
Place of birth for the foreign-born population - Other Western Europe (%)
Place of birth for the foreign-born population - Greece (%)
Place of birth for the foreign-born population - Italy (%)
Place of birth for the foreign-born population - Portugal (%)
Place of birth for the foreign-born population - Spain (%)
Place of birth for the foreign-born population - Other Southern Europe (%)
Place of birth for the foreign-born population - Albania (%)
Place of birth for the foreign-born population - Belarus (%)
Place of birth for the foreign-born population - Bosnia and Herzegovina (%)
Place of birth for the foreign-born population - Bulgaria (%)
Place of birth for the foreign-born population - Croatia (%)
Place of birth for the foreign-born population - Czechoslovakia (%)
Place of birth for the foreign-born population - Hungary (%)
Place of birth for the foreign-born population - Latvia (%)
Place of birth for the foreign-born population - Lithuania (%)
Place of birth for the foreign-born population - North Macedonia (Macedonia) (%)
Place of birth for the foreign-born population - Moldova (%)
Place of birth for the foreign-born population - Poland (%)
Place of birth for the foreign-born population - Romania (%)
Place of birth for the foreign-born population - Russia (%)
Place of birth for the foreign-born population - Serbia (%)
Place of birth for the foreign-born population - Ukraine (%)
Place of birth for the foreign-born population - Other Eastern Europe (%)
Place of birth for the foreign-born population - China (%)
Place of birth for the foreign-born population - Hong Kong (%)
Place of birth for the foreign-born population - Taiwan (%)
Place of birth for the foreign-born population - Japan (%)
Place of birth for the foreign-born population - Korea (%)
Place of birth for the foreign-born population - Other Eastern Asia (%)
Place of birth for the foreign-born population - Afghanistan (%)
Place of birth for the foreign-born population - Bangladesh (%)
Place of birth for the foreign-born population - India (%)
Place of birth for the foreign-born population - Iran (%)
Place of birth for the foreign-born population - Kazakhstan (%)
Place of birth for the foreign-born population - Nepal (%)
Place of birth for the foreign-born population - Pakistan (%)
Place of birth for the foreign-born population - Sri Lanka (%)
Place of birth for the foreign-born population - Uzbekistan (%)
Place of birth for the foreign-born population - Other South Central Asia (%)
Place of birth for the foreign-born population - Burma (%)
Place of birth for the foreign-born population - Cambodia (%)
Place of birth for the foreign-born population - Indonesia (%)
Place of birth for the foreign-born population - Laos (%)
Place of birth for the foreign-born population - Malaysia (%)
Place of birth for the foreign-born population - Philippines (%)
Place of birth for the foreign-born population - Singapore (%)
Place of birth for the foreign-born population - Thailand (%)
Place of birth for the foreign-born population - Vietnam (%)
Place of birth for the foreign-born population - Other South Eastern Asia (%)
Place of birth for the foreign-born population - Armenia (%)
Place of birth for the foreign-born population - Iraq (%)
Place of birth for the foreign-born population - Israel (%)
Place of birth for the foreign-born population - Jordan (%)
Place of birth for the foreign-born population - Kuwait (%)
Place of birth for the foreign-born population - Lebanon (%)
Place of birth for the foreign-born population - Saudi Arabia (%)
Place of birth for the foreign-born population - Syria (%)
Place of birth for the foreign-born population - Turkey (%)
Place of birth for the foreign-born population - Yemen (%)
Place of birth for the foreign-born population - Other Western Asia (%)
Place of birth for the foreign-born population - Eritrea (%)
Place of birth for the foreign-born population - Ethiopia (%)
Place of birth for the foreign-born population - Kenya (%)
Place of birth for the foreign-born population - Somalia (%)
Place of birth for the foreign-born population - Uganda (%)
Place of birth for the foreign-born population - Zimbabwe (%)
Place of birth for the foreign-born population - Other Eastern Africa (%)
Place of birth for the foreign-born population - Cameroon (%)
Place of birth for the foreign-born population - Congo (%)
Place of birth for the foreign-born population - Democratic Republic of Congo (Zaire) (%)
Place of birth for the foreign-born population - Other Middle Africa (%)
Place of birth for the foreign-born population - Egypt (%)
Place of birth for the foreign-born population - Morocco (%)
Place of birth for the foreign-born population - Sudan (%)
Place of birth for the foreign-born population - Other Northern Africa (%)
Place of birth for the foreign-born population - South Africa (%)
Place of birth for the foreign-born population - Other Southern Africa (%)
Place of birth for the foreign-born population - Cabo Verde (%)
Place of birth for the foreign-born population - Ghana (%)
Place of birth for the foreign-born population - Liberia (%)
Place of birth for the foreign-born population - Nigeria (%)
Place of birth for the foreign-born population - Senegal (%)
Place of birth for the foreign-born population - Sierra Leone (%)
Place of birth for the foreign-born population - Other Western Africa (%)
Place of birth for the foreign-born population - Australia (%)
Place of birth for the foreign-born population - New Zealand (%)
Place of birth for the foreign-born population - Fiji (%)
Place of birth for the foreign-born population - Micronesia (%)
Place of birth for the foreign-born population - Bahamas (%)
Place of birth for the foreign-born population - Barbados (%)
Place of birth for the foreign-born population - Cuba (%)
Place of birth for the foreign-born population - Dominica (%)
Place of birth for the foreign-born population - Dominican Republic (%)
Place of birth for the foreign-born population - Grenada (%)
Place of birth for the foreign-born population - Haiti (%)
Place of birth for the foreign-born population - Jamaica (%)
Place of birth for the foreign-born population - St. Vincent and the Grenadines (%)
Place of birth for the foreign-born population - Trinidad and Tobago (%)
Place of birth for the foreign-born population - West Indies (%)
Place of birth for the foreign-born population - Other Caribbean (%)
Place of birth for the foreign-born population - Belize (%)
Place of birth for the foreign-born population - Costa Rica (%)
Place of birth for the foreign-born population - El Salvador (%)
Place of birth for the foreign-born population - Guatemala (%)
Place of birth for the foreign-born population - Honduras (%)
Place of birth for the foreign-born population - Mexico (%)
Place of birth for the foreign-born population - Nicaragua (%)
Place of birth for the foreign-born population - Panama (%)
Place of birth for the foreign-born population - Other Central America (%)
Place of birth for the foreign-born population - Argentina (%)
Place of birth for the foreign-born population - Bolivia (%)
Place of birth for the foreign-born population - Brazil (%)
Place of birth for the foreign-born population - Chile (%)
Place of birth for the foreign-born population - Colombia (%)
Place of birth for the foreign-born population - Ecuador (%)
Place of birth for the foreign-born population - Guyana (%)
Place of birth for the foreign-born population - Peru (%)
Place of birth for the foreign-born population - Uruguay (%)
Place of birth for the foreign-born population - Venezuela (%)
Place of birth for the foreign-born population - Other South America (%)
Place of birth for the foreign-born population - Canada (%)
Place of birth for the foreign-born population - Other Northern America (%)
Place of birth for the foreign-born population - Other (%)
Latest news about races in Ardmore, PA collected exclusively by city-data.com from local newspapers, TV, and radio stations
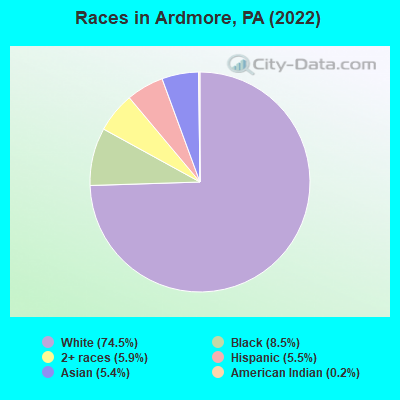
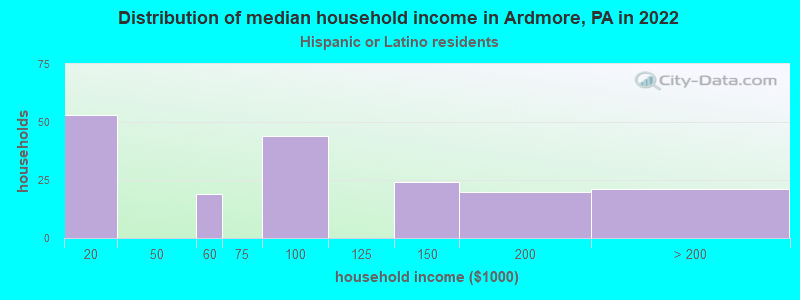
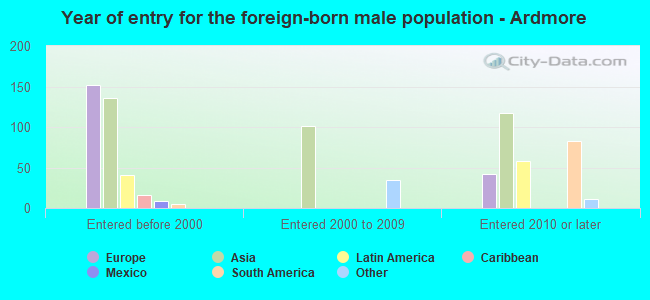
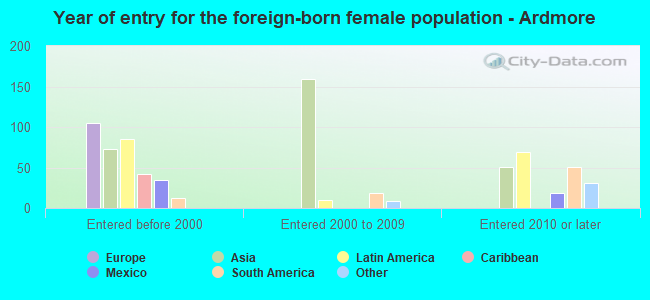
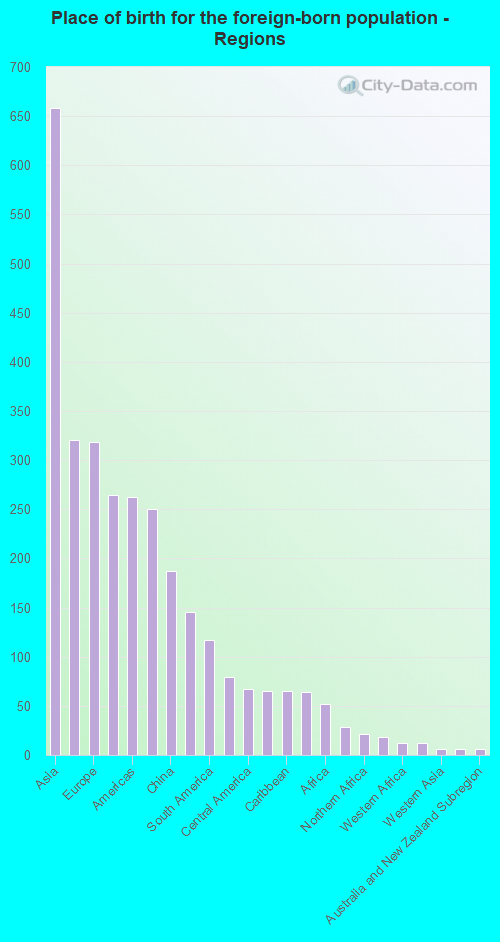
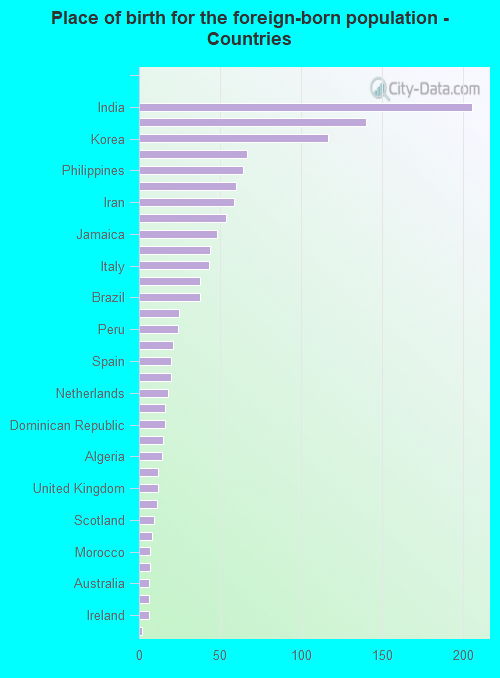
According to 2022 data, the most numerous races in Ardmore, PA are White alone (10,583 residents), Black alone (1,212 residents), and Hispanic (787 residents). 88.0% of Ardmore residents speak English at home. 9.1% of Ardmore, PA residents are foreign-born (4.5% born in Asia, 2.2% born in Europe, 1.7% born in Latin America), which is 23.4% greater than the foreign-born rate of 7.0% across the entire state of Pennsylvania.
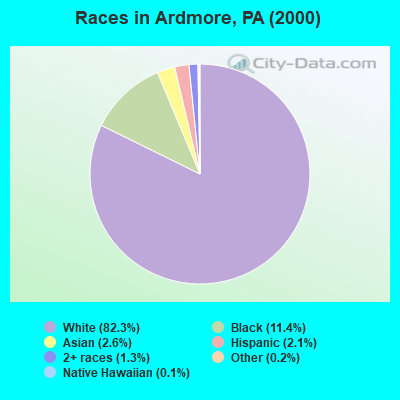
Race distribution in Ardmore
2000 2022
10,322,455 84.1% White alone 1,202,437 9.8% Black alone 394,088 3.2% Hispanic 218,296 1.8% Asian alone 113,097 0.9% Two or more races 13,086 0.1% Other race alone 14,904 0.1% American Indian alone 2,691 0.02% Native Hawaiian and Other
9,487,228 73.1% White alone 1,311,581 10.1% Black alone 1,115,997 8.6% Hispanic 493,942 3.8% Two or more races 487,124 3.8% Asian alone 63,582 0.5% Other race alone 10,130 0.08% American Indian alone 2,424 0.02% Native Hawaiian and Other
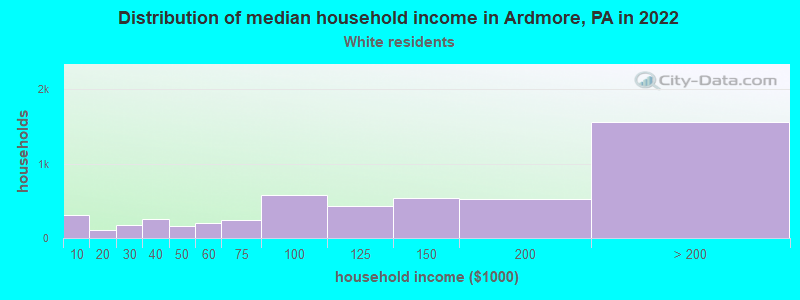
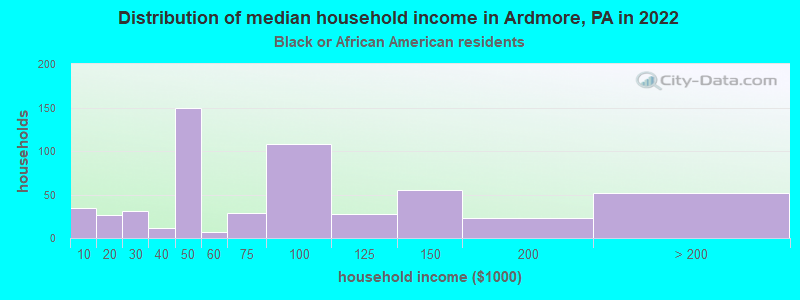
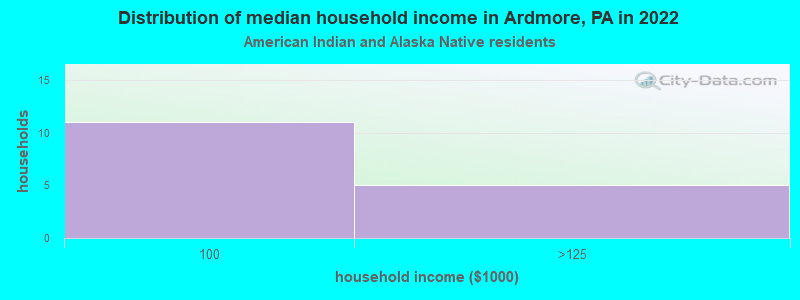
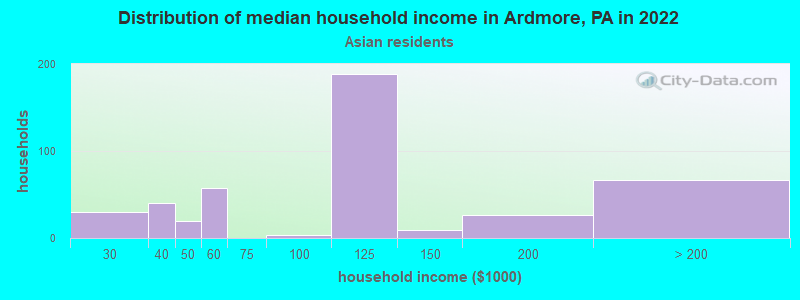
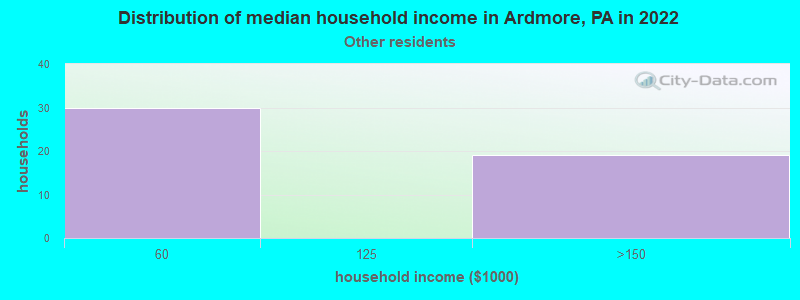
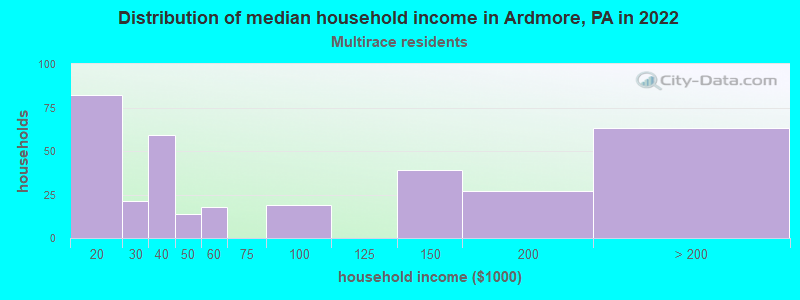
Income and house value in Ardmore Median household income in 2022 $129,457 White non-Hispanic householders$81,111 Black householders$114,823 Asian householders$84,144 Hispanic or Latino race householdersMedian 2022 house value $484,740 White Non-Hispanic householders$309,727 Black or African American householders $336,200 Asian householders$330,905 Two or more races householders$505,623 Hispanic or Latino householders
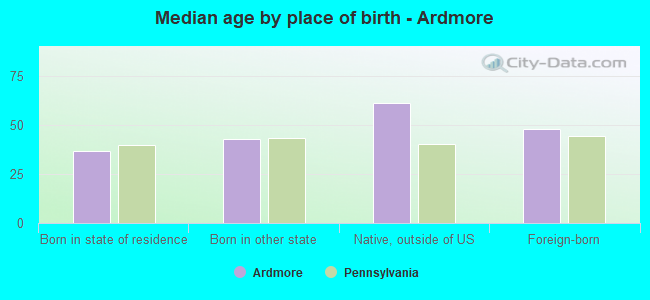
Median age by race in Ardmore
41.1 Median age for White residents38.8 43.8 45.1 Median age for Black or African American residents43.7 47.0 30.5 Median age for American Indian / Alaska Native residents79.6 28.0 34.3 Median age for Asian residents42.2 33.8 -680,432,644.4 Median age for Native Hawaiian / Pacific Islander residents-649,523,808.9 -747,474,746.7 36.6 Median age for Other race residents-554,476,806.3 48.2 19.2 Median age for Two or more races residents14.8 29.4 41.5 Median age for White alone residents39.9 43.8 31.0 Median age for Hispanic or Latino residents6.1 44.1
Owner/renter occupied households by race in Ardmore
House owners and renters - White residents 3,380 66.6% Owner occupied1,693 33.4% Renter occupiedHouse owners and renters - Black or African American residents 371 64.1% Owner occupied207 35.9% Renter occupiedHouse owners and renters - American Indian / Alaska Native residents 8 100.0% Owner occupiedHouse owners and renters - Asian residents 229 51.9% Owner occupied212 48.1% Renter occupiedHouse owners and renters - Other race residents 35 100.0% Renter occupiedHouse owners and renters - Two or more races residents 153 51.2% Owner occupied146 48.8% Renter occupiedHouse owners and renters - White alone residents 3,350 66.0% Owner occupied1,722 34.0% Renter occupiedHouse owners and renters - Hispanic or Latino residents 104 59.2% Owner occupied72 40.8% Renter occupied
Language usage in Ardmore
English speakers - Total 88.0% of residents of Ardmore speak English at home.
2.9% of residents speak Spanish at home 349 87.9% Speak English very well48 12.1% Speak English less than very well8.7% of residents speak other language at home 758 64.2% Speak English very well422 35.8% Speak English less than very well
English speakers - Born in the United States 90.8% of residents of Ardmore speak English at home.
4.2% of residents speak Spanish at home 151 100.0% Speak English very well5.2% of residents speak other language at home 187 100.0% Speak English very well
English speakers - Native, born elsewhere 66.7% of residents of Ardmore speak English at home.
10.8% of residents speak Spanish at home 34 100.0% Speak English less than very well15.2% of residents speak other language at home 21 43.8% Speak English very well27 56.2% Speak English less than very well
English speakers - Foreign-born 28.2% of residents of Ardmore speak English at home.
12.4% of residents speak Spanish at home 137 89.0% Speak English very well17 11.0% Speak English less than very well56.4% of residents speak other language at home 417 59.7% Speak English very well281 40.3% Speak English less than very well
White (Caucasian) - Speak only English Native:
96.1% (9,474)Foreign-born:
31.2% (141)
White (Caucasian) - Speak another language Native:
3.8% (375)Foreign-born:
68.5% (310)
Black or African American - Speak only English Native:
93.4% (1,090)Foreign-born:
76.2% (53)
Black or African American - Speak another language Native:
6.8% (79)Foreign-born:
27.1% (19)
Asian - Speak only English Native:
48.8% (109)Foreign-born:
25.0% (137)
Asian - Speak another language Native:
50.4% (113)Foreign-born:
76.3% (419)
Other race - Speak another language Native:
99.2% (110)Foreign-born:
100.0% (19)
Two or more races - Speak only English Native:
96.9% (909)Foreign-born:
30.3% (40)
Two or more races - Speak another language Native:
1.2% (11)Foreign-born:
69.4% (92)
White alone - Speak only English Native:
95.5% (9,312)Foreign-born:
38.4% (145)
White alone - Speak another language Native:
4.6% (454)Foreign-born:
61.5% (232)
Hispanic or Latino - Speak only English Native:
83.7% (392)Foreign-born:
5.2% (10)
Hispanic or Latino - Speak another language Native:
17.1% (80)Foreign-born:
95.7% (176)
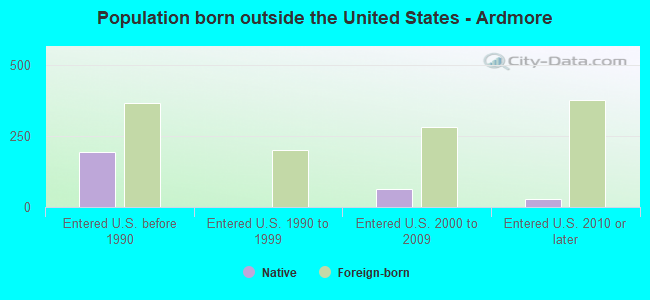
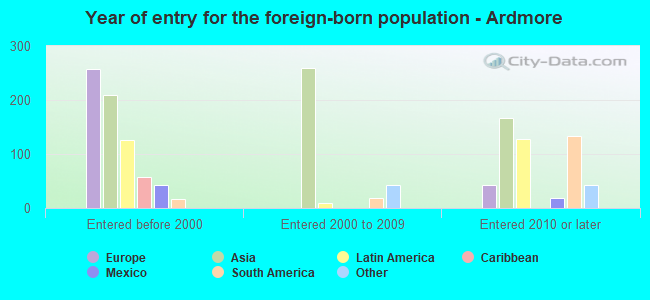
Foreign-born residents in Ardmore 1,299 residents are foreign born (4.5% Asia , 2.2% Europe , 1.7% Latin America ).
This city:
9.1%Pennsylvania:
7.3%
Marital status for residents in Ardmore Marital status - White (Caucasian) population 15 years and over
Males 22.7% Never married67.7% Now married2.4% Separated1.1% Widowed6.2% DivorcedFemales 20.7% Never married54.8% Now married1.2% Separated12.7% Widowed10.7% DivorcedWomen who gave birth in the past 12 months Now married:
100.0% (168)Unmarried:
0.0% (0)
Women who did not give birth in the past 12 months Now married:
60.4% (1,403)Unmarried:
39.6% (918)
Marital status - Black or African American population 15 years and over
Males 41.3% Never married53.2% Now married0.0% Separated0.0% Widowed5.4% DivorcedFemales 40.8% Never married23.9% Now married3.7% Separated17.3% Widowed14.3% DivorcedWomen who gave birth in the past 12 months Now married:
0.0% (0)Unmarried:
100.0% (28)
Women who did not give birth in the past 12 months Now married:
17.6% (47)Unmarried:
82.4% (220)
Marital status - American Indian / Alaska Native population 15 years and over
Males 0.0% Never married100.0% Now married0.0% Separated0.0% Widowed0.0% DivorcedFemales 75.0% Never married25.0% Now married0.0% Separated0.0% Widowed0.0% DivorcedWomen who did not give birth in the past 12 months Now married:
0.0% (0)Unmarried:
100.0% (11)
Marital status - Asian population 15 years and over
Males 23.2% Never married76.8% Now married0.0% Separated0.0% Widowed0.0% DivorcedFemales 22.4% Never married46.2% Now married0.0% Separated0.0% Widowed31.5% DivorcedWomen who gave birth in the past 12 months Now married:
100.0% (12)Unmarried:
0.0% (0)
Women who did not give birth in the past 12 months Now married:
40.0% (125)Unmarried:
60.0% (187)
Marital status - Other race population 15 years and over
Males 0.0% Never married100.0% Now married0.0% Separated0.0% Widowed0.0% DivorcedFemales 48.1% Never married51.9% Now married0.0% Separated0.0% Widowed0.0% DivorcedWomen who did not give birth in the past 12 months Now married:
51.9% (52)Unmarried:
48.1% (48)
Marital status - Two or more races population 15 years and over
Males 50.3% Never married49.7% Now married0.0% Separated0.0% Widowed0.0% DivorcedFemales 56.7% Never married41.5% Now married0.0% Separated1.8% Widowed0.0% DivorcedWomen who did not give birth in the past 12 months Now married:
35.1% (133)Unmarried:
64.9% (246)
Marital status - White alone, not Hispanic / Latino population 15 years and over
Males 22.0% Never married68.1% Now married2.5% Separated1.1% Widowed6.3% DivorcedFemales 21.5% Never married53.8% Now married1.2% Separated13.2% Widowed10.3% DivorcedWomen who gave birth in the past 12 months Now married:
100.0% (87)Unmarried:
0.0% (0)
Women who did not give birth in the past 12 months Now married:
59.8% (1,388)Unmarried:
40.2% (933)
Marital status - Hispanic or Latino population 15 years and over
Males 46.0% Never married54.0% Now married0.0% Separated0.0% Widowed0.0% DivorcedFemales 25.4% Never married64.0% Now married0.0% Separated1.7% Widowed8.9% DivorcedWomen who gave birth in the past 12 months Now married:
100.0% (91)Unmarried:
0.0% (0)
Women who did not give birth in the past 12 months Now married:
57.8% (91)Unmarried:
42.2% (66)
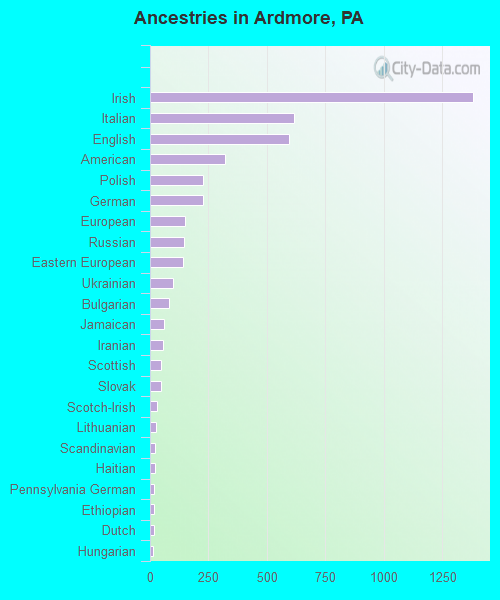
Ancestries in Ardmore
1,381 21.9% Irish615 9.7% Italian593 9.4% English320 5.1% American227 3.6% Polish225 3.6% German148 2.3% European146 2.3% Russian143 2.3% Eastern European100 1.6% Ukrainian82 1.3% Bulgarian58 0.9% Jamaican54 0.9% Iranian46 0.7% Scottish45 0.7% Slovak31 0.5% Scotch-Irish24 0.4% Lithuanian20 0.3% Scandinavian20 0.3% Haitian17 0.3% Pennsylvania German16 0.3% Ethiopian15 0.2% Dutch14 0.2% Hungarian12 0.2% Danish11 0.2% Czechoslovakian8 0.1% Trinidadian and Tobagonian7 0.1% French6 0.10% Moroccan5 0.08% African5 0.08% Turkish1 0.02% Croatian
Children Nativity (place of birth) in Ardmore
Children under 6 years - Living with two parents Both parents native 612 99.9% Native0 0.1% Foreign-bornBoth parents foreign-born 8 54.2% Native7 45.8% Foreign-bornOne native, one foreign-born parent 115 100.0% NativeChildren under 6 years - Living with one parent Native parent 146 100.0% NativeChildren 6 to 17 years - Living with two parents Both parents native 1,425 100.0% NativeBoth parents foreign-born 52 71.8% Native21 28.2% Foreign-bornOne native, one foreign-born parent 286 100.0% NativeChildren 6 to 17 years - Living with one parent Native parent 245 100.0% Native
Grandparents responsible for own grandchildren in Ardmore
Grandparents (30 to 59 years) White / Caucasian 8 100.0% Not responsible for grandchildrenHispanic or Latino 12 100.0% Not responsible for grandchildrenGrandparents (60 years and over) White / Caucasian 26 23.2% Responsible for grandchildren85 76.8% Not responsible for grandchildrenHispanic or Latino 71 100.0% Not responsible for grandchildren