Races in Arlington Heights, Illinois (IL) Detailed Stats
Data:
Races - White alone (%)
Races - White alone (% change since 2000)
Races - Black alone (%)
Races - Black alone (% change since 2000)
Races - American Indian alone (%)
Races - American Indian alone (% change since 2000)
Races - Asian alone (%)
Races - Asian alone (% change since 2000)
Races - Hispanic (%)
Races - Hispanic (% change since 2000)
Races - Native Hawaiian and Other Pacific Islander alone (%)
Races - Native Hawaiian and Other Pacific Islander alone (% change since 2000)
Races - Two or more races(%)
Races - Two or more races(% change since 2000)
Races - Other race alone (%)
Races - Other race alone (% change since 2000)
Racial diversity
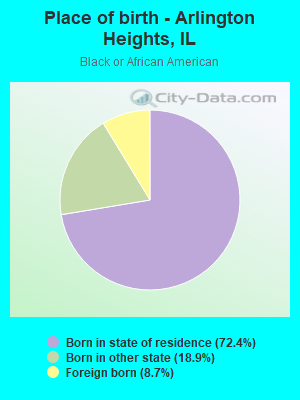
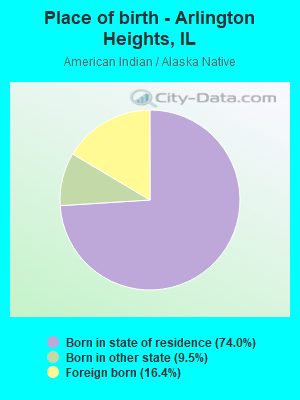
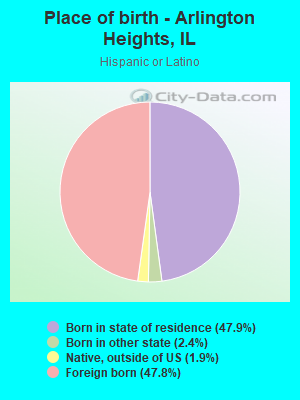
Place of birth - Born in state of residence (%)
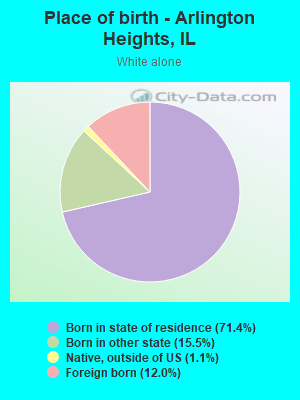
Place of birth - Born in state of residence (%) - White
Place of birth - Born in state of residence (%) - Black or African American
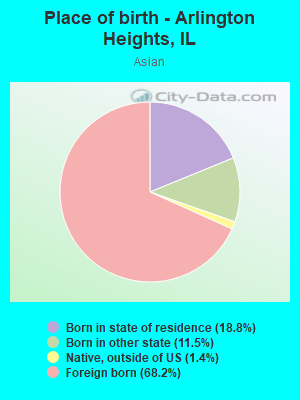
Place of birth - Born in state of residence (%) - Asian
Place of birth - Born in state of residence (%) - Hispanic or Latino
Place of birth - Born in state of residence (%) - American Indian and Alaska Native
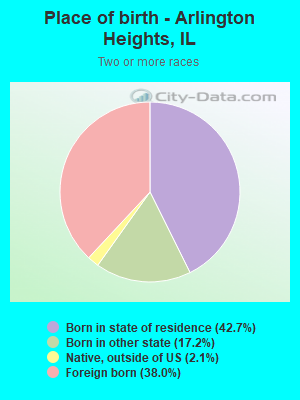
Place of birth - Born in state of residence (%) - Multirace
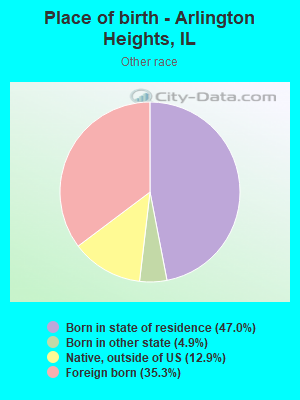
Place of birth - Born in state of residence (%) - Other Race
Place of birth - Born in other state (%)
Place of birth - Born in other state (%) - White
Place of birth - Born in other state (%) - Black or African American
Place of birth - Born in other state (%) - Asian
Place of birth - Born in other state (%) - Hispanic or Latino
Place of birth - Born in other state (%) - American Indian and Alaska Native
Place of birth - Born in other state (%) - Multirace
Place of birth - Born in other state (%) - Other Race
Place of birth - Native, outside of US (%)
Place of birth - Native, outside of US (%) - White
Place of birth - Native, outside of US (%) - Black or African American
Place of birth - Native, outside of US (%) - Asian
Place of birth - Native, outside of US (%) - Hispanic or Latino
Place of birth - Native, outside of US (%) - American Indian and Alaska Native
Place of birth - Native, outside of US (%) - Multirace
Place of birth - Native, outside of US (%) - Other Race
Place of birth - Foreign born (%)
Place of birth - Foreign born (%) - White
Place of birth - Foreign born (%) - Black or African American
Place of birth - Foreign born (%) - Asian
Place of birth - Foreign born (%) - Hispanic or Latino
Place of birth - Foreign born (%) - American Indian and Alaska Native
Place of birth - Foreign born (%) - Multirace
Place of birth - Foreign born (%) - Other Race
Residents speaking English at home (%)
Residents speaking English at home - Born in the United States (%)
Residents speaking English at home - Native, born elsewhere (%)
Residents speaking English at home - Foreign born (%)
Residents speaking Spanish at home (%)
Residents speaking Spanish at home - Born in the United States (%)
Residents speaking Spanish at home - Native, born elsewhere (%)
Residents speaking Spanish at home - Foreign born (%)
Residents speaking other language at home (%)
Residents speaking other language at home - Born in the United States (%)
Residents speaking other language at home - Native, born elsewhere (%)
Residents speaking other language at home - Foreign born (%)
Marital status - Never married (%)
Marital status - Now married (%)
Marital status - Separated (%)
Marital status - Widowed (%)
Marital status - Divorced (%)
Ancestries Reported - Arab (%)
Ancestries Reported - Czech (%)
Ancestries Reported - Danish (%)
Ancestries Reported - Dutch (%)
Ancestries Reported - English (%)
Ancestries Reported - French (%)
Ancestries Reported - French Canadian (%)
Ancestries Reported - German (%)
Ancestries Reported - Greek (%)
Ancestries Reported - Hungarian (%)
Ancestries Reported - Irish (%)
Ancestries Reported - Italian (%)
Ancestries Reported - Lithuanian (%)
Ancestries Reported - Norwegian (%)
Ancestries Reported - Polish (%)
Ancestries Reported - Portuguese (%)
Ancestries Reported - Russian (%)
Ancestries Reported - Scotch-Irish (%)
Ancestries Reported - Scottish (%)
Ancestries Reported - Slovak (%)
Ancestries Reported - Subsaharan African (%)
Ancestries Reported - Swedish (%)
Ancestries Reported - Swiss (%)
Ancestries Reported - Ukrainian (%)
Ancestries Reported - United States (%)
Ancestries Reported - Welsh (%)
Ancestries Reported - West Indian (%)
Ancestries Reported - Other (%)
Geographical mobility - Same house 1 year ago (%)
Geographical mobility - Same house 1 year ago (%) - White
Geographical mobility - Same house 1 year ago (%) - Black or African American
Geographical mobility - Same house 1 year ago (%) - Asian
Geographical mobility - Same house 1 year ago (%) - Hispanic or Latino
Geographical mobility - Same house 1 year ago (%) - American Indian and Alaska Native
Geographical mobility - Same house 1 year ago (%) - Multirace
Geographical mobility - Same house 1 year ago (%) - Other Race
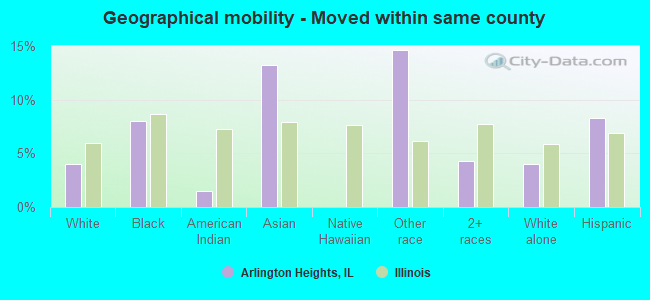
Geographical mobility - Moved within same county (%)
Geographical mobility - Moved within same county (%) - White
Geographical mobility - Moved within same county (%) - Black or African American
Geographical mobility - Moved within same county (%) - Asian
Geographical mobility - Moved within same county (%) - Hispanic or Latino
Geographical mobility - Moved within same county (%) - American Indian and Alaska Native
Geographical mobility - Moved within same county (%) - Multirace
Geographical mobility - Moved within same county (%) - Other Race
Geographical mobility - Moved from different county within same state (%)
Geographical mobility - Moved from different county within same state (%) - White
Geographical mobility - Moved from different county within same state (%) - Black or African American
Geographical mobility - Moved from different county within same state (%) - Asian
Geographical mobility - Moved from different county within same state (%) - Hispanic or Latino
Geographical mobility - Moved from different county within same state (%) - American Indian and Alaska Native
Geographical mobility - Moved from different county within same state (%) - Multirace
Geographical mobility - Moved from different county within same state (%) - Other Race
Geographical mobility - Moved from different state (%)
Geographical mobility - Moved from different state (%) - White
Geographical mobility - Moved from different state (%) - Black or African American
Geographical mobility - Moved from different state (%) - Asian
Geographical mobility - Moved from different state (%) - Hispanic or Latino
Geographical mobility - Moved from different state (%) - American Indian and Alaska Native
Geographical mobility - Moved from different state (%) - Multirace
Geographical mobility - Moved from different state (%) - Other Race
Geographical mobility - Moved from abroad (%)
Geographical mobility - Moved from abroad (%) - White
Geographical mobility - Moved from abroad (%) - Black or African American
Geographical mobility - Moved from abroad (%) - Asian
Geographical mobility - Moved from abroad (%) - Hispanic or Latino
Geographical mobility - Moved from abroad (%) - American Indian and Alaska Native
Geographical mobility - Moved from abroad (%) - Multirace
Geographical mobility - Moved from abroad (%) - Other Race
Place of birth for the foreign-born population - Ireland (%)
Place of birth for the foreign-born population - Denmark (%)
Place of birth for the foreign-born population - Norway (%)
Place of birth for the foreign-born population - Sweden (%)
Place of birth for the foreign-born population - United Kingdom (%)
Place of birth for the foreign-born population - England (%)
Place of birth for the foreign-born population - Scotland (%)
Place of birth for the foreign-born population - Other Northern Europe (%)
Place of birth for the foreign-born population - Austria (%)
Place of birth for the foreign-born population - Belgium (%)
Place of birth for the foreign-born population - France (%)
Place of birth for the foreign-born population - Germany (%)
Place of birth for the foreign-born population - Netherlands (%)
Place of birth for the foreign-born population - Switzerland (%)
Place of birth for the foreign-born population - Other Western Europe (%)
Place of birth for the foreign-born population - Greece (%)
Place of birth for the foreign-born population - Italy (%)
Place of birth for the foreign-born population - Portugal (%)
Place of birth for the foreign-born population - Spain (%)
Place of birth for the foreign-born population - Other Southern Europe (%)
Place of birth for the foreign-born population - Albania (%)
Place of birth for the foreign-born population - Belarus (%)
Place of birth for the foreign-born population - Bosnia and Herzegovina (%)
Place of birth for the foreign-born population - Bulgaria (%)
Place of birth for the foreign-born population - Croatia (%)
Place of birth for the foreign-born population - Czechoslovakia (%)
Place of birth for the foreign-born population - Hungary (%)
Place of birth for the foreign-born population - Latvia (%)
Place of birth for the foreign-born population - Lithuania (%)
Place of birth for the foreign-born population - North Macedonia (Macedonia) (%)
Place of birth for the foreign-born population - Moldova (%)
Place of birth for the foreign-born population - Poland (%)
Place of birth for the foreign-born population - Romania (%)
Place of birth for the foreign-born population - Russia (%)
Place of birth for the foreign-born population - Serbia (%)
Place of birth for the foreign-born population - Ukraine (%)
Place of birth for the foreign-born population - Other Eastern Europe (%)
Place of birth for the foreign-born population - China (%)
Place of birth for the foreign-born population - Hong Kong (%)
Place of birth for the foreign-born population - Taiwan (%)
Place of birth for the foreign-born population - Japan (%)
Place of birth for the foreign-born population - Korea (%)
Place of birth for the foreign-born population - Other Eastern Asia (%)
Place of birth for the foreign-born population - Afghanistan (%)
Place of birth for the foreign-born population - Bangladesh (%)
Place of birth for the foreign-born population - India (%)
Place of birth for the foreign-born population - Iran (%)
Place of birth for the foreign-born population - Kazakhstan (%)
Place of birth for the foreign-born population - Nepal (%)
Place of birth for the foreign-born population - Pakistan (%)
Place of birth for the foreign-born population - Sri Lanka (%)
Place of birth for the foreign-born population - Uzbekistan (%)
Place of birth for the foreign-born population - Other South Central Asia (%)
Place of birth for the foreign-born population - Burma (%)
Place of birth for the foreign-born population - Cambodia (%)
Place of birth for the foreign-born population - Indonesia (%)
Place of birth for the foreign-born population - Laos (%)
Place of birth for the foreign-born population - Malaysia (%)
Place of birth for the foreign-born population - Philippines (%)
Place of birth for the foreign-born population - Singapore (%)
Place of birth for the foreign-born population - Thailand (%)
Place of birth for the foreign-born population - Vietnam (%)
Place of birth for the foreign-born population - Other South Eastern Asia (%)
Place of birth for the foreign-born population - Armenia (%)
Place of birth for the foreign-born population - Iraq (%)
Place of birth for the foreign-born population - Israel (%)
Place of birth for the foreign-born population - Jordan (%)
Place of birth for the foreign-born population - Kuwait (%)
Place of birth for the foreign-born population - Lebanon (%)
Place of birth for the foreign-born population - Saudi Arabia (%)
Place of birth for the foreign-born population - Syria (%)
Place of birth for the foreign-born population - Turkey (%)
Place of birth for the foreign-born population - Yemen (%)
Place of birth for the foreign-born population - Other Western Asia (%)
Place of birth for the foreign-born population - Eritrea (%)
Place of birth for the foreign-born population - Ethiopia (%)
Place of birth for the foreign-born population - Kenya (%)
Place of birth for the foreign-born population - Somalia (%)
Place of birth for the foreign-born population - Uganda (%)
Place of birth for the foreign-born population - Zimbabwe (%)
Place of birth for the foreign-born population - Other Eastern Africa (%)
Place of birth for the foreign-born population - Cameroon (%)
Place of birth for the foreign-born population - Congo (%)
Place of birth for the foreign-born population - Democratic Republic of Congo (Zaire) (%)
Place of birth for the foreign-born population - Other Middle Africa (%)
Place of birth for the foreign-born population - Egypt (%)
Place of birth for the foreign-born population - Morocco (%)
Place of birth for the foreign-born population - Sudan (%)
Place of birth for the foreign-born population - Other Northern Africa (%)
Place of birth for the foreign-born population - South Africa (%)
Place of birth for the foreign-born population - Other Southern Africa (%)
Place of birth for the foreign-born population - Cabo Verde (%)
Place of birth for the foreign-born population - Ghana (%)
Place of birth for the foreign-born population - Liberia (%)
Place of birth for the foreign-born population - Nigeria (%)
Place of birth for the foreign-born population - Senegal (%)
Place of birth for the foreign-born population - Sierra Leone (%)
Place of birth for the foreign-born population - Other Western Africa (%)
Place of birth for the foreign-born population - Australia (%)
Place of birth for the foreign-born population - New Zealand (%)
Place of birth for the foreign-born population - Fiji (%)
Place of birth for the foreign-born population - Micronesia (%)
Place of birth for the foreign-born population - Bahamas (%)
Place of birth for the foreign-born population - Barbados (%)
Place of birth for the foreign-born population - Cuba (%)
Place of birth for the foreign-born population - Dominica (%)
Place of birth for the foreign-born population - Dominican Republic (%)
Place of birth for the foreign-born population - Grenada (%)
Place of birth for the foreign-born population - Haiti (%)
Place of birth for the foreign-born population - Jamaica (%)
Place of birth for the foreign-born population - St. Vincent and the Grenadines (%)
Place of birth for the foreign-born population - Trinidad and Tobago (%)
Place of birth for the foreign-born population - West Indies (%)
Place of birth for the foreign-born population - Other Caribbean (%)
Place of birth for the foreign-born population - Belize (%)
Place of birth for the foreign-born population - Costa Rica (%)
Place of birth for the foreign-born population - El Salvador (%)
Place of birth for the foreign-born population - Guatemala (%)
Place of birth for the foreign-born population - Honduras (%)
Place of birth for the foreign-born population - Mexico (%)
Place of birth for the foreign-born population - Nicaragua (%)
Place of birth for the foreign-born population - Panama (%)
Place of birth for the foreign-born population - Other Central America (%)
Place of birth for the foreign-born population - Argentina (%)
Place of birth for the foreign-born population - Bolivia (%)
Place of birth for the foreign-born population - Brazil (%)
Place of birth for the foreign-born population - Chile (%)
Place of birth for the foreign-born population - Colombia (%)
Place of birth for the foreign-born population - Ecuador (%)
Place of birth for the foreign-born population - Guyana (%)
Place of birth for the foreign-born population - Peru (%)
Place of birth for the foreign-born population - Uruguay (%)
Place of birth for the foreign-born population - Venezuela (%)
Place of birth for the foreign-born population - Other South America (%)
Place of birth for the foreign-born population - Canada (%)
Place of birth for the foreign-born population - Other Northern America (%)
Place of birth for the foreign-born population - Other (%)
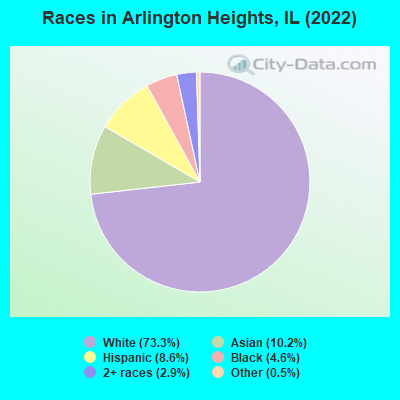
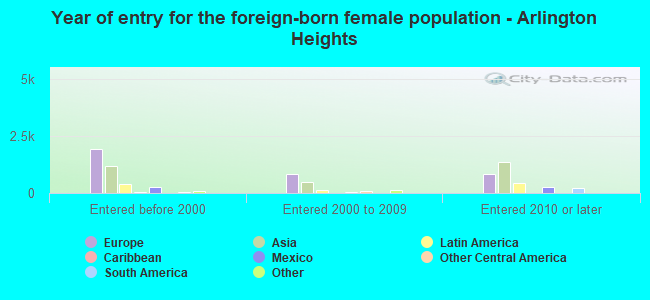
According to 2022 data, the most numerous races in Arlington Heights, IL are White alone (54,416 residents), Hispanic (6,380 residents), and Black alone (3,385 residents). 71.3% of Arlington Heights residents speak English at home. 21.0% of Arlington Heights, IL residents are foreign-born (9.4% born in Europe, 7.8% born in Asia, 2.5% born in Latin America), which is 33.2% greater than the foreign-born rate of 14.0% across the entire state of Illinois.
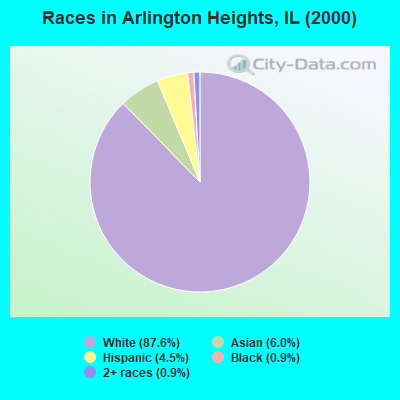
Race distribution in Arlington Heights
2000 2022
8,424,140 67.8% White alone 1,856,152 14.9% Black alone 1,530,262 12.3% Hispanic 419,916 3.4% Asian alone 153,996 1.2% Two or more races 13,479 0.1% Other race alone 18,232 0.1% American Indian alone 3,116 0.03% Native Hawaiian and Other
7,356,301 58.5% White alone 2,299,726 18.3% Hispanic 1,660,423 13.2% Black alone 747,296 5.9% Asian alone 458,599 3.6% Two or more races 45,386 0.4% Other race alone 10,405 0.08% American Indian alone 3,896 0.03% Native Hawaiian and Other
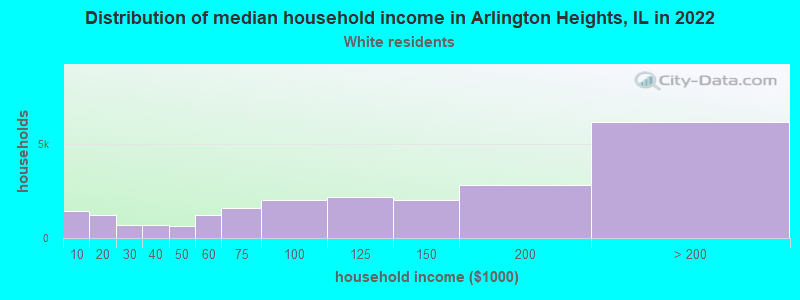
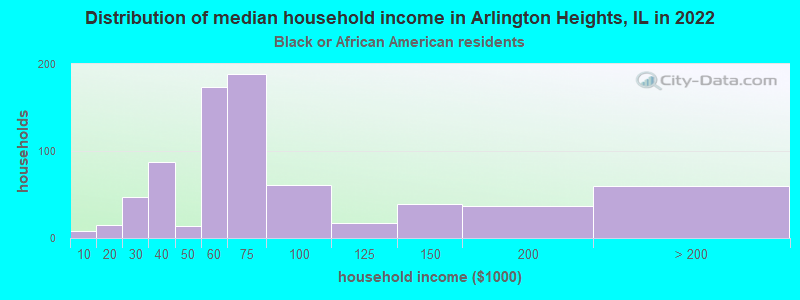
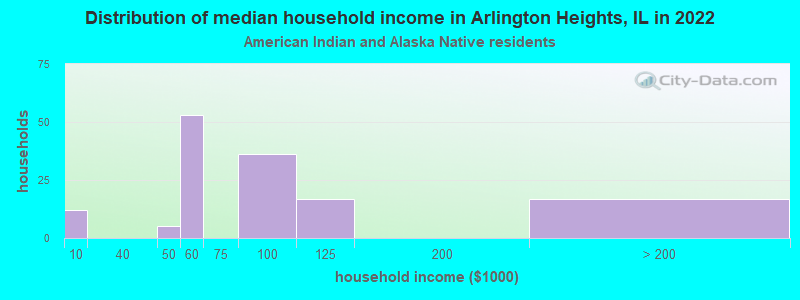
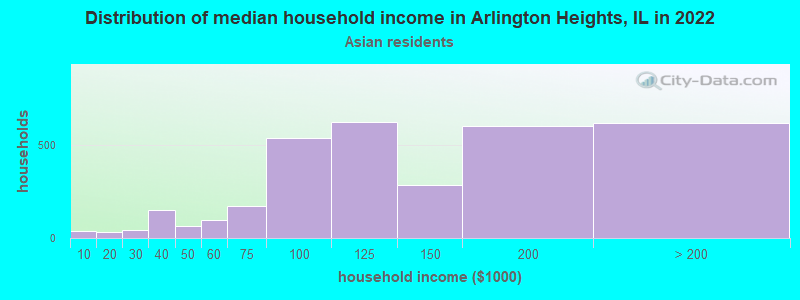
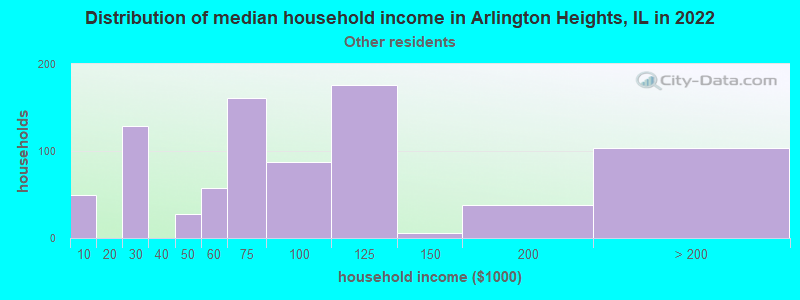
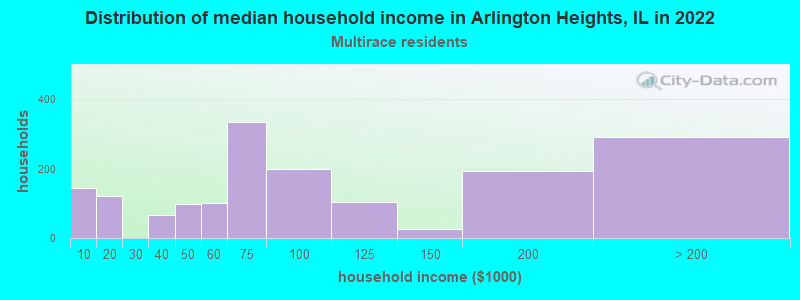
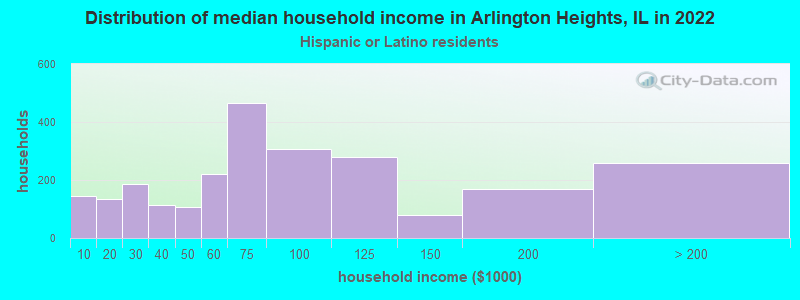
Income and house value in Arlington Heights Median household income in 2022 $122,332 White non-Hispanic householders$52,033 Black householders$141,773 Asian householders$77,733 Some other race householders$69,763 Two or more races householders$70,750 Hispanic or Latino race householdersMedian 2022 house value $460,534 White Non-Hispanic householders$294,910 Black or African American householders$525,942 American Indian or Alaska Native householders $470,096 Asian householders$360,318 Some other race householders$375,427 Two or more races householders$435,097 Hispanic or Latino householders
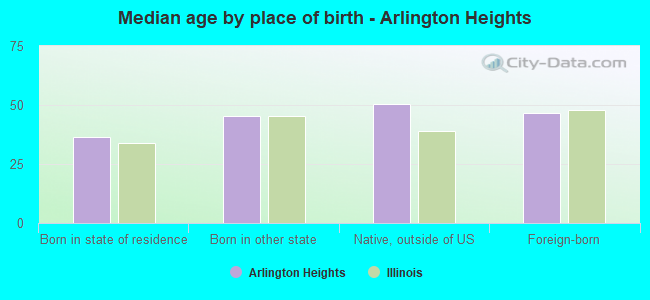
Median age by race in Arlington Heights
44.6 Median age for White residents44.7 44.5 33.9 Median age for Black or African American residents34.8 33.5 30.3 Median age for American Indian / Alaska Native residents-666,666,666.0 30.5 41.2 Median age for Asian residents43.4 40.6 -666,666,666.0 Median age for Native Hawaiian / Pacific Islander residents-666,666,666.0 -666,666,666.0 30.8 Median age for Other race residents14.1 31.3 39.5 Median age for Two or more races residents25.4 43.0 44.6 Median age for White alone residents44.9 44.4 35.3 Median age for Hispanic or Latino residents28.3 38.6
Owner/renter occupied households by race in Arlington Heights
House owners and renters - White residents 18,140 80.1% Owner occupied4,508 19.9% Renter occupiedHouse owners and renters - Black or African American residents 46 5.9% Owner occupied741 94.1% Renter occupiedHouse owners and renters - American Indian / Alaska Native residents 34 21.4% Owner occupied124 78.6% Renter occupiedHouse owners and renters - Asian residents 2,020 68.7% Owner occupied919 31.3% Renter occupiedHouse owners and renters - Other race residents 334 40.7% Owner occupied486 59.3% Renter occupiedHouse owners and renters - Two or more races residents 1,045 52.2% Owner occupied957 47.8% Renter occupiedHouse owners and renters - White alone residents 18,023 80.0% Owner occupied4,508 20.0% Renter occupiedHouse owners and renters - Hispanic or Latino residents 1,015 46.9% Owner occupied1,149 53.1% Renter occupied
Language usage in Arlington Heights
English speakers - Total 71.3% of residents of Arlington Heights speak English at home.
6.0% of residents speak Spanish at home 2,178 52.5% Speak English very well1,974 47.5% Speak English less than very well22.7% of residents speak other language at home 11,234 71.6% Speak English very well4,448 28.4% Speak English less than very well
English speakers - Born in the United States 90.6% of residents of Arlington Heights speak English at home.
0.4% of residents speak Spanish at home 46 100.0% Speak English very well8.9% of residents speak other language at home 945 100.0% Speak English very well
English speakers - Native, born elsewhere 58.0% of residents of Arlington Heights speak English at home.
14.7% of residents speak Spanish at home 51 41.8% Speak English very well71 58.2% Speak English less than very well27.3% of residents speak other language at home 148 65.2% Speak English very well79 34.8% Speak English less than very well
English speakers - Foreign-born 12.8% of residents of Arlington Heights speak English at home.
18.0% of residents speak Spanish at home 943 33.1% Speak English very well1,903 66.9% Speak English less than very well69.2% of residents speak other language at home 6,992 64.1% Speak English very well3,921 35.9% Speak English less than very well
White (Caucasian) - Speak only English Native:
93.0% (41,493)Foreign-born:
13.7% (894)
White (Caucasian) - Speak another language Native:
7.0% (3,136)Foreign-born:
86.3% (5,642)
Black or African American - Speak only English Native:
92.2% (1,584)Foreign-born:
15.6% (28)
Black or African American - Speak another language Native:
7.9% (136)Foreign-born:
79.2% (140)
American Indian / Alaska Native - Speak only English Native:
31.4% (69)Foreign-born:
6.5% (3)
American Indian / Alaska Native - Speak another language Native:
68.8% (152)Foreign-born:
91.7% (46)
Asian - Speak only English Native:
35.6% (686)Foreign-born:
20.1% (1,016)
Asian - Speak another language Native:
64.4% (1,240)Foreign-born:
79.9% (4,045)
Other race - Speak only English Native:
37.5% (465)Foreign-born:
3.6% (28)
Other race - Speak another language Native:
63.5% (787)Foreign-born:
96.5% (750)
Two or more races - Speak only English Native:
69.8% (2,284)Foreign-born:
3.1% (68)
Two or more races - Speak another language Native:
30.2% (989)Foreign-born:
96.9% (2,159)
White alone - Speak only English Native:
92.9% (41,102)Foreign-born:
13.7% (894)
White alone - Speak another language Native:
7.1% (3,136)Foreign-born:
86.3% (5,642)
Hispanic or Latino - Speak another language Native:
40.2% (1,105)Foreign-born:
100.0% (3,050)
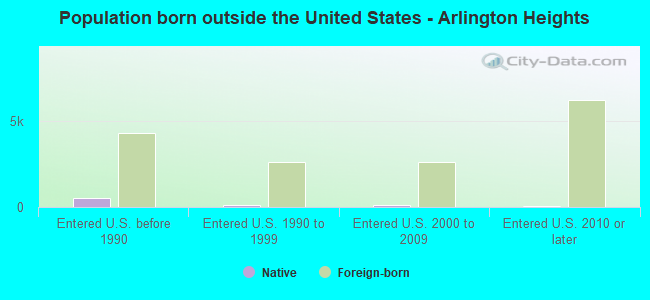
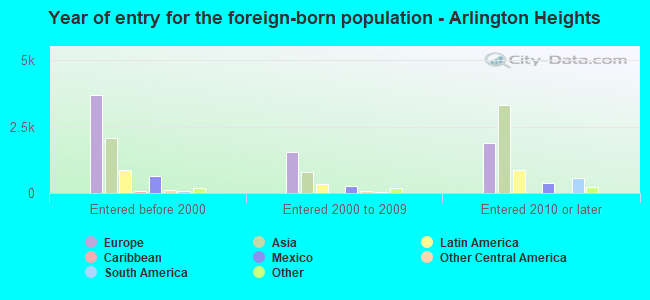
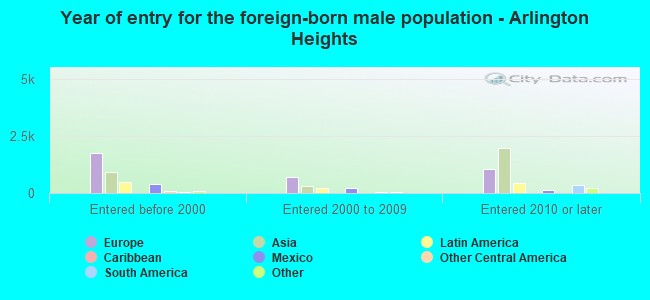
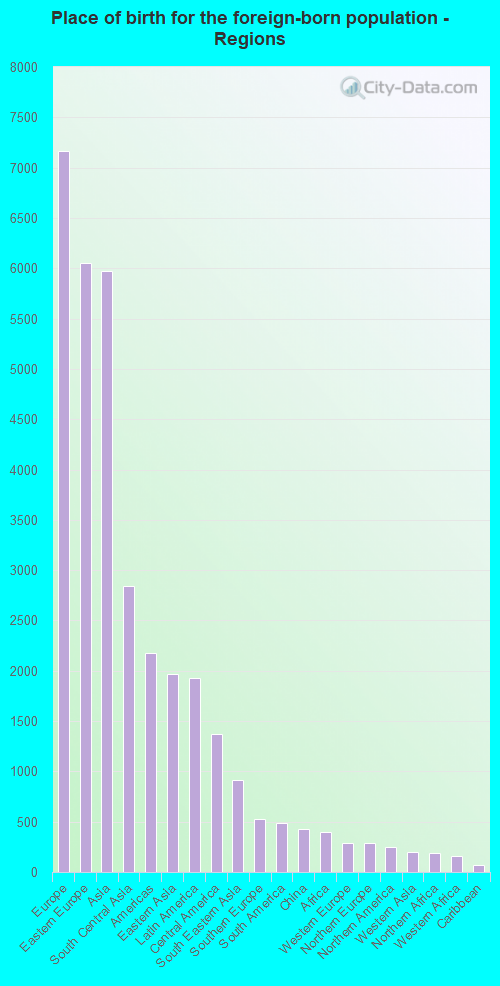
Foreign-born residents in Arlington Heights 15,741 residents are foreign born (9.4% Europe , 7.8% Asia , 2.5% Latin America ).
This city:
21.0%Illinois:
14.1%
Marital status for residents in Arlington Heights Marital status - White (Caucasian) population 15 years and over
Males 27.2% Never married61.9% Now married0.4% Separated2.6% Widowed8.0% DivorcedFemales 23.6% Never married58.1% Now married0.6% Separated8.8% Widowed8.9% DivorcedWomen who gave birth in the past 12 months Now married:
100.0% (461)Unmarried:
0.0% (0)
Women who did not give birth in the past 12 months Now married:
57.8% (6,200)Unmarried:
42.2% (4,526)
Marital status - Black or African American population 15 years and over
Males 61.4% Never married21.8% Now married11.2% Separated0.1% Widowed5.6% DivorcedFemales 46.4% Never married27.2% Now married0.1% Separated2.5% Widowed23.9% DivorcedWomen who gave birth in the past 12 months Now married:
80.0% (49)Unmarried:
20.0% (12)
Women who did not give birth in the past 12 months Now married:
19.5% (86)Unmarried:
80.5% (355)
Marital status - American Indian / Alaska Native population 15 years and over
Males 10.3% Never married89.7% Now married0.0% Separated0.0% Widowed0.0% DivorcedFemales 0.0% Never married100.0% Now married0.0% Separated0.0% Widowed0.0% DivorcedWomen who did not give birth in the past 12 months Now married:
100.0% (114)Unmarried:
0.0% (0)
Marital status - Asian population 15 years and over
Males 21.3% Never married72.6% Now married0.0% Separated1.3% Widowed4.8% DivorcedFemales 19.9% Never married70.2% Now married0.5% Separated2.9% Widowed6.4% DivorcedWomen who gave birth in the past 12 months Now married:
100.0% (166)Unmarried:
0.0% (0)
Women who did not give birth in the past 12 months Now married:
69.0% (1,427)Unmarried:
31.0% (640)
Marital status - Other race population 15 years and over
Males 35.7% Never married50.9% Now married13.4% Separated0.0% Widowed0.0% DivorcedFemales 41.1% Never married28.2% Now married2.3% Separated1.8% Widowed26.6% DivorcedWomen who gave birth in the past 12 months Now married:
100.0% (42)Unmarried:
0.0% (0)
Women who did not give birth in the past 12 months Now married:
23.2% (167)Unmarried:
76.8% (555)
Marital status - Two or more races population 15 years and over
Males 50.4% Never married42.9% Now married0.0% Separated0.0% Widowed6.8% DivorcedFemales 32.1% Never married37.8% Now married10.6% Separated8.9% Widowed10.6% DivorcedWomen who gave birth in the past 12 months Now married:
100.0% (58)Unmarried:
0.0% (0)
Women who did not give birth in the past 12 months Now married:
46.7% (617)Unmarried:
53.3% (705)
Marital status - White alone, not Hispanic / Latino population 15 years and over
Males 27.2% Never married61.7% Now married0.4% Separated2.6% Widowed8.1% DivorcedFemales 23.7% Never married58.2% Now married0.6% Separated8.6% Widowed8.9% DivorcedWomen who gave birth in the past 12 months Now married:
100.0% (461)Unmarried:
0.0% (0)
Women who did not give birth in the past 12 months Now married:
58.2% (6,200)Unmarried:
41.8% (4,458)
Marital status - Hispanic or Latino population 15 years and over
Males 43.8% Never married47.1% Now married4.0% Separated1.1% Widowed4.1% DivorcedFemales 32.1% Never married38.3% Now married7.3% Separated5.9% Widowed16.3% DivorcedWomen who gave birth in the past 12 months Now married:
100.0% (89)Unmarried:
0.0% (0)
Women who did not give birth in the past 12 months Now married:
42.8% (683)Unmarried:
57.2% (912)
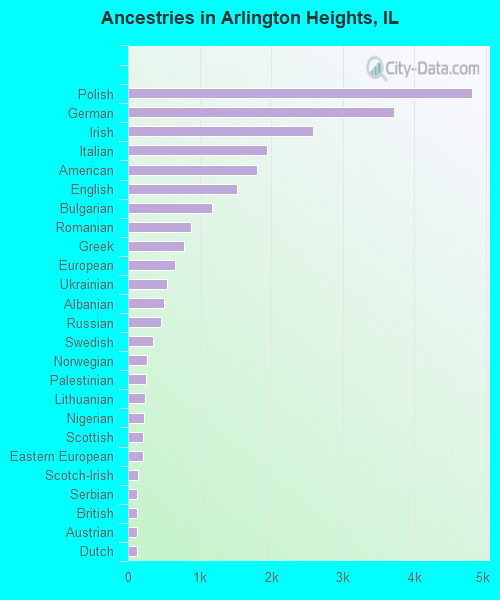
Ancestries in Arlington Heights
4,801 13.0% Polish3,714 10.1% German2,582 7.0% Irish1,938 5.3% Italian1,798 4.9% American1,520 4.1% English1,171 3.2% Bulgarian876 2.4% Romanian786 2.1% Greek656 1.8% European544 1.5% Ukrainian503 1.4% Albanian466 1.3% Russian346 0.9% Swedish267 0.7% Norwegian250 0.7% Palestinian243 0.7% Lithuanian226 0.6% Nigerian214 0.6% Scottish212 0.6% Eastern European140 0.4% Scotch-Irish124 0.3% Serbian123 0.3% British120 0.3% Austrian120 0.3% Dutch105 0.3% Northern European104 0.3% Croatian96 0.3% Assyrian96 0.3% Canadian94 0.3% Scandinavian93 0.3% Egyptian79 0.2% Czech74 0.2% Turkish70 0.2% Hungarian61 0.2% Luxembourger59 0.2% Belgian59 0.2% Slavic59 0.2% Iranian57 0.2% Slovak52 0.1% Moroccan43 0.1% French38 0.1% African36 0.10% Armenian27 0.07% Portuguese26 0.07% Danish24 0.07% Welsh24 0.07% Yugoslavian16 0.04% Macedonian14 0.04% Brazilian11 0.03% Haitian10 0.03% Arab9 0.02% Latvian8 0.02% Czechoslovakian6 0.02% French Canadian2 0.01% Israeli
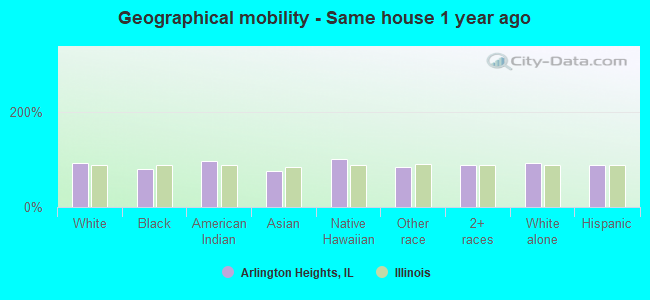
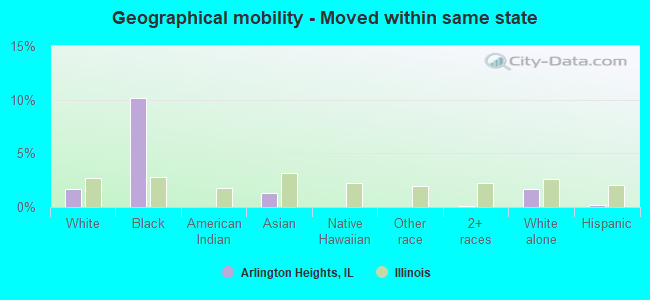
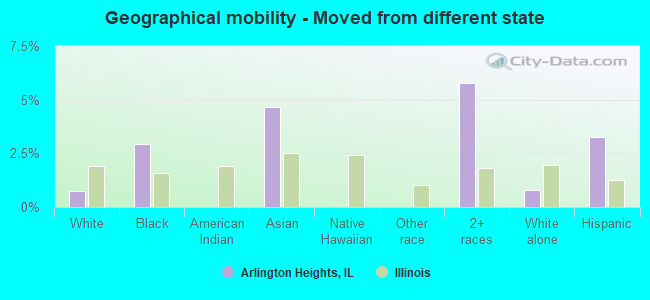
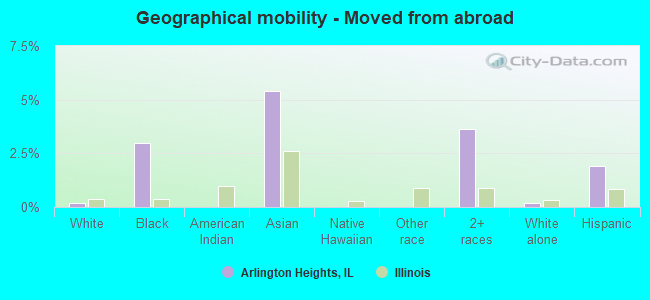
Geographical mobility in Arlington Heights Same house 1 year ago 50,936 93.3% White (Caucasian)1,618 79.9% Black or African American369 97.4% American Indian / Alaska Native6,475 76.0% Asian17 100.0% Native Hawaiian / Pacific Islander1,815 83.3% Other race5,576 88.1% Two or more races50,545 93.3% White alone, not Hispanic / Latino5,820 87.1% Hispanic or LatinoMoved within same county 2,192 4.0% White / Caucasian162 8.0% Black or African American6 1.5% American Indian / Alaska Native1,131 13.3% Asian319 14.6% Other race271 4.3% Two or more races2,192 4.0% White alone, not Hispanic / Latino557 8.3% Hispanic or LatinoMoved within same state 933 1.7% White / Caucasian206 10.2% Black or African American110 1.3% Asian8 0.1% Two or more races933 1.7% White alone, not Hispanic / Latino14 0.2% Hispanic or LatinoMoved from different state 419 0.8% White / Caucasian59 2.9% Black or African American396 4.7% Asian366 5.8% Two or more races419 0.8% White alone, not Hispanic / Latino219 3.3% Hispanic or LatinoMoved from abroad 93 0.2% White60 3.0% Black or African American462 5.4% Asian231 3.6% Two or more races93 0.2% White alone, not Hispanic / Latino127 1.9% Hispanic or Latino
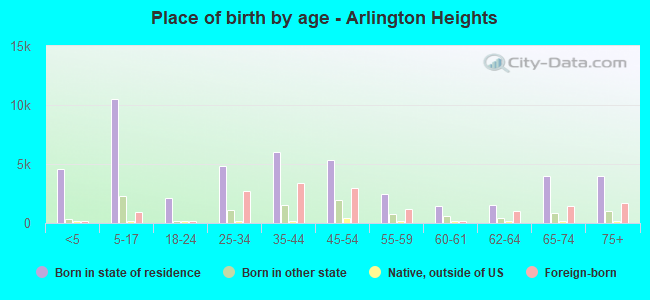
Children Nativity (place of birth) in Arlington Heights
Children under 6 years - Living with two parents Both parents native 3,234 100.0% NativeBoth parents foreign-born 1,234 93.8% Native82 6.2% Foreign-bornOne native, one foreign-born parent 382 100.0% NativeChildren under 6 years - Living with one parent Native parent 149 100.0% NativeForeign-born parent 955 100.0% NativeChildren 6 to 17 years - Living with two parents Both parents native 7,963 100.0% NativeBoth parents foreign-born 1,467 60.6% Native952 39.4% Foreign-bornOne native, one foreign-born parent 739 100.0% NativeChildren 6 to 17 years - Living with one parent Native parent 865 100.0% NativeForeign-born parent 135 50.0% Native135 50.0% Foreign-born
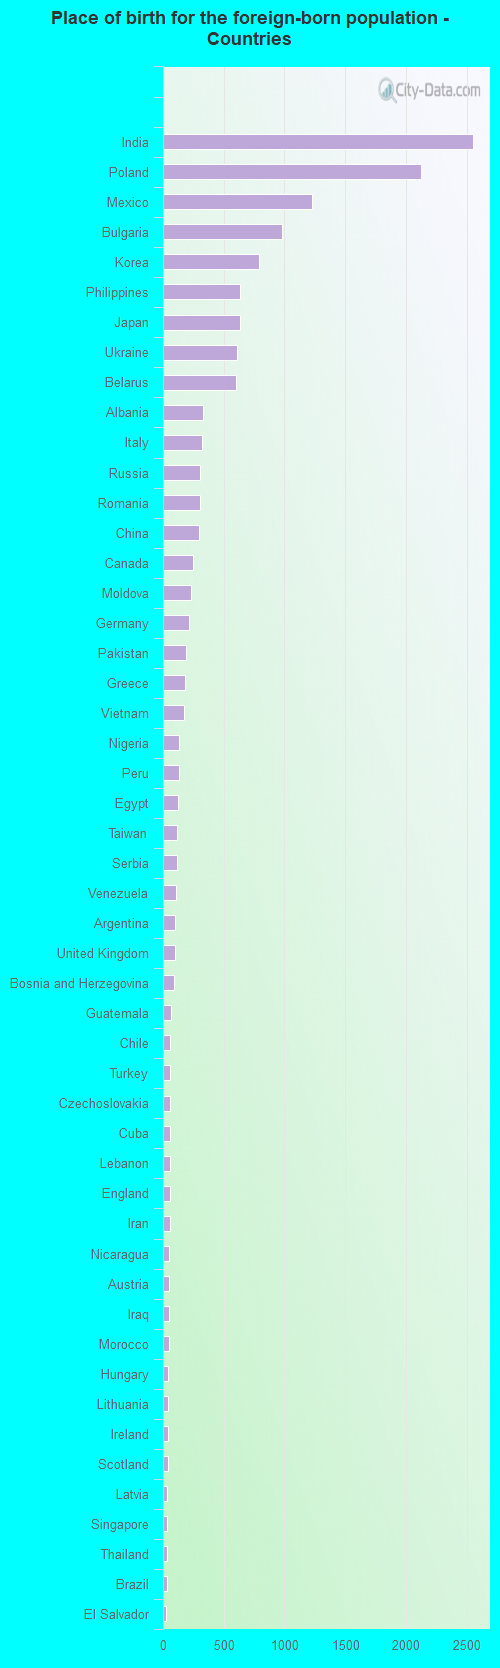
Place of birth for residents in Arlington Heights 7,162 Europe6,057 Eastern Europe5,971 Asia2,845 South Central Asia2,177 Americas1,970 Eastern Asia1,927 Latin America1,375 Central America917 South Eastern Asia524 Southern Europe485 South America432 China401 Africa292 Western Europe288 Northern Europe250 Northern America196 Western Asia193 Northern Africa155 Western Africa66 Caribbean28 Eastern Africa27 Oceania27 Australia and New Zealand Subregion23 Southern Africa2,557 India2,121 Poland1,228 Mexico978 Bulgaria792 Korea638 Philippines638 Japan610 Ukraine598 Belarus327 Albania325 Italy304 Russia302 Romania297 China250 Canada228 Moldova215 Germany190 Pakistan182 Greece177 Vietnam130 Nigeria128 Peru120 Egypt115 Taiwan114 Serbia105 Venezuela102 Argentina95 United Kingdom90 Bosnia and Herzegovina64 Guatemala61 Chile60 Turkey57 Czechoslovakia57 Cuba54 Lebanon54 England54 Iran52 Nicaragua50 Austria49 Iraq48 Morocco45 Hungary45 Lithuania41 Ireland38 Scotland34 Latvia31 Singapore30 Thailand30 Brazil26 El Salvador23 South Africa22 Croatia21 Denmark19 North Macedonia (Macedonia)19 Sweden19 Hong Kong18 Israel16 Spain16 Ecuador15 Norway15 New Zealand14 Netherlands14 Indonesia12 Syria12 Uzbekistan11 Australia10 Switzerland9 Burma (Myanmar)9 Bolivia9 Nepal8 Sudan8 Kazakhstan8 Haiti6 Ghana6 Cambodia6 Malaysia5 Bangladesh4 Colombia2 Belize
Grandparents responsible for own grandchildren in Arlington Heights
Grandparents (30 to 59 years) White / Caucasian 38 50.0% Responsible for grandchildren38 50.0% Not responsible for grandchildrenAsian 47 100.0% Not responsible for grandchildrenOther race 57 100.0% Responsible for grandchildrenWhite alone, not Hispanic / Latino 32 49.7% Responsible for grandchildren33 50.3% Not responsible for grandchildrenHispanic or Latino 62 100.0% Responsible for grandchildrenGrandparents (60 years and over) White / Caucasian 32 11.7% Responsible for grandchildren244 88.3% Not responsible for grandchildrenAsian 13 16.4% Responsible for grandchildren64 83.6% Not responsible for grandchildrenOther race 9 100.0% Not responsible for grandchildrenWhite alone, not Hispanic / Latino 39 11.8% Responsible for grandchildren296 88.2% Not responsible for grandchildrenHispanic or Latino 11 10.8% Responsible for grandchildren94 89.2% Not responsible for grandchildren