Races in Arlington, North Carolina (NC) Detailed Stats
Ancestries, Foreign-born residents, place of birth

Recent posts about races in Arlington, North Carolina on our local forum with over 2,400,000 registered users:
 | Is North Carolina mid-atlantic or southeast (446 replies) |
| Latino Muslim family looking for four seasons (8 replies) |
| After a year of living in Raleigh... (115 replies) |
| The Heritage at Arlington - need reviews (4 replies) |
| Objective Opinion on Charlotte (63 replies) |
| Your sentiment on changing real estate market? (199 replies) |
Latest news about races in Arlington, NC collected exclusively by city-data.com from local newspapers, TV, and radio stations
0.6% of Arlington, NC residents are foreign-born , which is 1172.0% less than the foreign-born rate of 8.0% across the entire state of North Carolina.
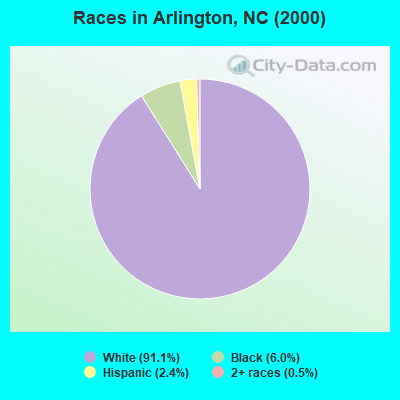
Race distribution in Arlington

- 72491.1%White alone
- 486.0%Black alone
- 192.4%Hispanic
- 40.5%Two or more races
2000
2022
-
- 5,647,15570.2%White alone
- 1,723,30121.4%Black alone
- 378,9634.7%Hispanic
- 112,4161.4%Asian alone
- 95,3331.2%American Indian alone
- 79,9651.0%Two or more races
- 9,0150.1%Other race alone
- 3,1650.04%Native Hawaiian and Other
Pacific Islander alone

-
- 6,497,51960.7%White alone
- 2,155,65020.1%Black alone
- 1,114,79910.4%Hispanic
- 438,0614.1%Two or more races
- 341,0523.2%Asian alone
- 91,7580.9%American Indian alone
- 50,1800.5%Other race alone
- 9,9540.09%Native Hawaiian and Other
Pacific Islander alone

Income and house value in Arlington
- Median household income in 2022
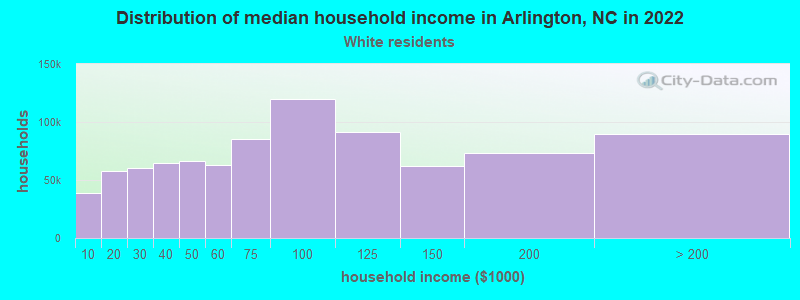
- $46,623White non-Hispanic householders
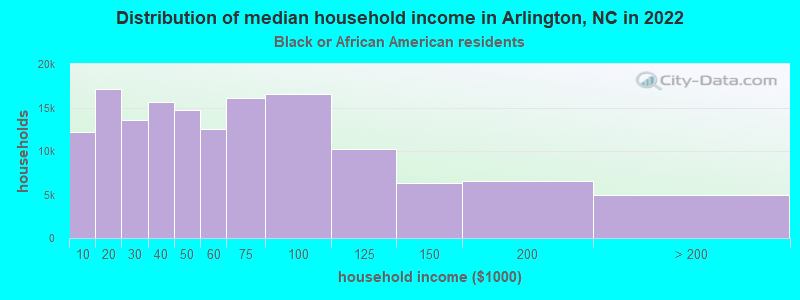
- $16,500Black householders
- $62,652Some other race householders
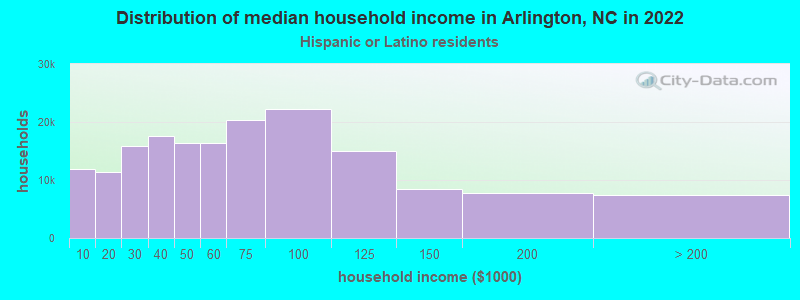
- $65,047Hispanic or Latino race householders
- Median 2022 house value
- $156,264White Non-Hispanic householders
- $112,292Black or African American householders
Household income for White non-Hispanic householders
Household income for Black householders
Household income for Hispanic or Latino race householders
Foreign-born residents in Arlington
5 residents are foreign born
| This city: | 0.6% |
| North Carolina: | 5.3% |
Ancestries in Arlington

- 19533.9%United States
- 11119.3%Other
- 9316.2%English
- 5810.1%German
- 447.7%Irish
- 244.2%French
- 142.4%Dutch
- 101.7%Scotch-Irish
- 81.4%Italian
- 61.0%Slovak
- 40.7%Norwegian
- 40.7%Swedish
- 20.3%Czech
- 20.3%Russian

Zip codes: 28642.