Races in Arlington, Texas (TX) Detailed Stats
Data:
Races - White alone (%)
Races - White alone (% change since 2000)
Races - Black alone (%)
Races - Black alone (% change since 2000)
Races - American Indian alone (%)
Races - American Indian alone (% change since 2000)
Races - Asian alone (%)
Races - Asian alone (% change since 2000)
Races - Hispanic (%)
Races - Hispanic (% change since 2000)
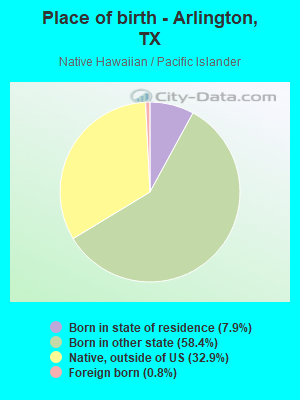
Races - Native Hawaiian and Other Pacific Islander alone (%)
Races - Native Hawaiian and Other Pacific Islander alone (% change since 2000)
Races - Two or more races(%)
Races - Two or more races(% change since 2000)
Races - Other race alone (%)
Races - Other race alone (% change since 2000)
Racial diversity
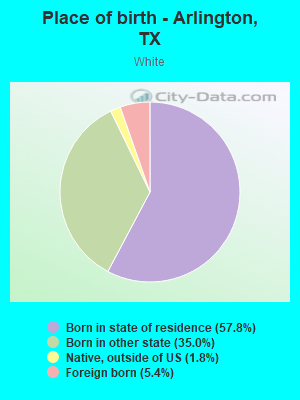
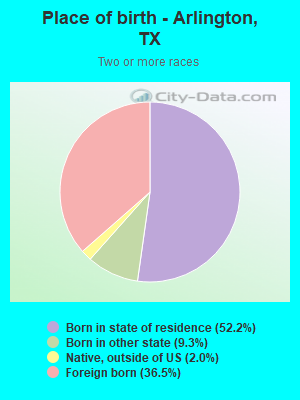
Place of birth - Born in state of residence (%)
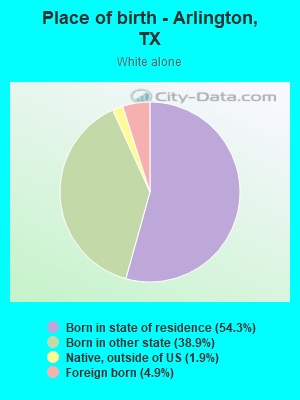
Place of birth - Born in state of residence (%) - White
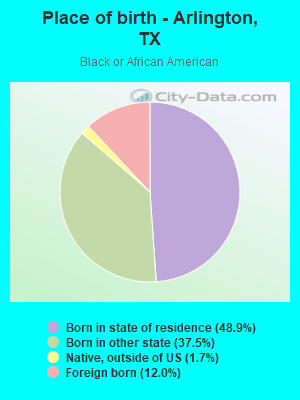
Place of birth - Born in state of residence (%) - Black or African American
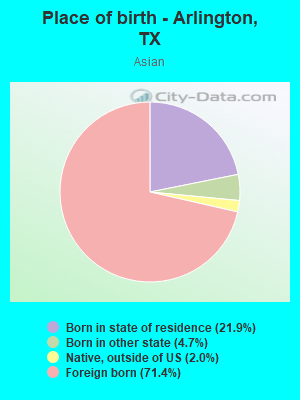
Place of birth - Born in state of residence (%) - Asian
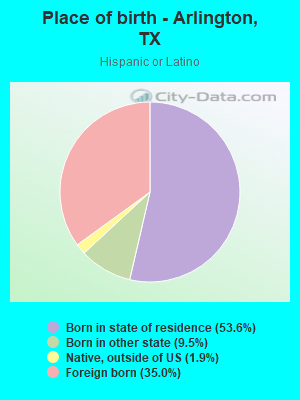
Place of birth - Born in state of residence (%) - Hispanic or Latino
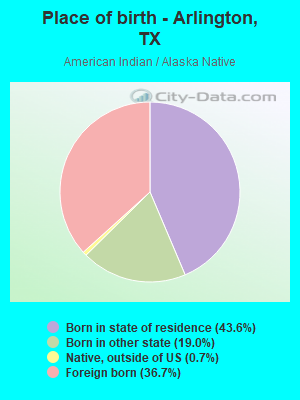
Place of birth - Born in state of residence (%) - American Indian and Alaska Native
Place of birth - Born in state of residence (%) - Multirace
Place of birth - Born in state of residence (%) - Other Race
Place of birth - Born in other state (%)
Place of birth - Born in other state (%) - White
Place of birth - Born in other state (%) - Black or African American
Place of birth - Born in other state (%) - Asian
Place of birth - Born in other state (%) - Hispanic or Latino
Place of birth - Born in other state (%) - American Indian and Alaska Native
Place of birth - Born in other state (%) - Multirace
Place of birth - Born in other state (%) - Other Race
Place of birth - Native, outside of US (%)
Place of birth - Native, outside of US (%) - White
Place of birth - Native, outside of US (%) - Black or African American
Place of birth - Native, outside of US (%) - Asian
Place of birth - Native, outside of US (%) - Hispanic or Latino
Place of birth - Native, outside of US (%) - American Indian and Alaska Native
Place of birth - Native, outside of US (%) - Multirace
Place of birth - Native, outside of US (%) - Other Race
Place of birth - Foreign born (%)
Place of birth - Foreign born (%) - White
Place of birth - Foreign born (%) - Black or African American
Place of birth - Foreign born (%) - Asian
Place of birth - Foreign born (%) - Hispanic or Latino
Place of birth - Foreign born (%) - American Indian and Alaska Native
Place of birth - Foreign born (%) - Multirace
Place of birth - Foreign born (%) - Other Race
Residents speaking English at home (%)
Residents speaking English at home - Born in the United States (%)
Residents speaking English at home - Native, born elsewhere (%)
Residents speaking English at home - Foreign born (%)
Residents speaking Spanish at home (%)
Residents speaking Spanish at home - Born in the United States (%)
Residents speaking Spanish at home - Native, born elsewhere (%)
Residents speaking Spanish at home - Foreign born (%)
Residents speaking other language at home (%)
Residents speaking other language at home - Born in the United States (%)
Residents speaking other language at home - Native, born elsewhere (%)
Residents speaking other language at home - Foreign born (%)
Marital status - Never married (%)
Marital status - Now married (%)
Marital status - Separated (%)
Marital status - Widowed (%)
Marital status - Divorced (%)
Ancestries Reported - Arab (%)
Ancestries Reported - Czech (%)
Ancestries Reported - Danish (%)
Ancestries Reported - Dutch (%)
Ancestries Reported - English (%)
Ancestries Reported - French (%)
Ancestries Reported - French Canadian (%)
Ancestries Reported - German (%)
Ancestries Reported - Greek (%)
Ancestries Reported - Hungarian (%)
Ancestries Reported - Irish (%)
Ancestries Reported - Italian (%)
Ancestries Reported - Lithuanian (%)
Ancestries Reported - Norwegian (%)
Ancestries Reported - Polish (%)
Ancestries Reported - Portuguese (%)
Ancestries Reported - Russian (%)
Ancestries Reported - Scotch-Irish (%)
Ancestries Reported - Scottish (%)
Ancestries Reported - Slovak (%)
Ancestries Reported - Subsaharan African (%)
Ancestries Reported - Swedish (%)
Ancestries Reported - Swiss (%)
Ancestries Reported - Ukrainian (%)
Ancestries Reported - United States (%)
Ancestries Reported - Welsh (%)
Ancestries Reported - West Indian (%)
Ancestries Reported - Other (%)
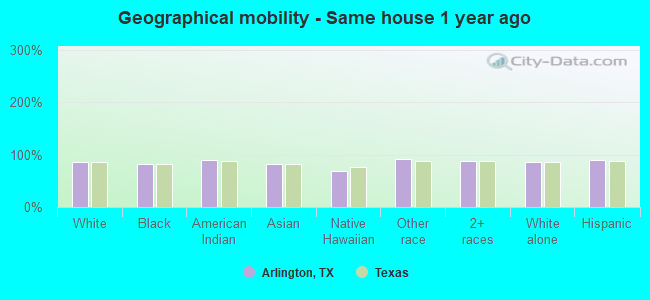
Geographical mobility - Same house 1 year ago (%)
Geographical mobility - Same house 1 year ago (%) - White
Geographical mobility - Same house 1 year ago (%) - Black or African American
Geographical mobility - Same house 1 year ago (%) - Asian
Geographical mobility - Same house 1 year ago (%) - Hispanic or Latino
Geographical mobility - Same house 1 year ago (%) - American Indian and Alaska Native
Geographical mobility - Same house 1 year ago (%) - Multirace
Geographical mobility - Same house 1 year ago (%) - Other Race
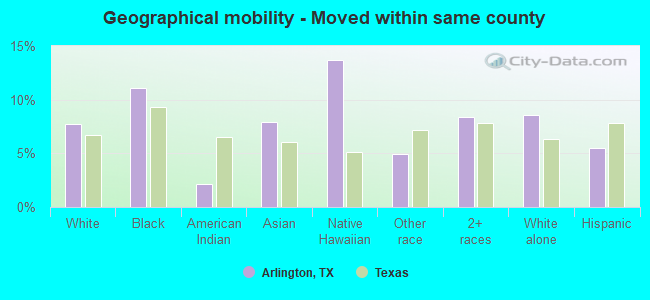
Geographical mobility - Moved within same county (%)
Geographical mobility - Moved within same county (%) - White
Geographical mobility - Moved within same county (%) - Black or African American
Geographical mobility - Moved within same county (%) - Asian
Geographical mobility - Moved within same county (%) - Hispanic or Latino
Geographical mobility - Moved within same county (%) - American Indian and Alaska Native
Geographical mobility - Moved within same county (%) - Multirace
Geographical mobility - Moved within same county (%) - Other Race
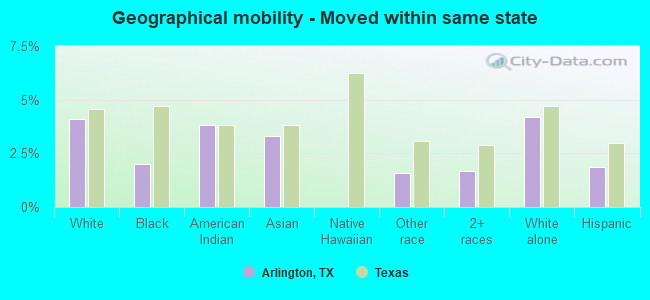
Geographical mobility - Moved from different county within same state (%)
Geographical mobility - Moved from different county within same state (%) - White
Geographical mobility - Moved from different county within same state (%) - Black or African American
Geographical mobility - Moved from different county within same state (%) - Asian
Geographical mobility - Moved from different county within same state (%) - Hispanic or Latino
Geographical mobility - Moved from different county within same state (%) - American Indian and Alaska Native
Geographical mobility - Moved from different county within same state (%) - Multirace
Geographical mobility - Moved from different county within same state (%) - Other Race
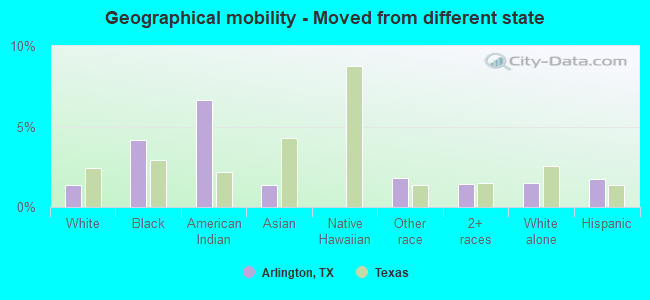
Geographical mobility - Moved from different state (%)
Geographical mobility - Moved from different state (%) - White
Geographical mobility - Moved from different state (%) - Black or African American
Geographical mobility - Moved from different state (%) - Asian
Geographical mobility - Moved from different state (%) - Hispanic or Latino
Geographical mobility - Moved from different state (%) - American Indian and Alaska Native
Geographical mobility - Moved from different state (%) - Multirace
Geographical mobility - Moved from different state (%) - Other Race
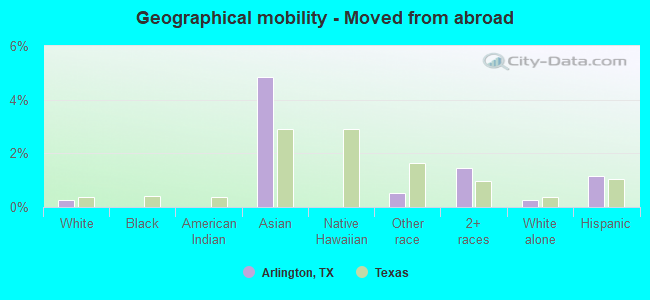
Geographical mobility - Moved from abroad (%)
Geographical mobility - Moved from abroad (%) - White
Geographical mobility - Moved from abroad (%) - Black or African American
Geographical mobility - Moved from abroad (%) - Asian
Geographical mobility - Moved from abroad (%) - Hispanic or Latino
Geographical mobility - Moved from abroad (%) - American Indian and Alaska Native
Geographical mobility - Moved from abroad (%) - Multirace
Geographical mobility - Moved from abroad (%) - Other Race
Place of birth for the foreign-born population - Ireland (%)
Place of birth for the foreign-born population - Denmark (%)
Place of birth for the foreign-born population - Norway (%)
Place of birth for the foreign-born population - Sweden (%)
Place of birth for the foreign-born population - United Kingdom (%)
Place of birth for the foreign-born population - England (%)
Place of birth for the foreign-born population - Scotland (%)
Place of birth for the foreign-born population - Other Northern Europe (%)
Place of birth for the foreign-born population - Austria (%)
Place of birth for the foreign-born population - Belgium (%)
Place of birth for the foreign-born population - France (%)
Place of birth for the foreign-born population - Germany (%)
Place of birth for the foreign-born population - Netherlands (%)
Place of birth for the foreign-born population - Switzerland (%)
Place of birth for the foreign-born population - Other Western Europe (%)
Place of birth for the foreign-born population - Greece (%)
Place of birth for the foreign-born population - Italy (%)
Place of birth for the foreign-born population - Portugal (%)
Place of birth for the foreign-born population - Spain (%)
Place of birth for the foreign-born population - Other Southern Europe (%)
Place of birth for the foreign-born population - Albania (%)
Place of birth for the foreign-born population - Belarus (%)
Place of birth for the foreign-born population - Bosnia and Herzegovina (%)
Place of birth for the foreign-born population - Bulgaria (%)
Place of birth for the foreign-born population - Croatia (%)
Place of birth for the foreign-born population - Czechoslovakia (%)
Place of birth for the foreign-born population - Hungary (%)
Place of birth for the foreign-born population - Latvia (%)
Place of birth for the foreign-born population - Lithuania (%)
Place of birth for the foreign-born population - North Macedonia (Macedonia) (%)
Place of birth for the foreign-born population - Moldova (%)
Place of birth for the foreign-born population - Poland (%)
Place of birth for the foreign-born population - Romania (%)
Place of birth for the foreign-born population - Russia (%)
Place of birth for the foreign-born population - Serbia (%)
Place of birth for the foreign-born population - Ukraine (%)
Place of birth for the foreign-born population - Other Eastern Europe (%)
Place of birth for the foreign-born population - China (%)
Place of birth for the foreign-born population - Hong Kong (%)
Place of birth for the foreign-born population - Taiwan (%)
Place of birth for the foreign-born population - Japan (%)
Place of birth for the foreign-born population - Korea (%)
Place of birth for the foreign-born population - Other Eastern Asia (%)
Place of birth for the foreign-born population - Afghanistan (%)
Place of birth for the foreign-born population - Bangladesh (%)
Place of birth for the foreign-born population - India (%)
Place of birth for the foreign-born population - Iran (%)
Place of birth for the foreign-born population - Kazakhstan (%)
Place of birth for the foreign-born population - Nepal (%)
Place of birth for the foreign-born population - Pakistan (%)
Place of birth for the foreign-born population - Sri Lanka (%)
Place of birth for the foreign-born population - Uzbekistan (%)
Place of birth for the foreign-born population - Other South Central Asia (%)
Place of birth for the foreign-born population - Burma (%)
Place of birth for the foreign-born population - Cambodia (%)
Place of birth for the foreign-born population - Indonesia (%)
Place of birth for the foreign-born population - Laos (%)
Place of birth for the foreign-born population - Malaysia (%)
Place of birth for the foreign-born population - Philippines (%)
Place of birth for the foreign-born population - Singapore (%)
Place of birth for the foreign-born population - Thailand (%)
Place of birth for the foreign-born population - Vietnam (%)
Place of birth for the foreign-born population - Other South Eastern Asia (%)
Place of birth for the foreign-born population - Armenia (%)
Place of birth for the foreign-born population - Iraq (%)
Place of birth for the foreign-born population - Israel (%)
Place of birth for the foreign-born population - Jordan (%)
Place of birth for the foreign-born population - Kuwait (%)
Place of birth for the foreign-born population - Lebanon (%)
Place of birth for the foreign-born population - Saudi Arabia (%)
Place of birth for the foreign-born population - Syria (%)
Place of birth for the foreign-born population - Turkey (%)
Place of birth for the foreign-born population - Yemen (%)
Place of birth for the foreign-born population - Other Western Asia (%)
Place of birth for the foreign-born population - Eritrea (%)
Place of birth for the foreign-born population - Ethiopia (%)
Place of birth for the foreign-born population - Kenya (%)
Place of birth for the foreign-born population - Somalia (%)
Place of birth for the foreign-born population - Uganda (%)
Place of birth for the foreign-born population - Zimbabwe (%)
Place of birth for the foreign-born population - Other Eastern Africa (%)
Place of birth for the foreign-born population - Cameroon (%)
Place of birth for the foreign-born population - Congo (%)
Place of birth for the foreign-born population - Democratic Republic of Congo (Zaire) (%)
Place of birth for the foreign-born population - Other Middle Africa (%)
Place of birth for the foreign-born population - Egypt (%)
Place of birth for the foreign-born population - Morocco (%)
Place of birth for the foreign-born population - Sudan (%)
Place of birth for the foreign-born population - Other Northern Africa (%)
Place of birth for the foreign-born population - South Africa (%)
Place of birth for the foreign-born population - Other Southern Africa (%)
Place of birth for the foreign-born population - Cabo Verde (%)
Place of birth for the foreign-born population - Ghana (%)
Place of birth for the foreign-born population - Liberia (%)
Place of birth for the foreign-born population - Nigeria (%)
Place of birth for the foreign-born population - Senegal (%)
Place of birth for the foreign-born population - Sierra Leone (%)
Place of birth for the foreign-born population - Other Western Africa (%)
Place of birth for the foreign-born population - Australia (%)
Place of birth for the foreign-born population - New Zealand (%)
Place of birth for the foreign-born population - Fiji (%)
Place of birth for the foreign-born population - Micronesia (%)
Place of birth for the foreign-born population - Bahamas (%)
Place of birth for the foreign-born population - Barbados (%)
Place of birth for the foreign-born population - Cuba (%)
Place of birth for the foreign-born population - Dominica (%)
Place of birth for the foreign-born population - Dominican Republic (%)
Place of birth for the foreign-born population - Grenada (%)
Place of birth for the foreign-born population - Haiti (%)
Place of birth for the foreign-born population - Jamaica (%)
Place of birth for the foreign-born population - St. Vincent and the Grenadines (%)
Place of birth for the foreign-born population - Trinidad and Tobago (%)
Place of birth for the foreign-born population - West Indies (%)
Place of birth for the foreign-born population - Other Caribbean (%)
Place of birth for the foreign-born population - Belize (%)
Place of birth for the foreign-born population - Costa Rica (%)
Place of birth for the foreign-born population - El Salvador (%)
Place of birth for the foreign-born population - Guatemala (%)
Place of birth for the foreign-born population - Honduras (%)
Place of birth for the foreign-born population - Mexico (%)
Place of birth for the foreign-born population - Nicaragua (%)
Place of birth for the foreign-born population - Panama (%)
Place of birth for the foreign-born population - Other Central America (%)
Place of birth for the foreign-born population - Argentina (%)
Place of birth for the foreign-born population - Bolivia (%)
Place of birth for the foreign-born population - Brazil (%)
Place of birth for the foreign-born population - Chile (%)
Place of birth for the foreign-born population - Colombia (%)
Place of birth for the foreign-born population - Ecuador (%)
Place of birth for the foreign-born population - Guyana (%)
Place of birth for the foreign-born population - Peru (%)
Place of birth for the foreign-born population - Uruguay (%)
Place of birth for the foreign-born population - Venezuela (%)
Place of birth for the foreign-born population - Other South America (%)
Place of birth for the foreign-born population - Canada (%)
Place of birth for the foreign-born population - Other Northern America (%)
Place of birth for the foreign-born population - Other (%)
Latest news about races in Arlington, TX collected exclusively by city-data.com from local newspapers, TV, and radio stations
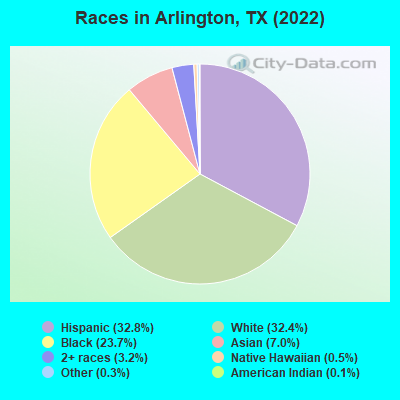
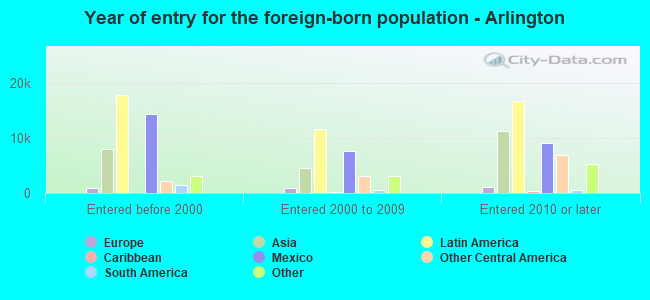
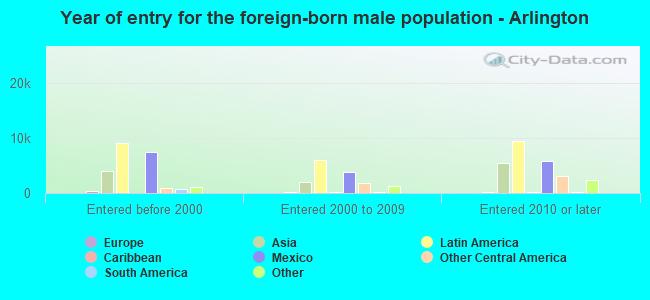
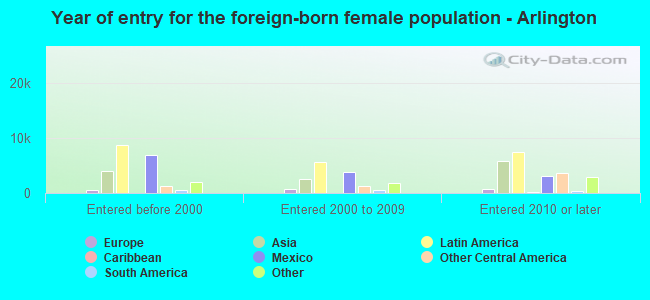
According to 2022 data, the most numerous races in Arlington, TX are Hispanic (129,401 residents), White alone (127,748 residents), and Black alone (93,681 residents). 63.3% of Arlington residents speak English at home. 21.2% of Arlington, TX residents are foreign-born (10.4% born in Latin America, 6.4% born in Asia, 3.4% born in Africa), which is 19.8% greater than the foreign-born rate of 17.0% across the entire state of Texas.
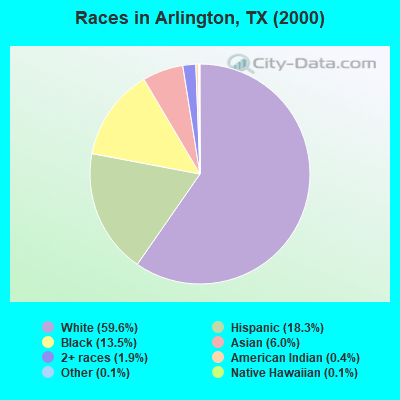
Race distribution in Arlington
2000 2022
198,591 59.6% White alone 60,817 18.3% Hispanic 45,061 13.5% Black alone 19,837 6.0% Asian alone 6,483 1.9% Two or more races 1,359 0.4% American Indian alone 415 0.1% Other race alone 406 0.1% Native Hawaiian and Other
129,401 32.8% Hispanic 127,748 32.4% White alone 93,681 23.7% Black alone 27,627 7.0% Asian alone 12,764 3.2% Two or more races 1,779 0.5% Native Hawaiian and Other 1,053 0.3% Other race alone 520 0.1% American Indian alone
2000 2022
10,933,313 52.4% White alone 6,669,666 32.0% Hispanic 2,364,255 11.3% Black alone 554,445 2.7% Asian alone 230,567 1.1% Two or more races 68,859 0.3% American Indian alone 19,958 0.10% Other race alone 10,757 0.05% Native Hawaiian and Other
12,070,642 40.2% Hispanic 11,683,430 38.9% White alone 3,508,706 11.7% Black alone 1,608,173 5.4% Asian alone 956,560 3.2% Two or more races 125,763 0.4% Other race alone 47,023 0.2% American Indian alone 29,275 0.10% Native Hawaiian and Other
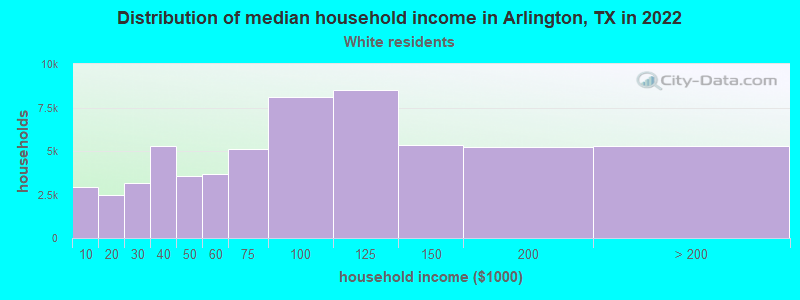
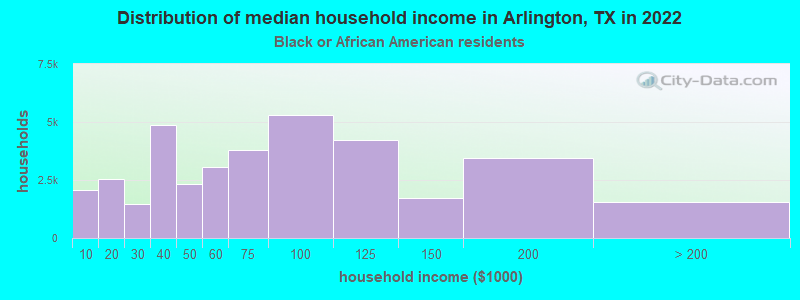
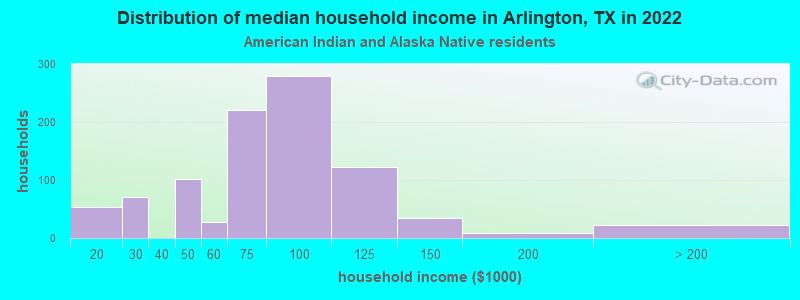
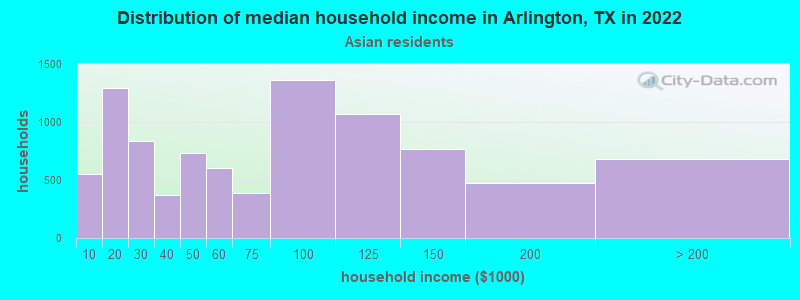
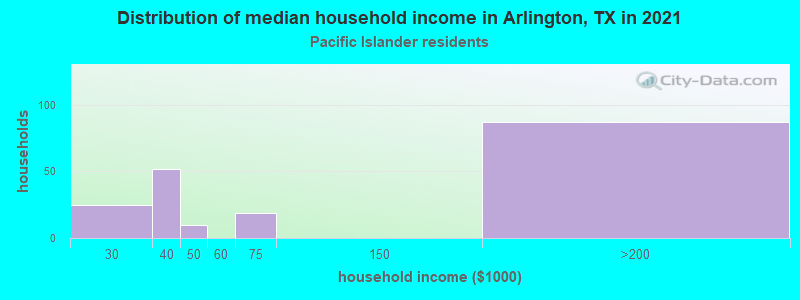
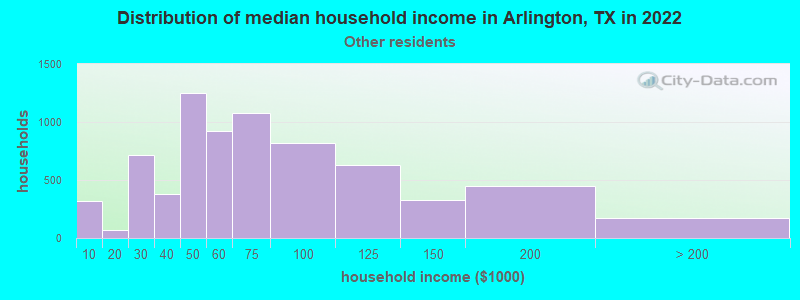
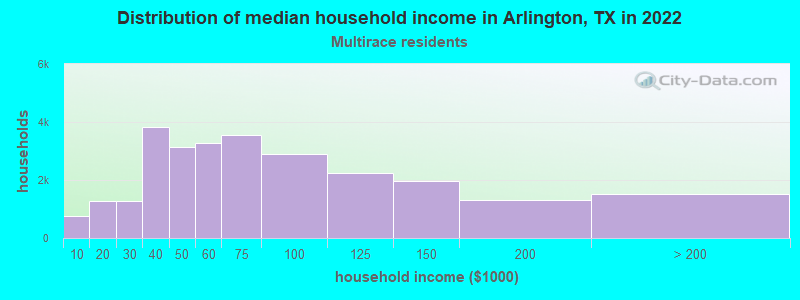
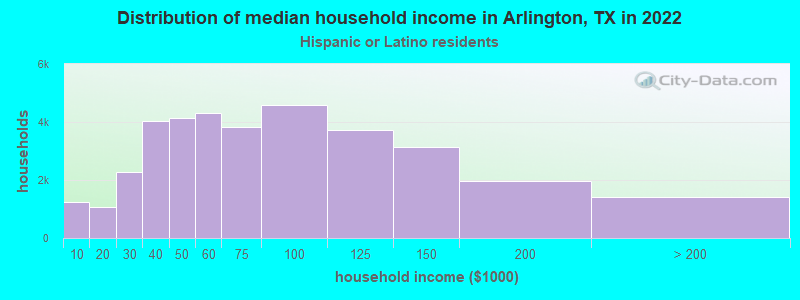
Income and house value in Arlington Median household income in 2022 $81,660 White non-Hispanic householders$64,116 Black householders$76,192 American Indian and Alaska Native householders$66,075 Asian householders$30,798 Native Hawaiian and other Pacific Islander householders$58,346 Some other race householders$59,685 Two or more races householders$61,591 Hispanic or Latino race householdersMedian 2022 house value $297,847 White Non-Hispanic householders$284,295 Black or African American householders$246,349 American Indian or Alaska Native householders $284,897 Asian householders$229,484 Some other race householders$259,299 Two or more races householders$241,530 Hispanic or Latino householders
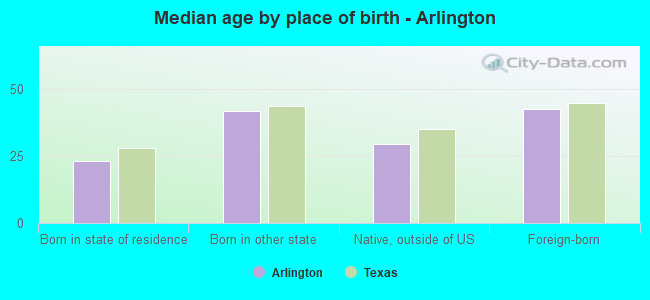
Median age by race in Arlington
41.3 Median age for White residents40.6 42.0 31.7 Median age for Black or African American residents30.7 32.6 43.4 Median age for American Indian / Alaska Native residents46.0 30.9 32.6 Median age for Asian residents33.3 31.0 42.1 Median age for Native Hawaiian / Pacific Islander residents26.9 55.3 27.2 Median age for Other race residents27.8 26.7 24.8 Median age for Two or more races residents24.7 25.0 44.6 Median age for White alone residents43.3 45.5 25.7 Median age for Hispanic or Latino residents26.2 25.3
Owner/renter occupied households by race in Arlington
House owners and renters - White residents 40,372 68.8% Owner occupied18,306 31.2% Renter occupiedHouse owners and renters - Black or African American residents 11,186 30.7% Owner occupied25,208 69.3% Renter occupiedHouse owners and renters - American Indian / Alaska Native residents 646 73.9% Owner occupied228 26.1% Renter occupiedHouse owners and renters - Asian residents 5,310 58.2% Owner occupied3,814 41.8% Renter occupiedHouse owners and renters - Native Hawaiian / Pacific Islander residents 343 34.8% Owner occupied642 65.2% Renter occupiedHouse owners and renters - Other race residents 5,059 70.8% Owner occupied2,085 29.2% Renter occupiedHouse owners and renters - Two or more races residents 12,512 46.2% Owner occupied14,548 53.8% Renter occupiedHouse owners and renters - White alone residents 37,342 68.7% Owner occupied17,003 31.3% Renter occupiedHouse owners and renters - Hispanic or Latino residents 19,367 54.2% Owner occupied16,377 45.8% Renter occupied
Language usage in Arlington
English speakers - Total 63.3% of residents of Arlington speak English at home.
25.2% of residents speak Spanish at home 55,606 59.9% Speak English very well37,262 40.1% Speak English less than very well11.4% of residents speak other language at home 28,333 67.2% Speak English very well13,801 32.8% Speak English less than very well
English speakers - Born in the United States 88.9% of residents of Arlington speak English at home.
8.0% of residents speak Spanish at home 6,905 86.9% Speak English very well1,041 13.1% Speak English less than very well3.2% of residents speak other language at home 2,767 86.7% Speak English very well425 13.3% Speak English less than very well
English speakers - Native, born elsewhere 55.8% of residents of Arlington speak English at home.
25.3% of residents speak Spanish at home 1,534 82.2% Speak English very well332 17.8% Speak English less than very well18.9% of residents speak other language at home 1,388 100.0% Speak English very well
English speakers - Foreign-born 10.0% of residents of Arlington speak English at home.
52.3% of residents speak Spanish at home 11,721 26.8% Speak English very well32,019 73.2% Speak English less than very well37.7% of residents speak other language at home 19,166 60.8% Speak English very well12,357 39.2% Speak English less than very well
White (Caucasian) - Speak only English Native:
92.7% (122,261)Foreign-born:
23.1% (1,800)
White (Caucasian) - Speak another language Native:
7.3% (9,596)Foreign-born:
76.9% (6,005)
Black or African American - Speak only English Native:
94.0% (72,370)Foreign-born:
23.3% (2,648)
Black or African American - Speak another language Native:
6.0% (4,586)Foreign-born:
76.7% (8,735)
American Indian / Alaska Native - Speak another language Native:
48.7% (737)Foreign-born:
100.0% (901)
Asian - Speak only English Native:
50.1% (3,555)Foreign-born:
10.6% (2,113)
Asian - Speak another language Native:
49.9% (3,540)Foreign-born:
89.4% (17,795)
Native Hawaiian / Pacific Islander - Speak another language Native:
10.3% (185)Foreign-born:
100.0% (14)
Other race - Speak only English Native:
33.4% (5,054)Foreign-born:
6.2% (590)
Other race - Speak another language Native:
66.6% (10,065)Foreign-born:
93.8% (8,890)
Two or more races - Speak only English Native:
40.0% (19,670)Foreign-born:
3.7% (1,230)
Two or more races - Speak another language Native:
60.0% (29,446)Foreign-born:
96.3% (32,157)
White alone - Speak only English Native:
96.4% (112,821)Foreign-born:
23.8% (1,487)
White alone - Speak another language Native:
3.6% (4,215)Foreign-born:
76.2% (4,764)
Hispanic or Latino - Speak only English Native:
35.6% (25,657)Foreign-born:
2.7% (1,207)
Hispanic or Latino - Speak another language Native:
64.4% (46,400)Foreign-born:
97.3% (43,695)
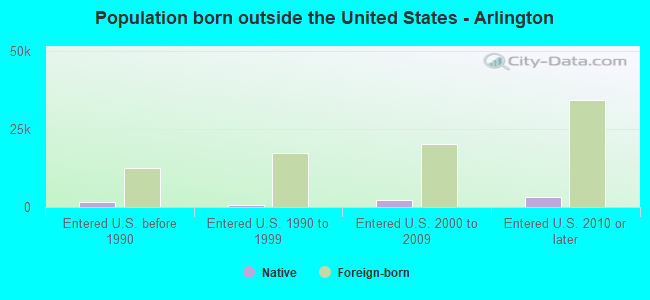
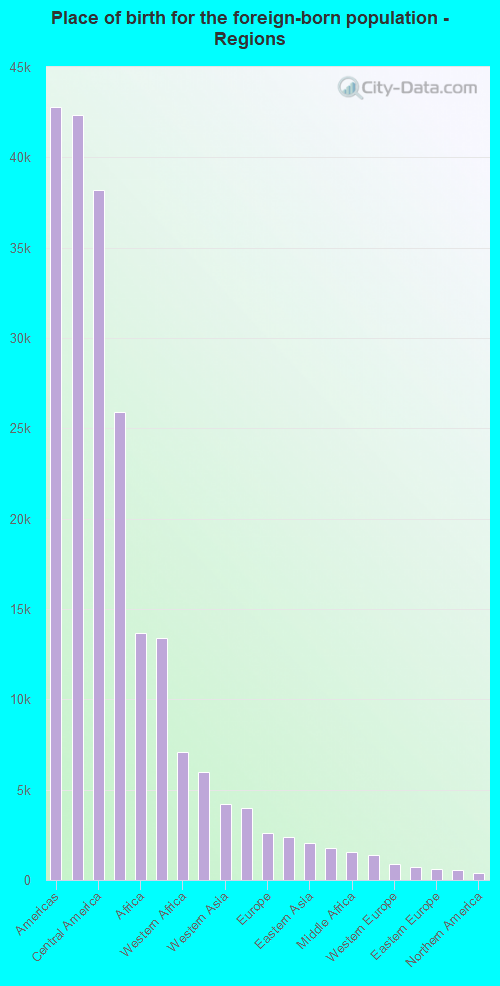
Foreign-born residents in Arlington 84,974 residents are foreign born (10.4% Latin America , 6.4% Asia , 3.4% Africa ).
This city:
21.2%Texas:
17.1%
Marital status for residents in Arlington Marital status - White (Caucasian) population 15 years and over
Males 33.3% Never married52.6% Now married1.1% Separated2.8% Widowed10.3% DivorcedFemales 27.8% Never married47.3% Now married1.7% Separated8.2% Widowed15.0% DivorcedWomen who gave birth in the past 12 months Now married:
46.8% (954)Unmarried:
53.2% (1,086)
Women who did not give birth in the past 12 months Now married:
43.4% (14,119)Unmarried:
56.6% (18,392)
Marital status - Black or African American population 15 years and over
Males 49.1% Never married38.7% Now married2.7% Separated2.6% Widowed6.9% DivorcedFemales 48.5% Never married27.2% Now married4.5% Separated5.1% Widowed14.7% DivorcedWomen who gave birth in the past 12 months Now married:
18.5% (271)Unmarried:
81.5% (1,196)
Women who did not give birth in the past 12 months Now married:
27.0% (7,247)Unmarried:
73.0% (19,643)
Marital status - American Indian / Alaska Native population 15 years and over
Males 46.6% Never married50.2% Now married0.0% Separated1.1% Widowed2.2% DivorcedFemales 43.5% Never married41.4% Now married0.0% Separated11.8% Widowed3.4% DivorcedWomen who gave birth in the past 12 months Now married:
100.0% (13)Unmarried:
0.0% (0)
Women who did not give birth in the past 12 months Now married:
44.7% (422)Unmarried:
55.3% (521)
Marital status - Asian population 15 years and over
Males 37.6% Never married51.2% Now married1.3% Separated4.1% Widowed5.9% DivorcedFemales 37.0% Never married56.8% Now married0.0% Separated4.5% Widowed1.7% DivorcedWomen who gave birth in the past 12 months Now married:
100.0% (581)Unmarried:
0.0% (0)
Women who did not give birth in the past 12 months Now married:
46.8% (3,941)Unmarried:
53.2% (4,475)
Marital status - Native Hawaiian / Pacific Islander population 15 years and over
Males 43.3% Never married43.3% Now married0.0% Separated13.4% Widowed0.0% DivorcedFemales 49.4% Never married43.8% Now married0.0% Separated0.0% Widowed6.8% DivorcedWomen who did not give birth in the past 12 months Now married:
43.4% (244)Unmarried:
56.6% (317)
Marital status - Other race population 15 years and over
Males 39.6% Never married53.8% Now married3.9% Separated0.0% Widowed2.8% DivorcedFemales 44.5% Never married47.1% Now married0.5% Separated3.5% Widowed4.4% DivorcedWomen who gave birth in the past 12 months Now married:
100.0% (517)Unmarried:
0.0% (0)
Women who did not give birth in the past 12 months Now married:
34.9% (2,659)Unmarried:
65.1% (4,951)
Marital status - Two or more races population 15 years and over
Males 51.5% Never married38.5% Now married4.4% Separated0.5% Widowed5.1% DivorcedFemales 46.5% Never married42.3% Now married3.1% Separated2.6% Widowed5.5% DivorcedWomen who gave birth in the past 12 months Now married:
22.8% (201)Unmarried:
77.2% (679)
Women who did not give birth in the past 12 months Now married:
39.9% (9,345)Unmarried:
60.1% (14,067)
Marital status - White alone, not Hispanic / Latino population 15 years and over
Males 32.6% Never married52.3% Now married1.2% Separated3.0% Widowed10.9% DivorcedFemales 26.4% Never married47.0% Now married1.3% Separated9.0% Widowed16.3% DivorcedWomen who gave birth in the past 12 months Now married:
45.9% (669)Unmarried:
54.1% (787)
Women who did not give birth in the past 12 months Now married:
41.1% (11,185)Unmarried:
58.9% (16,008)
Marital status - Hispanic or Latino population 15 years and over
Males 47.0% Never married44.0% Now married3.9% Separated0.5% Widowed4.6% DivorcedFemales 44.6% Never married46.2% Now married2.9% Separated2.4% Widowed3.9% DivorcedWomen who gave birth in the past 12 months Now married:
62.6% (986)Unmarried:
37.4% (589)
Women who did not give birth in the past 12 months Now married:
42.5% (14,689)Unmarried:
57.5% (19,841)
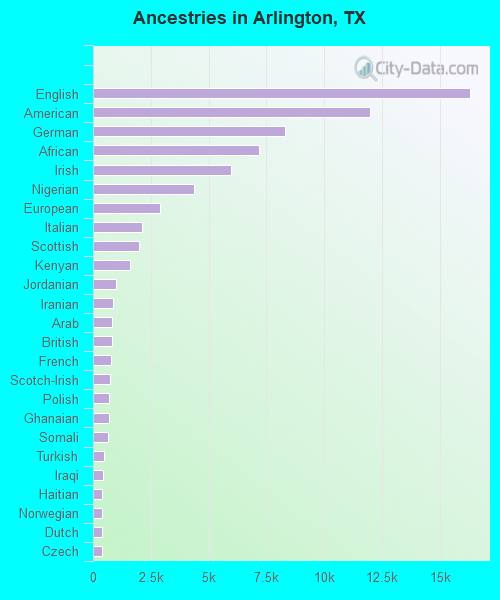
Ancestries in Arlington
16,313 6.6% English11,975 4.8% American8,298 3.3% German7,167 2.9% African5,986 2.4% Irish4,380 1.8% Nigerian2,905 1.2% European2,117 0.9% Italian1,996 0.8% Scottish1,592 0.6% Kenyan1,010 0.4% Jordanian879 0.4% Iranian830 0.3% Arab819 0.3% British776 0.3% French729 0.3% Scotch-Irish695 0.3% Polish679 0.3% Ghanaian642 0.3% Somali477 0.2% Turkish440 0.2% Iraqi404 0.2% Haitian380 0.2% Norwegian375 0.2% Dutch373 0.2% Czech367 0.1% Jamaican354 0.1% Liberian328 0.1% Cajun312 0.1% Sudanese310 0.1% Northern European308 0.1% Swedish282 0.1% Portuguese271 0.1% Ukrainian251 0.1% Eastern European236 0.10% Lebanese229 0.09% Ugandan224 0.09% Russian208 0.08% Moroccan206 0.08% West Indian205 0.08% Palestinian194 0.08% French Canadian155 0.06% Welsh149 0.06% Brazilian140 0.06% Greek133 0.05% Afghan129 0.05% Trinidadian and Tobagonian125 0.05% Ethiopian121 0.05% Syrian108 0.04% Scandinavian84 0.03% Belizean82 0.03% Canadian78 0.03% Basque65 0.03% Hungarian64 0.03% Slavic62 0.03% Austrian60 0.02% British West Indian60 0.02% Macedonian59 0.02% Estonian54 0.02% Egyptian52 0.02% Danish49 0.02% Slovak43 0.02% Senegalese35 0.01% Bulgarian33 0.01% Romanian33 0.01% Swiss31 0.01% Czechoslovakian30 0.01% Belgian29 0.01% Cypriot27 0.01% Lithuanian23 0.01% Albanian22 0.01% Serbian15 0.01% Slovene14 0.01% Zimbabwean13 0.01% Finnish
Geographical mobility in Arlington Same house 1 year ago 124,970 86.5% White (Caucasian)78,180 82.7% Black or African American2,197 90.2% American Indian / Alaska Native22,898 82.5% Asian1,320 67.9% Native Hawaiian / Pacific Islander23,967 91.2% Other race79,672 87.1% Two or more races108,549 85.5% White alone, not Hispanic / Latino114,503 89.7% Hispanic or LatinoMoved within same county 11,186 7.7% White / Caucasian10,469 11.1% Black or African American53 2.2% American Indian / Alaska Native2,198 7.9% Asian266 13.7% Native Hawaiian / Pacific Islander1,289 4.9% Other race7,636 8.4% Two or more races10,902 8.6% White alone, not Hispanic / Latino7,027 5.5% Hispanic or LatinoMoved within same state 5,947 4.1% White / Caucasian1,914 2.0% Black or African American93 3.8% American Indian / Alaska Native917 3.3% Asian416 1.6% Other race1,512 1.7% Two or more races5,298 4.2% White alone, not Hispanic / Latino2,385 1.9% Hispanic or LatinoMoved from different state 1,934 1.3% White / Caucasian3,927 4.2% Black or African American161 6.6% American Indian / Alaska Native383 1.4% Asian470 1.8% Other race1,286 1.4% Two or more races1,886 1.5% White alone, not Hispanic / Latino2,252 1.8% Hispanic or LatinoMoved from abroad 371 0.3% White1,348 4.9% Asian136 0.5% Other race1,317 1.4% Two or more races337 0.3% White alone, not Hispanic / Latino1,487 1.2% Hispanic or Latino
Children Nativity (place of birth) in Arlington
Children under 6 years - Living with two parents Both parents native 8,014 100.0% NativeBoth parents foreign-born 6,585 97.4% Native176 2.6% Foreign-bornOne native, one foreign-born parent 2,974 100.0% NativeChildren under 6 years - Living with one parent Native parent 8,496 100.0% NativeForeign-born parent 2,514 84.3% Native468 15.7% Foreign-bornChildren 6 to 17 years - Living with two parents Both parents native 20,692 98.6% Native296 1.4% Foreign-bornBoth parents foreign-born 12,897 84.3% Native2,408 15.7% Foreign-bornOne native, one foreign-born parent 3,562 97.2% Native103 2.8% Foreign-bornChildren 6 to 17 years - Living with one parent Native parent 15,504 100.0% NativeForeign-born parent 8,885 55.8% Native7,037 44.2% Foreign-born
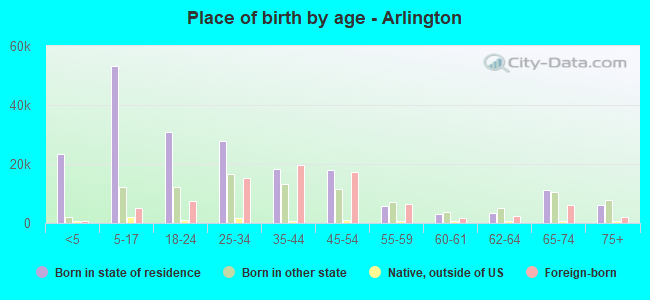
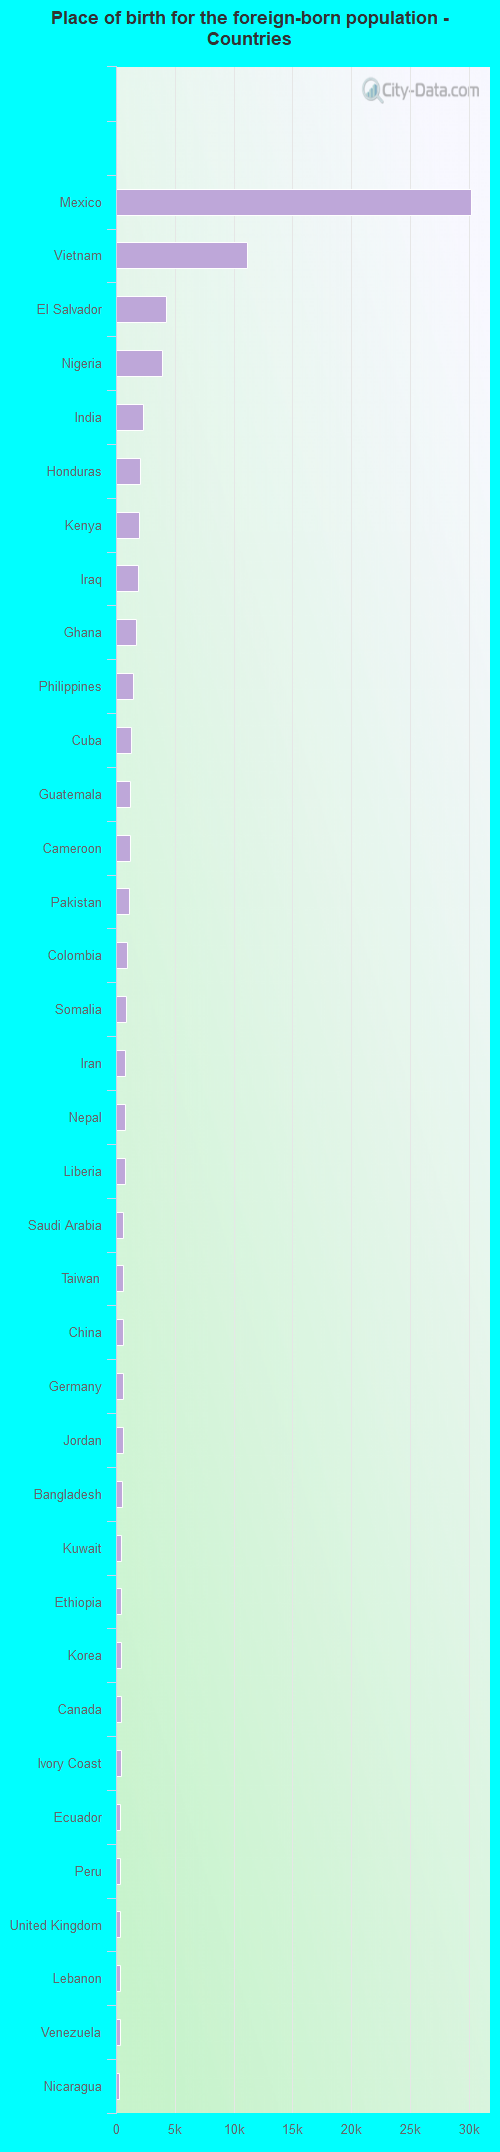
Place of birth for residents in Arlington 42,766 Americas42,357 Latin America38,199 Central America25,920 Asia13,696 Africa13,389 South Eastern Asia7,107 Western Africa5,985 South Central Asia4,184 Western Asia3,966 Eastern Africa2,576 Europe2,380 South America2,048 Eastern Asia1,777 Caribbean1,537 Middle Africa1,385 China906 Western Europe717 Northern Europe612 Eastern Europe573 Northern Africa409 Northern America339 Southern Europe64 Southern Africa14 Oceania30,212 Mexico11,138 Vietnam4,239 El Salvador3,953 Nigeria2,325 India2,021 Honduras1,975 Kenya1,841 Iraq1,671 Ghana1,471 Philippines1,234 Cuba1,209 Guatemala1,180 Cameroon1,127 Pakistan972 Colombia857 Somalia797 Iran795 Nepal753 Liberia634 Saudi Arabia606 Taiwan597 China555 Germany554 Jordan508 Bangladesh462 Kuwait426 Ethiopia423 Korea409 Canada396 Ivory Coast341 Ecuador326 Peru325 United Kingdom314 Lebanon304 Venezuela280 Nicaragua270 England264 Brazil251 Indonesia249 Turkey239 Japan237 Afghanistan235 Sudan210 Congo204 Malaysia201 France182 Italy181 Hong Kong176 Sri Lanka173 Trinidad and Tobago157 Russia149 Haiti146 Poland138 Panama122 Algeria120 Democratic Republic of Congo (Zaire)115 Thailand110 Morocco107 Uganda104 Spain100 Burma (Myanmar)100 Uruguay96 Belize90 Jamaica82 Belgium81 Senegal79 Dominican Republic77 Ireland77 Syria74 Cambodia64 South Africa63 Egypt52 Greece52 Netherlands46 Romania38 Ukraine35 Zimbabwe33 Laos33 Hungary27 Latvia24 Bahamas22 Israel20 Czechoslovakia20 Bosnia and Herzegovina20 Sweden19 Bolivia19 Guyana16 Bulgaria16 Argentina15 Denmark14 Chile13 North Macedonia (Macedonia)10 Dominica9 Micronesia9 Bhutan8 Switzerland7 Kazakhstan7 Norway6 Austria5 Barbados1 Armenia
Grandparents responsible for own grandchildren in Arlington
Grandparents (30 to 59 years) White / Caucasian 499 43.3% Responsible for grandchildren653 56.7% Not responsible for grandchildrenBlack or African American 579 65.4% Responsible for grandchildren306 34.6% Not responsible for grandchildrenAmerican Indian / Alaska Native 11 19.1% Responsible for grandchildren48 80.9% Not responsible for grandchildrenAsian 184 51.7% Responsible for grandchildren172 48.3% Not responsible for grandchildrenOther race 191 39.3% Responsible for grandchildren295 60.7% Not responsible for grandchildrenTwo or more races 636 55.1% Responsible for grandchildren518 44.9% Not responsible for grandchildrenWhite alone, not Hispanic / Latino 436 45.7% Responsible for grandchildren518 54.3% Not responsible for grandchildrenHispanic or Latino 669 31.8% Responsible for grandchildren1,434 68.2% Not responsible for grandchildrenGrandparents (60 years and over) White / Caucasian 660 37.4% Responsible for grandchildren1,106 62.6% Not responsible for grandchildrenBlack or African American 513 45.8% Responsible for grandchildren607 54.2% Not responsible for grandchildrenAmerican Indian / Alaska Native 47 100.0% Responsible for grandchildrenAsian 166 32.2% Responsible for grandchildren349 67.8% Not responsible for grandchildrenOther race 81 30.0% Responsible for grandchildren189 70.0% Not responsible for grandchildrenTwo or more races 559 43.8% Responsible for grandchildren717 56.2% Not responsible for grandchildrenWhite alone, not Hispanic / Latino 526 39.0% Responsible for grandchildren823 61.0% Not responsible for grandchildrenHispanic or Latino 714 43.8% Responsible for grandchildren918 56.2% Not responsible for grandchildren
Zip codes: 75050 , 75051 , 75052 , 76001 , 76002 , 76006 , 76010 , 76011 , 76012 , 76013 , 76014 , 76015 , 76016 , 76017 , 76018 , 76040 , 76060 , 76063 , 76112 , 76119 , 76120 .