Races in Arlington, Washington (WA) Detailed Stats
Data:
Races - White alone (%)
Races - White alone (% change since 2000)
Races - Black alone (%)
Races - Black alone (% change since 2000)
Races - American Indian alone (%)
Races - American Indian alone (% change since 2000)
Races - Asian alone (%)
Races - Asian alone (% change since 2000)
Races - Hispanic (%)
Races - Hispanic (% change since 2000)
Races - Native Hawaiian and Other Pacific Islander alone (%)
Races - Native Hawaiian and Other Pacific Islander alone (% change since 2000)
Races - Two or more races(%)
Races - Two or more races(% change since 2000)
Races - Other race alone (%)
Races - Other race alone (% change since 2000)
Racial diversity
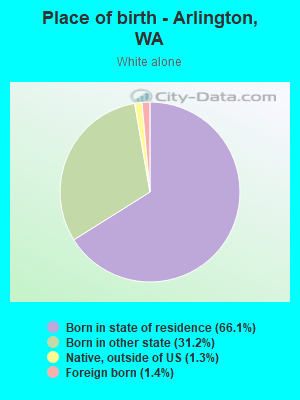
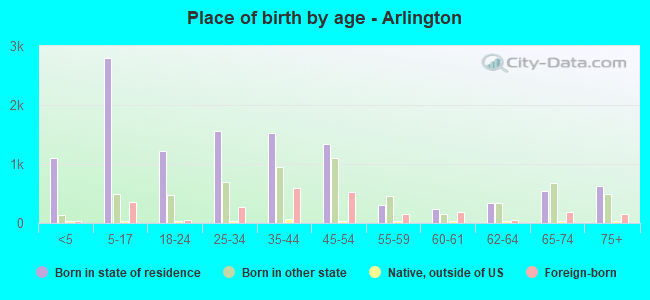
Place of birth - Born in state of residence (%)
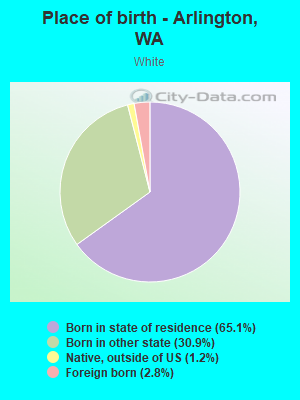
Place of birth - Born in state of residence (%) - White
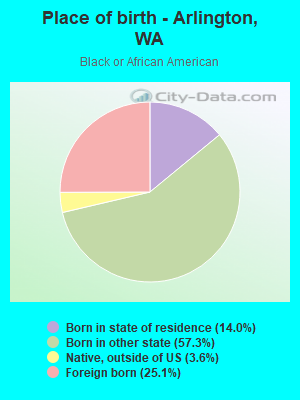
Place of birth - Born in state of residence (%) - Black or African American
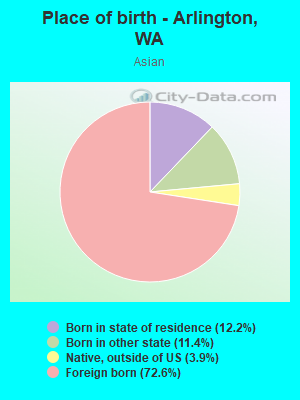
Place of birth - Born in state of residence (%) - Asian
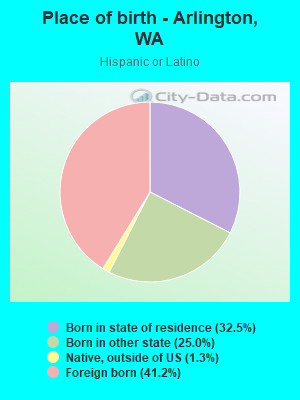
Place of birth - Born in state of residence (%) - Hispanic or Latino
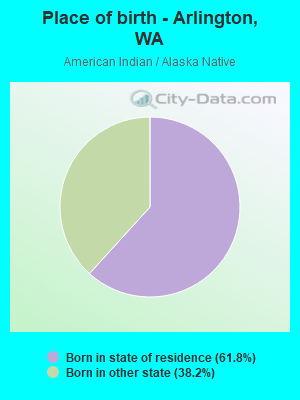
Place of birth - Born in state of residence (%) - American Indian and Alaska Native
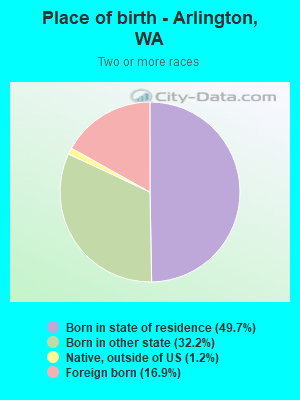
Place of birth - Born in state of residence (%) - Multirace
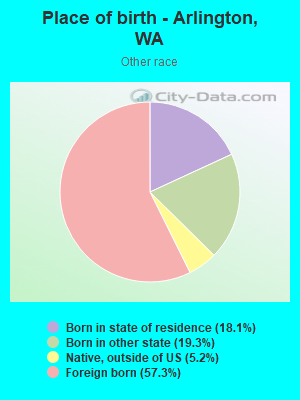
Place of birth - Born in state of residence (%) - Other Race
Place of birth - Born in other state (%)
Place of birth - Born in other state (%) - White
Place of birth - Born in other state (%) - Black or African American
Place of birth - Born in other state (%) - Asian
Place of birth - Born in other state (%) - Hispanic or Latino
Place of birth - Born in other state (%) - American Indian and Alaska Native
Place of birth - Born in other state (%) - Multirace
Place of birth - Born in other state (%) - Other Race
Place of birth - Native, outside of US (%)
Place of birth - Native, outside of US (%) - White
Place of birth - Native, outside of US (%) - Black or African American
Place of birth - Native, outside of US (%) - Asian
Place of birth - Native, outside of US (%) - Hispanic or Latino
Place of birth - Native, outside of US (%) - American Indian and Alaska Native
Place of birth - Native, outside of US (%) - Multirace
Place of birth - Native, outside of US (%) - Other Race
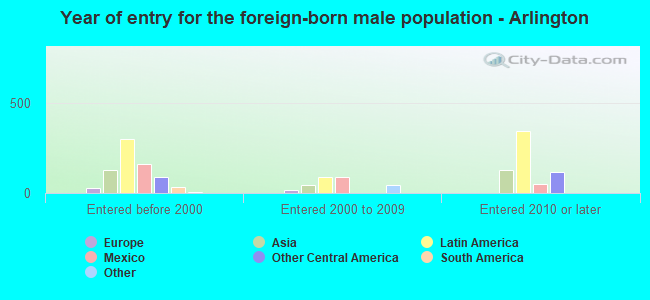
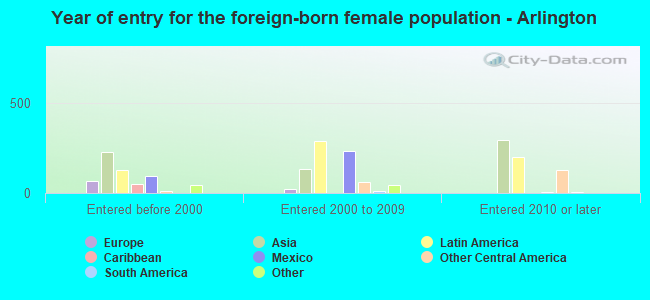
Place of birth - Foreign born (%)
Place of birth - Foreign born (%) - White
Place of birth - Foreign born (%) - Black or African American
Place of birth - Foreign born (%) - Asian
Place of birth - Foreign born (%) - Hispanic or Latino
Place of birth - Foreign born (%) - American Indian and Alaska Native
Place of birth - Foreign born (%) - Multirace
Place of birth - Foreign born (%) - Other Race
Residents speaking English at home (%)
Residents speaking English at home - Born in the United States (%)
Residents speaking English at home - Native, born elsewhere (%)
Residents speaking English at home - Foreign born (%)
Residents speaking Spanish at home (%)
Residents speaking Spanish at home - Born in the United States (%)
Residents speaking Spanish at home - Native, born elsewhere (%)
Residents speaking Spanish at home - Foreign born (%)
Residents speaking other language at home (%)
Residents speaking other language at home - Born in the United States (%)
Residents speaking other language at home - Native, born elsewhere (%)
Residents speaking other language at home - Foreign born (%)
Marital status - Never married (%)
Marital status - Now married (%)
Marital status - Separated (%)
Marital status - Widowed (%)
Marital status - Divorced (%)
Ancestries Reported - Arab (%)
Ancestries Reported - Czech (%)
Ancestries Reported - Danish (%)
Ancestries Reported - Dutch (%)
Ancestries Reported - English (%)
Ancestries Reported - French (%)
Ancestries Reported - French Canadian (%)
Ancestries Reported - German (%)
Ancestries Reported - Greek (%)
Ancestries Reported - Hungarian (%)
Ancestries Reported - Irish (%)
Ancestries Reported - Italian (%)
Ancestries Reported - Lithuanian (%)
Ancestries Reported - Norwegian (%)
Ancestries Reported - Polish (%)
Ancestries Reported - Portuguese (%)
Ancestries Reported - Russian (%)
Ancestries Reported - Scotch-Irish (%)
Ancestries Reported - Scottish (%)
Ancestries Reported - Slovak (%)
Ancestries Reported - Subsaharan African (%)
Ancestries Reported - Swedish (%)
Ancestries Reported - Swiss (%)
Ancestries Reported - Ukrainian (%)
Ancestries Reported - United States (%)
Ancestries Reported - Welsh (%)
Ancestries Reported - West Indian (%)
Ancestries Reported - Other (%)
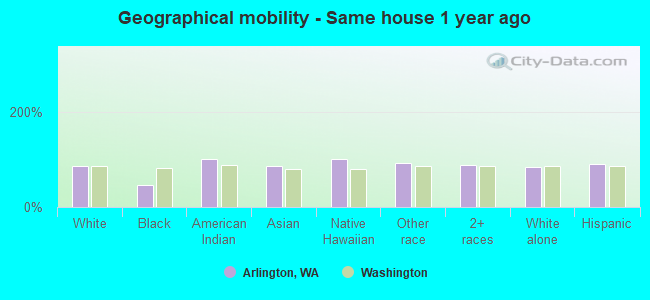
Geographical mobility - Same house 1 year ago (%)
Geographical mobility - Same house 1 year ago (%) - White
Geographical mobility - Same house 1 year ago (%) - Black or African American
Geographical mobility - Same house 1 year ago (%) - Asian
Geographical mobility - Same house 1 year ago (%) - Hispanic or Latino
Geographical mobility - Same house 1 year ago (%) - American Indian and Alaska Native
Geographical mobility - Same house 1 year ago (%) - Multirace
Geographical mobility - Same house 1 year ago (%) - Other Race
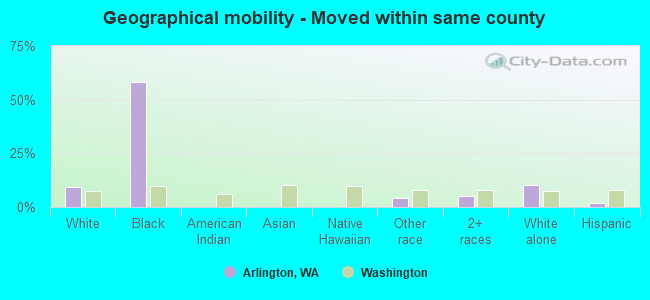
Geographical mobility - Moved within same county (%)
Geographical mobility - Moved within same county (%) - White
Geographical mobility - Moved within same county (%) - Black or African American
Geographical mobility - Moved within same county (%) - Asian
Geographical mobility - Moved within same county (%) - Hispanic or Latino
Geographical mobility - Moved within same county (%) - American Indian and Alaska Native
Geographical mobility - Moved within same county (%) - Multirace
Geographical mobility - Moved within same county (%) - Other Race
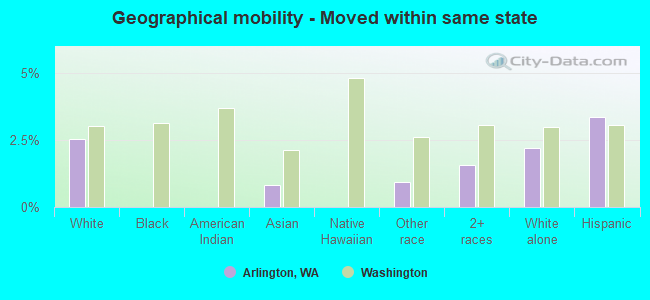
Geographical mobility - Moved from different county within same state (%)
Geographical mobility - Moved from different county within same state (%) - White
Geographical mobility - Moved from different county within same state (%) - Black or African American
Geographical mobility - Moved from different county within same state (%) - Asian
Geographical mobility - Moved from different county within same state (%) - Hispanic or Latino
Geographical mobility - Moved from different county within same state (%) - American Indian and Alaska Native
Geographical mobility - Moved from different county within same state (%) - Multirace
Geographical mobility - Moved from different county within same state (%) - Other Race
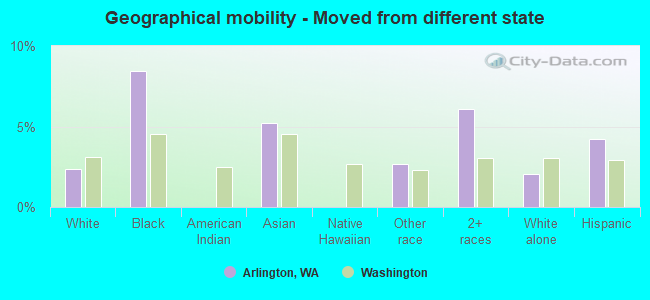
Geographical mobility - Moved from different state (%)
Geographical mobility - Moved from different state (%) - White
Geographical mobility - Moved from different state (%) - Black or African American
Geographical mobility - Moved from different state (%) - Asian
Geographical mobility - Moved from different state (%) - Hispanic or Latino
Geographical mobility - Moved from different state (%) - American Indian and Alaska Native
Geographical mobility - Moved from different state (%) - Multirace
Geographical mobility - Moved from different state (%) - Other Race
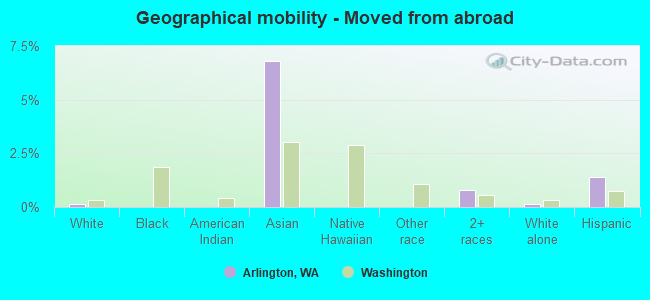
Geographical mobility - Moved from abroad (%)
Geographical mobility - Moved from abroad (%) - White
Geographical mobility - Moved from abroad (%) - Black or African American
Geographical mobility - Moved from abroad (%) - Asian
Geographical mobility - Moved from abroad (%) - Hispanic or Latino
Geographical mobility - Moved from abroad (%) - American Indian and Alaska Native
Geographical mobility - Moved from abroad (%) - Multirace
Geographical mobility - Moved from abroad (%) - Other Race
Place of birth for the foreign-born population - Ireland (%)
Place of birth for the foreign-born population - Denmark (%)
Place of birth for the foreign-born population - Norway (%)
Place of birth for the foreign-born population - Sweden (%)
Place of birth for the foreign-born population - United Kingdom (%)
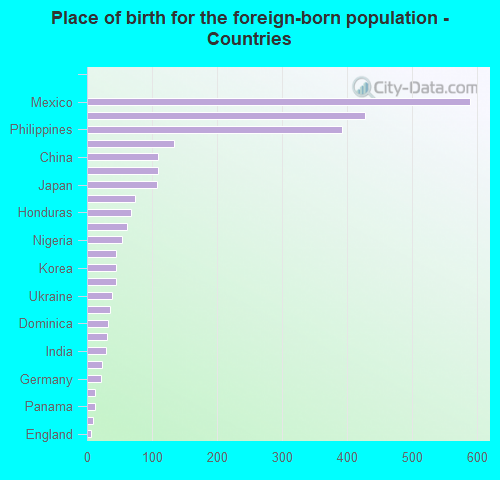
Place of birth for the foreign-born population - England (%)
Place of birth for the foreign-born population - Scotland (%)
Place of birth for the foreign-born population - Other Northern Europe (%)
Place of birth for the foreign-born population - Austria (%)
Place of birth for the foreign-born population - Belgium (%)
Place of birth for the foreign-born population - France (%)
Place of birth for the foreign-born population - Germany (%)
Place of birth for the foreign-born population - Netherlands (%)
Place of birth for the foreign-born population - Switzerland (%)
Place of birth for the foreign-born population - Other Western Europe (%)
Place of birth for the foreign-born population - Greece (%)
Place of birth for the foreign-born population - Italy (%)
Place of birth for the foreign-born population - Portugal (%)
Place of birth for the foreign-born population - Spain (%)
Place of birth for the foreign-born population - Other Southern Europe (%)
Place of birth for the foreign-born population - Albania (%)
Place of birth for the foreign-born population - Belarus (%)
Place of birth for the foreign-born population - Bosnia and Herzegovina (%)
Place of birth for the foreign-born population - Bulgaria (%)
Place of birth for the foreign-born population - Croatia (%)
Place of birth for the foreign-born population - Czechoslovakia (%)
Place of birth for the foreign-born population - Hungary (%)
Place of birth for the foreign-born population - Latvia (%)
Place of birth for the foreign-born population - Lithuania (%)
Place of birth for the foreign-born population - North Macedonia (Macedonia) (%)
Place of birth for the foreign-born population - Moldova (%)
Place of birth for the foreign-born population - Poland (%)
Place of birth for the foreign-born population - Romania (%)
Place of birth for the foreign-born population - Russia (%)
Place of birth for the foreign-born population - Serbia (%)
Place of birth for the foreign-born population - Ukraine (%)
Place of birth for the foreign-born population - Other Eastern Europe (%)
Place of birth for the foreign-born population - China (%)
Place of birth for the foreign-born population - Hong Kong (%)
Place of birth for the foreign-born population - Taiwan (%)
Place of birth for the foreign-born population - Japan (%)
Place of birth for the foreign-born population - Korea (%)
Place of birth for the foreign-born population - Other Eastern Asia (%)
Place of birth for the foreign-born population - Afghanistan (%)
Place of birth for the foreign-born population - Bangladesh (%)
Place of birth for the foreign-born population - India (%)
Place of birth for the foreign-born population - Iran (%)
Place of birth for the foreign-born population - Kazakhstan (%)
Place of birth for the foreign-born population - Nepal (%)
Place of birth for the foreign-born population - Pakistan (%)
Place of birth for the foreign-born population - Sri Lanka (%)
Place of birth for the foreign-born population - Uzbekistan (%)
Place of birth for the foreign-born population - Other South Central Asia (%)
Place of birth for the foreign-born population - Burma (%)
Place of birth for the foreign-born population - Cambodia (%)
Place of birth for the foreign-born population - Indonesia (%)
Place of birth for the foreign-born population - Laos (%)
Place of birth for the foreign-born population - Malaysia (%)
Place of birth for the foreign-born population - Philippines (%)
Place of birth for the foreign-born population - Singapore (%)
Place of birth for the foreign-born population - Thailand (%)
Place of birth for the foreign-born population - Vietnam (%)
Place of birth for the foreign-born population - Other South Eastern Asia (%)
Place of birth for the foreign-born population - Armenia (%)
Place of birth for the foreign-born population - Iraq (%)
Place of birth for the foreign-born population - Israel (%)
Place of birth for the foreign-born population - Jordan (%)
Place of birth for the foreign-born population - Kuwait (%)
Place of birth for the foreign-born population - Lebanon (%)
Place of birth for the foreign-born population - Saudi Arabia (%)
Place of birth for the foreign-born population - Syria (%)
Place of birth for the foreign-born population - Turkey (%)
Place of birth for the foreign-born population - Yemen (%)
Place of birth for the foreign-born population - Other Western Asia (%)
Place of birth for the foreign-born population - Eritrea (%)
Place of birth for the foreign-born population - Ethiopia (%)
Place of birth for the foreign-born population - Kenya (%)
Place of birth for the foreign-born population - Somalia (%)
Place of birth for the foreign-born population - Uganda (%)
Place of birth for the foreign-born population - Zimbabwe (%)
Place of birth for the foreign-born population - Other Eastern Africa (%)
Place of birth for the foreign-born population - Cameroon (%)
Place of birth for the foreign-born population - Congo (%)
Place of birth for the foreign-born population - Democratic Republic of Congo (Zaire) (%)
Place of birth for the foreign-born population - Other Middle Africa (%)
Place of birth for the foreign-born population - Egypt (%)
Place of birth for the foreign-born population - Morocco (%)
Place of birth for the foreign-born population - Sudan (%)
Place of birth for the foreign-born population - Other Northern Africa (%)
Place of birth for the foreign-born population - South Africa (%)
Place of birth for the foreign-born population - Other Southern Africa (%)
Place of birth for the foreign-born population - Cabo Verde (%)
Place of birth for the foreign-born population - Ghana (%)
Place of birth for the foreign-born population - Liberia (%)
Place of birth for the foreign-born population - Nigeria (%)
Place of birth for the foreign-born population - Senegal (%)
Place of birth for the foreign-born population - Sierra Leone (%)
Place of birth for the foreign-born population - Other Western Africa (%)
Place of birth for the foreign-born population - Australia (%)
Place of birth for the foreign-born population - New Zealand (%)
Place of birth for the foreign-born population - Fiji (%)
Place of birth for the foreign-born population - Micronesia (%)
Place of birth for the foreign-born population - Bahamas (%)
Place of birth for the foreign-born population - Barbados (%)
Place of birth for the foreign-born population - Cuba (%)
Place of birth for the foreign-born population - Dominica (%)
Place of birth for the foreign-born population - Dominican Republic (%)
Place of birth for the foreign-born population - Grenada (%)
Place of birth for the foreign-born population - Haiti (%)
Place of birth for the foreign-born population - Jamaica (%)
Place of birth for the foreign-born population - St. Vincent and the Grenadines (%)
Place of birth for the foreign-born population - Trinidad and Tobago (%)
Place of birth for the foreign-born population - West Indies (%)
Place of birth for the foreign-born population - Other Caribbean (%)
Place of birth for the foreign-born population - Belize (%)
Place of birth for the foreign-born population - Costa Rica (%)
Place of birth for the foreign-born population - El Salvador (%)
Place of birth for the foreign-born population - Guatemala (%)
Place of birth for the foreign-born population - Honduras (%)
Place of birth for the foreign-born population - Mexico (%)
Place of birth for the foreign-born population - Nicaragua (%)
Place of birth for the foreign-born population - Panama (%)
Place of birth for the foreign-born population - Other Central America (%)
Place of birth for the foreign-born population - Argentina (%)
Place of birth for the foreign-born population - Bolivia (%)
Place of birth for the foreign-born population - Brazil (%)
Place of birth for the foreign-born population - Chile (%)
Place of birth for the foreign-born population - Colombia (%)
Place of birth for the foreign-born population - Ecuador (%)
Place of birth for the foreign-born population - Guyana (%)
Place of birth for the foreign-born population - Peru (%)
Place of birth for the foreign-born population - Uruguay (%)
Place of birth for the foreign-born population - Venezuela (%)
Place of birth for the foreign-born population - Other South America (%)
Place of birth for the foreign-born population - Canada (%)
Place of birth for the foreign-born population - Other Northern America (%)
Place of birth for the foreign-born population - Other (%)
Latest news about races in Arlington, WA collected exclusively by city-data.com from local newspapers, TV, and radio stations
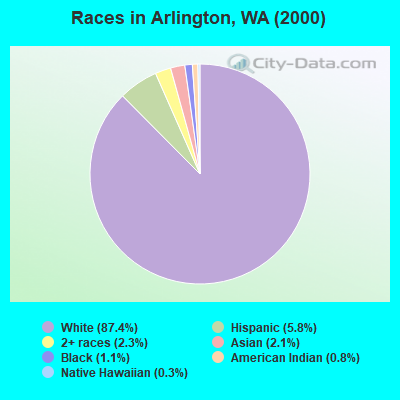
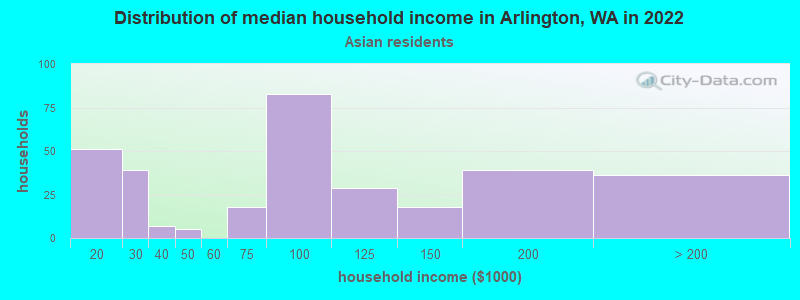
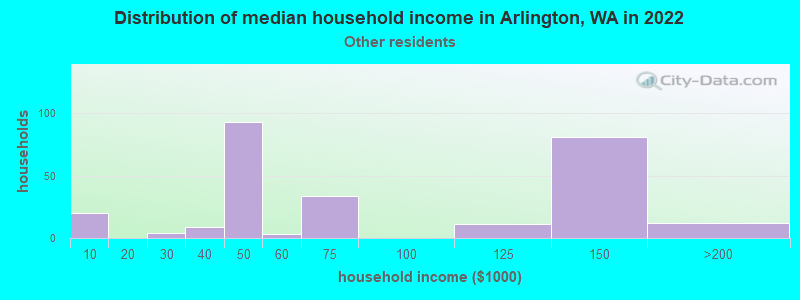
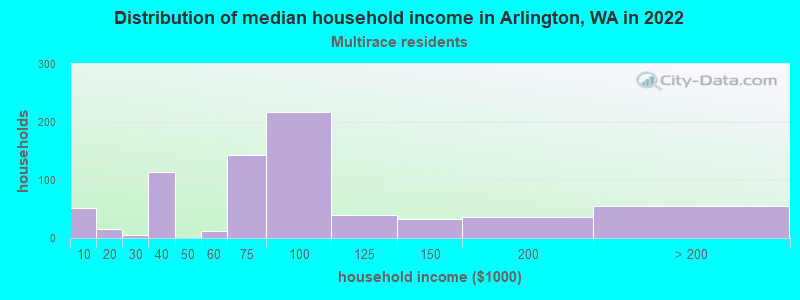
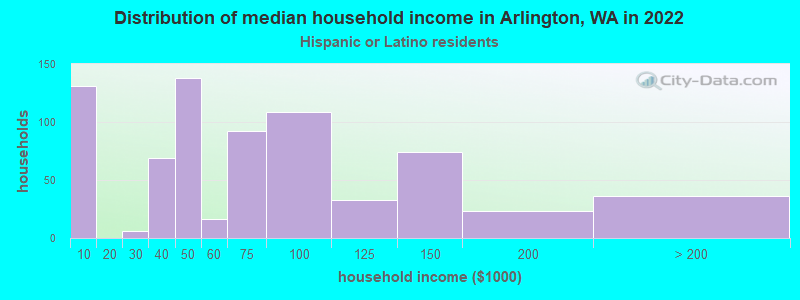
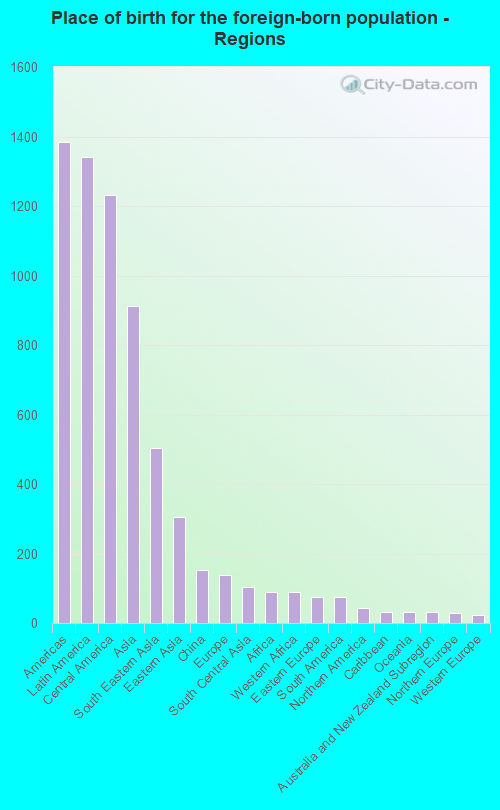
According to 2022 data, the most numerous races in Arlington, WA are White alone (14,092 residents), Hispanic (3,145 residents), and Asian alone (1,309 residents). 83.2% of Arlington residents speak English at home. 12.4% of Arlington, WA residents are foreign-born (6.4% born in Latin America, 4.3% born in Asia), which is 20.6% less than the foreign-born rate of 15.0% across the entire state of Washington.
Race distribution in Arlington
2000 2022
4,652,490 78.9% White alone 441,509 7.5% Hispanic 319,401 5.4% Asian alone 184,631 3.1% Black alone 175,926 3.0% Two or more races 85,396 1.4% American Indian alone 22,779 0.4% Native Hawaiian and Other 11,989 0.2% Other race alone
4,941,456 63.5% White alone 1,093,313 14.0% Hispanic 755,832 9.7% Asian alone 523,448 6.7% Two or more races 299,537 3.8% Black alone 69,024 0.9% American Indian alone 52,231 0.7% Native Hawaiian and Other 50,945 0.7% Other race alone
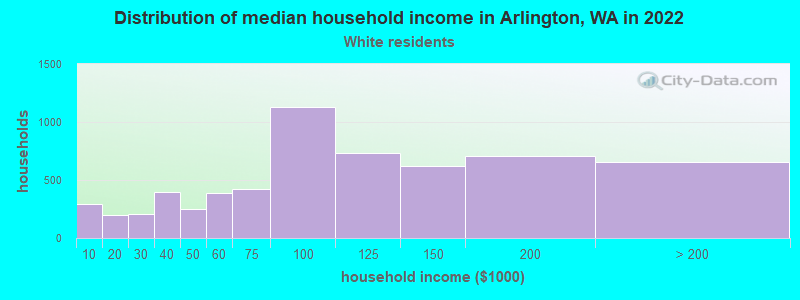
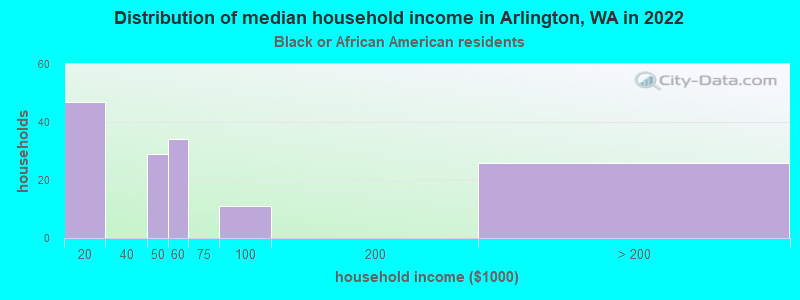
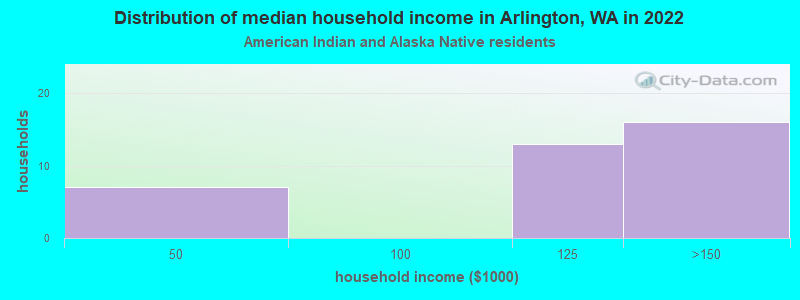
Income and house value in Arlington Median household income in 2022 $92,923 White non-Hispanic householders$46,209 Black householders$130,298 American Indian and Alaska Native householders$43,886 Some other race householders$81,015 Two or more races householders$54,555 Hispanic or Latino race householdersMedian 2022 house value $554,990 White Non-Hispanic householders$601,507 Black or African American householders$521,306 American Indian or Alaska Native householders $721,808 Asian householders$721,808 Native Hawaiian and other Pacific Islander householders$373,094 Two or more races householders$626,529 Hispanic or Latino householders
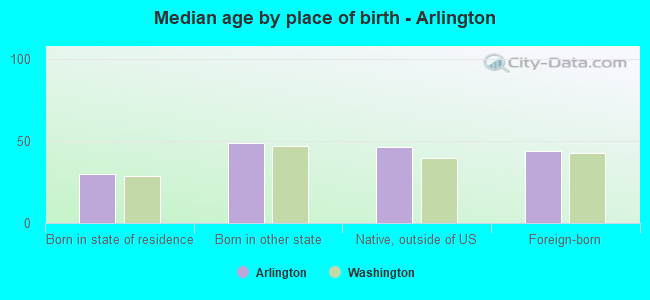
Median age by race in Arlington
38.6 Median age for White residents37.7 40.2 38.6 Median age for Black or African American residents36.4 53.1 21.9 Median age for American Indian / Alaska Native residents31.9 19.6 43.8 Median age for Asian residents43.1 45.5 -677,839,850.3 Median age for Native Hawaiian / Pacific Islander residents-661,202,185.1 -844,317,095.6 32.4 Median age for Other race residents16.0 37.1 27.7 Median age for Two or more races residents40.1 22.5 39.8 Median age for White alone residents37.9 41.0 27.0 Median age for Hispanic or Latino residents21.5 30.9
Owner/renter occupied households by race in Arlington
House owners and renters - White residents 3,904 64.9% Owner occupied2,109 35.1% Renter occupiedHouse owners and renters - Black or African American residents 36 22.7% Owner occupied121 77.3% Renter occupiedHouse owners and renters - American Indian / Alaska Native residents 21 67.3% Owner occupied10 32.7% Renter occupiedHouse owners and renters - Asian residents 368 86.6% Owner occupied57 13.4% Renter occupiedHouse owners and renters - Native Hawaiian / Pacific Islander residents 38 100.0% Owner occupiedHouse owners and renters - Other race residents 217 73.9% Owner occupied77 26.1% Renter occupiedHouse owners and renters - Two or more races residents 470 64.9% Owner occupied254 35.1% Renter occupiedHouse owners and renters - White alone residents 3,885 65.7% Owner occupied2,031 34.3% Renter occupiedHouse owners and renters - Hispanic or Latino residents 371 53.3% Owner occupied325 46.7% Renter occupied
Language usage in Arlington
English speakers - Total 83.2% of residents of Arlington speak English at home.
10.2% of residents speak Spanish at home 742 37.8% Speak English very well1,221 62.2% Speak English less than very well6.6% of residents speak other language at home 1,058 83.5% Speak English very well209 16.5% Speak English less than very well
English speakers - Born in the United States 94.9% of residents of Arlington speak English at home.
3.1% of residents speak Spanish at home 125 69.1% Speak English very well56 30.9% Speak English less than very well2.0% of residents speak other language at home 119 100.0% Speak English very well
English speakers - Native, born elsewhere 76.8% of residents of Arlington speak English at home.
11.8% of residents speak Spanish at home 36 100.0% Speak English less than very well12.7% of residents speak other language at home 39 100.0% Speak English very well
English speakers - Foreign-born 12.7% of residents of Arlington speak English at home.
48.8% of residents speak Spanish at home 254 20.3% Speak English very well996 79.7% Speak English less than very well36.1% of residents speak other language at home 730 78.9% Speak English very well195 21.1% Speak English less than very well
White (Caucasian) - Speak only English Native:
97.0% (13,176)Foreign-born:
23.2% (97)
White (Caucasian) - Speak another language Native:
3.1% (421)Foreign-born:
76.4% (321)
Black or African American - Speak another language Native:
0.3% (1)Foreign-born:
82.3% (75)
Asian - Speak only English Native:
95.6% (284)Foreign-born:
7.8% (72)
Asian - Speak another language Native:
3.7% (11)Foreign-born:
91.3% (848)
Other race - Speak only English Native:
50.6% (282)Foreign-born:
2.9% (24)
Other race - Speak another language Native:
46.9% (262)Foreign-born:
94.5% (774)
Two or more races - Speak only English Native:
78.6% (1,296)Foreign-born:
30.1% (117)
Two or more races - Speak another language Native:
19.9% (328)Foreign-born:
72.3% (281)
White alone - Speak only English Native:
98.2% (12,806)Foreign-born:
48.8% (98)
White alone - Speak another language Native:
1.8% (240)Foreign-born:
48.9% (98)
Hispanic or Latino - Speak only English Native:
64.7% (1,092)Foreign-born:
8.8% (113)
Hispanic or Latino - Speak another language Native:
35.7% (601)Foreign-born:
91.2% (1,175)
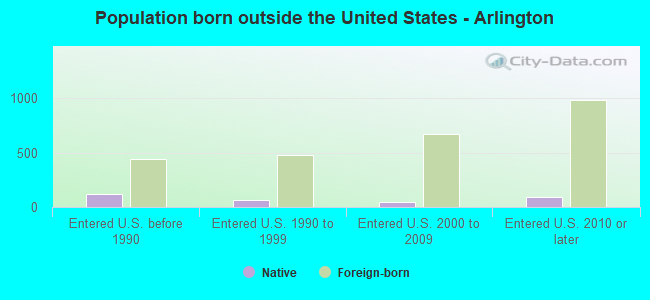
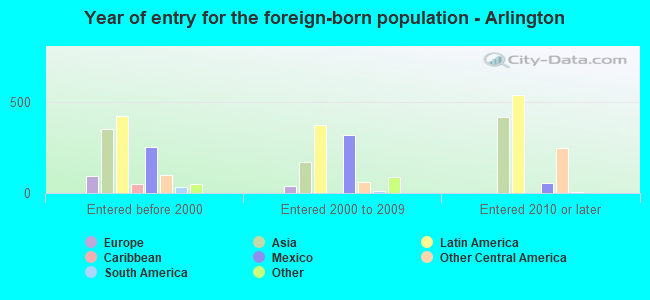
Foreign-born residents in Arlington 2,556 residents are foreign born (6.4% Latin America , 4.3% Asia ).
This city:
12.4%Washington:
14.9%
Marital status for residents in Arlington Marital status - White (Caucasian) population 15 years and over
Males 25.7% Never married58.8% Now married1.8% Separated2.8% Widowed10.9% DivorcedFemales 24.0% Never married49.8% Now married1.5% Separated9.5% Widowed15.2% DivorcedWomen who gave birth in the past 12 months Now married:
88.8% (209)Unmarried:
11.2% (26)
Women who did not give birth in the past 12 months Now married:
50.5% (1,697)Unmarried:
49.5% (1,662)
Marital status - Black or African American population 15 years and over
Males 44.0% Never married56.0% Now married0.0% Separated0.0% Widowed0.0% DivorcedFemales 19.9% Never married24.0% Now married0.0% Separated0.0% Widowed56.2% DivorcedWomen who did not give birth in the past 12 months Now married:
31.0% (15)Unmarried:
69.0% (33)
Marital status - American Indian / Alaska Native population 15 years and over
Males 44.4% Never married13.3% Now married0.0% Separated26.7% Widowed15.6% DivorcedFemales 70.0% Never married0.0% Now married0.0% Separated30.0% Widowed0.0% DivorcedWomen who did not give birth in the past 12 months Now married:
0.0% (0)Unmarried:
100.0% (41)
Marital status - Asian population 15 years and over
Males 22.0% Never married70.6% Now married0.0% Separated0.0% Widowed7.4% DivorcedFemales 13.4% Never married57.3% Now married0.0% Separated19.3% Widowed10.0% DivorcedWomen who gave birth in the past 12 months Now married:
100.0% (15)Unmarried:
0.0% (0)
Women who did not give birth in the past 12 months Now married:
63.0% (259)Unmarried:
37.0% (152)
Marital status - Other race population 15 years and over
Males 57.3% Never married40.2% Now married0.0% Separated0.0% Widowed2.5% DivorcedFemales 36.3% Never married28.9% Now married27.2% Separated4.1% Widowed3.6% DivorcedWomen who did not give birth in the past 12 months Now married:
28.0% (86)Unmarried:
72.0% (221)
Marital status - Two or more races population 15 years and over
Males 35.7% Never married34.8% Now married0.0% Separated2.7% Widowed26.7% DivorcedFemales 36.4% Never married47.5% Now married3.1% Separated1.2% Widowed11.8% DivorcedWomen who gave birth in the past 12 months Now married:
0.0% (0)Unmarried:
100.0% (33)
Women who did not give birth in the past 12 months Now married:
50.2% (257)Unmarried:
49.8% (255)
Marital status - White alone, not Hispanic / Latino population 15 years and over
Males 25.6% Never married58.6% Now married1.8% Separated2.9% Widowed11.1% DivorcedFemales 23.2% Never married49.6% Now married1.0% Separated10.1% Widowed16.1% DivorcedWomen who gave birth in the past 12 months Now married:
88.8% (214)Unmarried:
11.2% (27)
Women who did not give birth in the past 12 months Now married:
49.7% (1,537)Unmarried:
50.3% (1,558)
Marital status - Hispanic or Latino population 15 years and over
Males 31.9% Never married46.8% Now married0.0% Separated2.4% Widowed18.8% DivorcedFemales 36.4% Never married43.5% Now married13.9% Separated1.4% Widowed4.8% DivorcedWomen who gave birth in the past 12 months Now married:
0.0% (0)Unmarried:
100.0% (32)
Women who did not give birth in the past 12 months Now married:
48.6% (404)Unmarried:
51.4% (428)
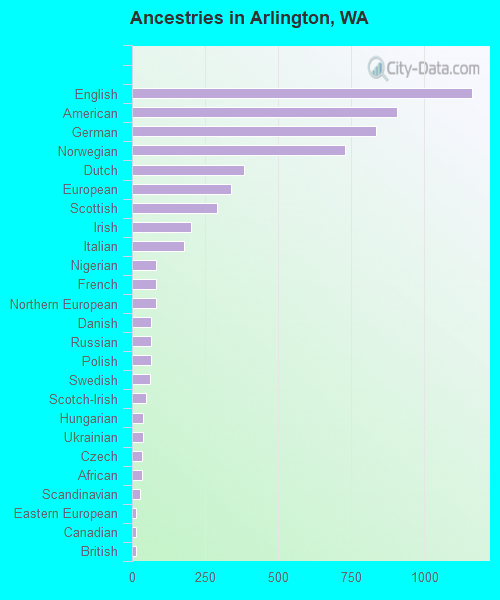
Ancestries in Arlington
1,164 13.4% English908 10.4% American835 9.6% German728 8.4% Norwegian384 4.4% Dutch340 3.9% European292 3.4% Scottish201 2.3% Irish177 2.0% Italian83 1.0% Nigerian81 0.9% French81 0.9% Northern European65 0.7% Danish65 0.7% Russian64 0.7% Polish62 0.7% Swedish48 0.6% Scotch-Irish39 0.4% Hungarian38 0.4% Ukrainian35 0.4% Czech35 0.4% African26 0.3% Scandinavian14 0.2% Eastern European13 0.1% Canadian12 0.1% British12 0.1% Welsh9 0.1% Finnish9 0.1% Slavic2 0.02% Afghan
Geographical mobility in Arlington Same house 1 year ago 12,293 84.6% White (Caucasian)164 46.6% Black or African American149 100.0% American Indian / Alaska Native1,094 85.3% Asian75 100.0% Native Hawaiian / Pacific Islander1,328 91.9% Other race1,989 87.0% Two or more races11,677 84.3% White alone, not Hispanic / Latino2,878 90.8% Hispanic or LatinoMoved within same county 1,367 9.4% White / Caucasian204 58.0% Black or African American61 4.2% Other race113 4.9% Two or more races1,396 10.1% White alone, not Hispanic / Latino54 1.7% Hispanic or LatinoMoved within same state 369 2.5% White / Caucasian11 0.8% Asian14 0.9% Other race36 1.6% Two or more races305 2.2% White alone, not Hispanic / Latino106 3.4% Hispanic or LatinoMoved from different state 343 2.4% White / Caucasian30 8.4% Black or African American67 5.2% Asian39 2.7% Other race139 6.1% Two or more races288 2.1% White alone, not Hispanic / Latino134 4.2% Hispanic or LatinoMoved from abroad 20 0.1% White87 6.8% Asian18 0.8% Two or more races21 0.1% White alone, not Hispanic / Latino44 1.4% Hispanic or Latino
Children Nativity (place of birth) in Arlington
Children under 6 years - Living with two parents Both parents native 1,097 100.0% NativeBoth parents foreign-born 106 84.8% Native19 15.2% Foreign-bornOne native, one foreign-born parent 62 95.4% Native3 4.6% Foreign-bornChildren under 6 years - Living with one parent Native parent 171 100.0% NativeForeign-born parent 13 100.0% NativeChildren 6 to 17 years - Living with two parents Both parents native 1,485 100.0% NativeBoth parents foreign-born 418 83.0% Native86 17.0% Foreign-bornOne native, one foreign-born parent 282 96.7% Native10 3.3% Foreign-bornChildren 6 to 17 years - Living with one parent Native parent 497 79.0% Native132 21.0% Foreign-bornForeign-born parent 388 77.2% Native115 22.8% Foreign-born
Grandparents responsible for own grandchildren in Arlington
Grandparents (30 to 59 years) White / Caucasian 4 2.6% Responsible for grandchildren139 97.4% Not responsible for grandchildrenAmerican Indian / Alaska Native 3 100.0% Not responsible for grandchildrenAsian 22 100.0% Not responsible for grandchildrenNative Hawaiian / Pacific Islander 18 100.0% Not responsible for grandchildrenOther race 49 100.0% Responsible for grandchildrenTwo or more races 22 100.0% Not responsible for grandchildrenWhite alone, not Hispanic / Latino 4 2.7% Responsible for grandchildren147 97.3% Not responsible for grandchildrenHispanic or Latino 67 77.6% Responsible for grandchildren19 22.4% Not responsible for grandchildrenGrandparents (60 years and over) White / Caucasian 16 8.8% Responsible for grandchildren167 91.2% Not responsible for grandchildrenOther race 38 92.8% Responsible for grandchildren3 7.2% Not responsible for grandchildrenTwo or more races 31 100.0% Not responsible for grandchildrenWhite alone, not Hispanic / Latino 16 8.5% Responsible for grandchildren174 91.5% Not responsible for grandchildrenHispanic or Latino 34 57.6% Responsible for grandchildren25 42.4% Not responsible for grandchildren