Races in Artondale, Washington (WA) Detailed Stats
Ancestries, Foreign-born residents, place of birth
Settings
X


Recent posts about races in Artondale, Washington on our local forum with over 2,400,000 registered users:
 | Thoughts on crime in western WA (Kitsap/Mason/(north)Pierce) (35 replies) |
| Best elementary and middle schools in gig harbor (3 replies) |
| Gig Harbor to Tacoma new commute time (5 replies) |
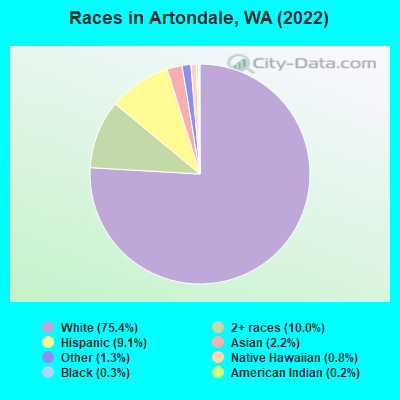
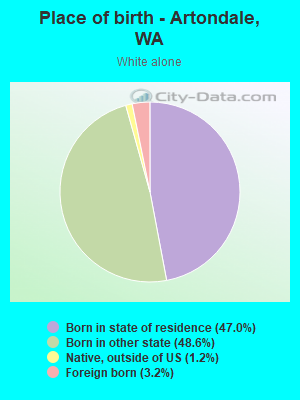
According to 2022 data, the most numerous races in Artondale, WA are White alone (10,551 residents), Hispanic (1,271 residents), and Asian alone (314 residents). 94.3% of Artondale residents speak English at home. 5.3% of Artondale, WA residents are foreign-born (1.6% born in Asia, 1.5% born in Europe, 1.4% born in Latin America), which is 185.1% less than the foreign-born rate of 15.0% across the entire state of Washington.
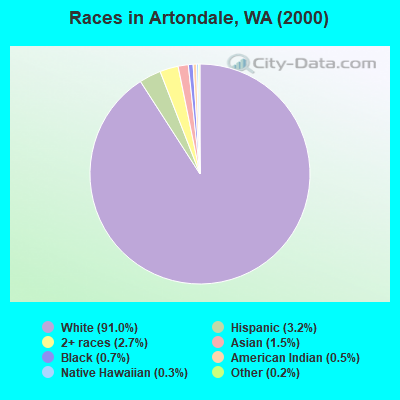
Race distribution in Artondale
2000
2022

- 7,85691.0%White alone
- 2723.2%Hispanic
- 2322.7%Two or more races
- 1271.5%Asian alone
- 590.7%Black alone
- 420.5%American Indian alone
- 240.3%Native Hawaiian and Other
Pacific Islander alone - 180.2%Other race alone
-
- 10,55175.4%White alone
- 1,39910.0%Two or more races
- 1,2719.1%Hispanic
- 3142.2%Asian alone
- 1861.3%Other race alone
- 1120.8%Native Hawaiian and Other
Pacific Islander alone - 440.3%Black alone
- 230.2%American Indian alone
2000
2022
-
- 4,652,49078.9%White alone
- 441,5097.5%Hispanic
- 319,4015.4%Asian alone
- 184,6313.1%Black alone
- 175,9263.0%Two or more races
- 85,3961.4%American Indian alone
- 22,7790.4%Native Hawaiian and Other
Pacific Islander alone - 11,9890.2%Other race alone

-
- 4,941,45663.5%White alone
- 1,093,31314.0%Hispanic
- 755,8329.7%Asian alone
- 523,4486.7%Two or more races
- 299,5373.8%Black alone
- 69,0240.9%American Indian alone
- 52,2310.7%Native Hawaiian and Other
Pacific Islander alone - 50,9450.7%Other race alone

Income and house value in Artondale
- Median household income in 2022
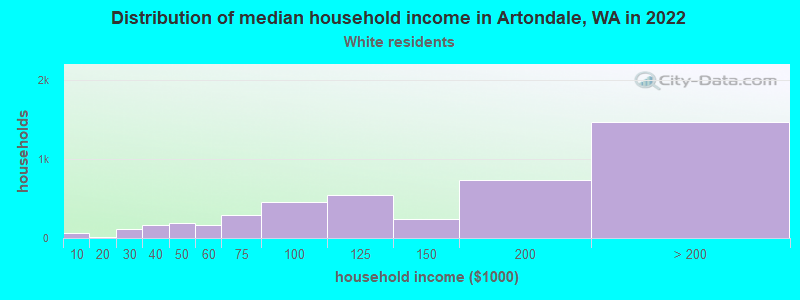
- $145,335White non-Hispanic householders
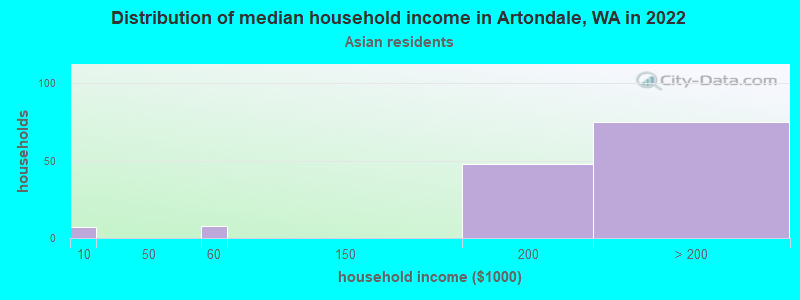
- over $200,000Asian householders
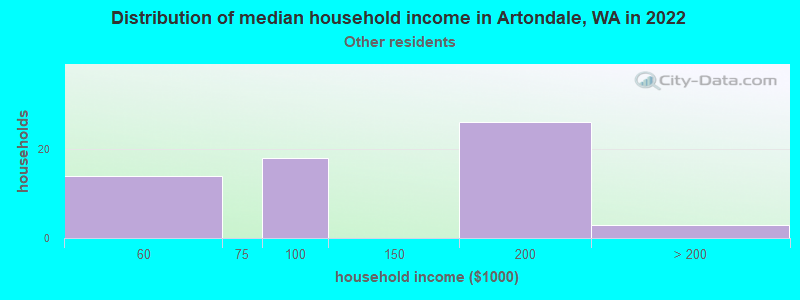
- $92,537Some other race householders
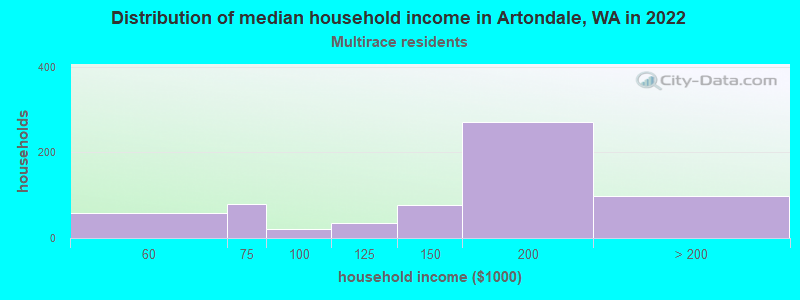
- $188,184Two or more races householders
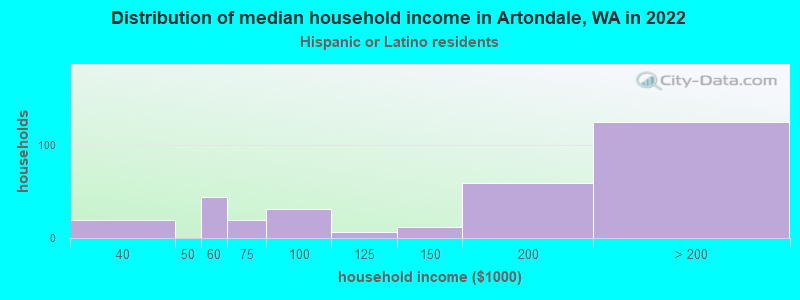
- $176,207Hispanic or Latino race householders
- Median 2022 house value
- $844,313White Non-Hispanic householders
- over $1,000,000Black or African American householders
- $676,910American Indian or Alaska Native householders
- $703,675Asian householders
- over $1,000,000Native Hawaiian and other Pacific Islander householders
- $837,986Some other race householders
- $712,921Two or more races householders
- $803,435Hispanic or Latino householders
Household income for White non-Hispanic householders
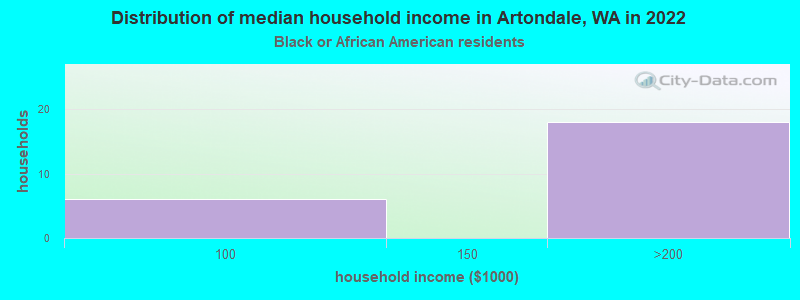
Household income for Black householders
Household income for Asian householders
Household income for Native Hawaiian and other Pacific Islander householders

Household income for Some other race householders
Household income for Two or more races householders
Household income for Hispanic or Latino race householders
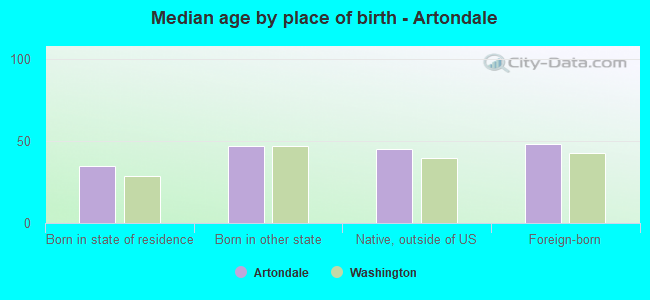
Median age by race in Artondale
- 45.0Median age for White residents
- 45.4Males
- 44.4Females
- 56.4Median age for Black or African American residents
- -707,722,384.4Males
- 65.8Females
- 48.4Median age for American Indian / Alaska Native residents
- -622,057,000.6Males
- 46.4Females
- 43.3Median age for Asian residents
- 40.3Males
- 48.1Females
- 46.9Median age for Native Hawaiian / Pacific Islander residents
- 50.6Males
- 20.8Females
- 40.2Median age for Other race residents
- 35.5Males
- 45.3Females
- 31.5Median age for Two or more races residents
- 24.9Males
- 39.9Females
- 46.7Median age for White alone residents
- 47.2Males
- 46.5Females
- 30.3Median age for Hispanic or Latino residents
- 21.8Males
- 35.7Females
Owner/renter occupied households by race in Artondale
- House owners and renters - White residents
- 3,86289.7%Owner occupied
- 44410.3%Renter occupied
- House owners and renters - Black or African American residents
- 24100.0%Owner occupied
- House owners and renters - Asian residents
- 126100.0%Owner occupied
- House owners and renters - Native Hawaiian / Pacific Islander residents
- 21100.0%Owner occupied
- House owners and renters - Other race residents
- 79100.0%Owner occupied
- House owners and renters - Two or more races residents
- 51381.9%Owner occupied
- 11318.1%Renter occupied
- House owners and renters - White alone residents
- 3,75189.3%Owner occupied
- 45110.7%Renter occupied
- House owners and renters - Hispanic or Latino residents
- 27593.2%Owner occupied
- 206.8%Renter occupied
Language usage in Artondale
- English speakers - Total
- 94.3% of residents of Artondale speak English at home.
- 2.1% of residents speak Spanish at home
- 20776.7%Speak English very well
- 6323.3%Speak English less than very well
- 3.2% of residents speak other language at home
- 33579.0%Speak English very well
- 8921.0%Speak English less than very well
- English speakers - Born in the United States
- 97.3% of residents of Artondale speak English at home.
- 2.2% of residents speak Spanish at home
- 12792.0%Speak English very well
- 118.0%Speak English less than very well
- 0.4% of residents speak other language at home
- 1875.0%Speak English very well
- 625.0%Speak English less than very well
- English speakers - Native, born elsewhere
- 77.3% of residents of Artondale speak English at home.
- 6.5% of residents speak Spanish at home
- 22100.0%Speak English very well
- 18.3% of residents speak other language at home
- 4064.5%Speak English very well
- 2235.5%Speak English less than very well
- English speakers - Foreign-born
- 50.5% of residents of Artondale speak English at home.
- 13.2% of residents speak Spanish at home
- 4848.0%Speak English very well
- 5252.0%Speak English less than very well
- 32.8% of residents speak other language at home
- 18674.7%Speak English very well
- 6325.3%Speak English less than very well
White (Caucasian) - Speak only English
| Native: | 99.3% (9,882) |
| Foreign-born: | 56.1% (235) |
White (Caucasian) - Speak another language
| Native: | 1.3% (133) |
| Foreign-born: | 38.6% (162) |
Asian - Speak only English
| Native: | 100.0% (134) |
| Foreign-born: | 58.7% (132) |
Asian - Speak another language
| Native: | 2.7% (4) |
| Foreign-born: | 51.8% (116) |
Other race - Speak only English
| Native: | 96.7% (204) |
| Foreign-born: | 49.4% (8) |
Other race - Speak another language
| Native: | 5.3% (11) |
| Foreign-born: | 54.4% (8) |
Two or more races - Speak another language
| Native: | 7.3% (129) |
| Foreign-born: | 100.0% (66) |
White alone - Speak only English
| Native: | 99.3% (9,515) |
| Foreign-born: | 50.6% (169) |
White alone - Speak another language
| Native: | 1.0% (96) |
| Foreign-born: | 41.8% (140) |
Hispanic or Latino - Speak only English
| Native: | 90.6% (918) |
| Foreign-born: | 36.7% (81) |
Hispanic or Latino - Speak another language
| Native: | 12.3% (124) |
| Foreign-born: | 56.3% (124) |
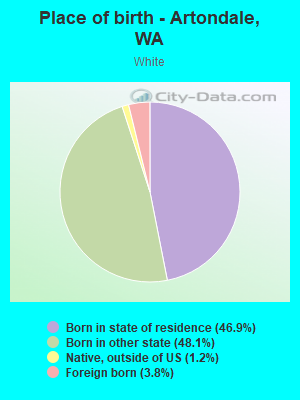
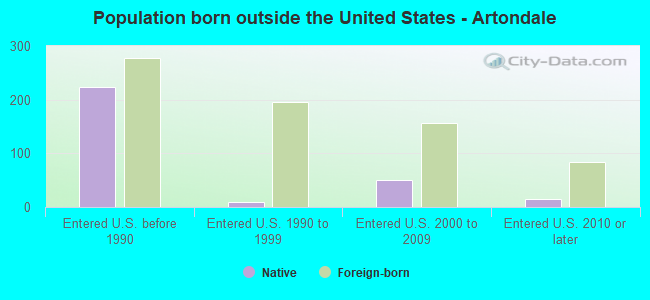
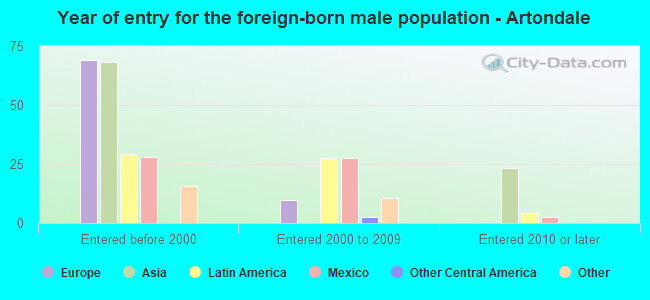
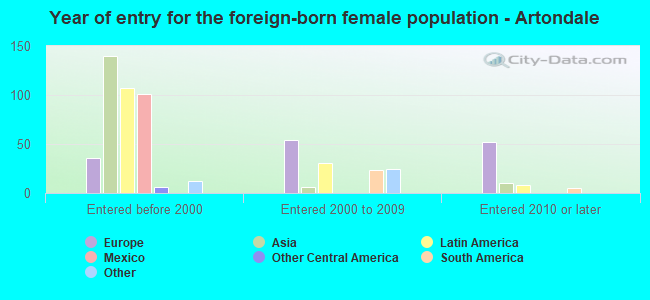
Foreign-born residents in Artondale
736 residents are foreign born (1.6% Asia, 1.5% Europe, 1.4% Latin America).
| This city: | 5.3% |
| Washington: | 14.9% |
Marital status for residents in Artondale
Marital status - White (Caucasian) population 15 years and over
- Males
- 17.8%Never married
- 72.5%Now married
- 0.3%Separated
- 1.7%Widowed
- 7.7%Divorced
- Females
- 15.3%Never married
- 70.0%Now married
- 0.6%Separated
- 5.7%Widowed
- 8.5%Divorced
Women who gave birth in the past 12 months
| Now married: | 96.1% (93) |
| Unmarried: | 3.9% (4) |
Women who did not give birth in the past 12 months
| Now married: | 65.4% (1,403) |
| Unmarried: | 34.6% (742) |
Marital status - Black or African American population 15 years and over
- Males
- 10.0%Never married
- 90.0%Now married
- 0.0%Separated
- 0.0%Widowed
- 0.0%Divorced
- Females
- 4.2%Never married
- 95.8%Now married
- 0.0%Separated
- 0.0%Widowed
- 0.0%Divorced
Women who did not give birth in the past 12 months
| Now married: | 83.3% (5) |
| Unmarried: | 16.7% (1) |
Marital status - American Indian / Alaska Native population 15 years and over
- Males
- 0.0%Never married
- 100.0%Now married
- 0.0%Separated
- 0.0%Widowed
- 0.0%Divorced
- Females
- 0.0%Never married
- 100.0%Now married
- 0.0%Separated
- 0.0%Widowed
- 0.0%Divorced
Marital status - Asian population 15 years and over
- Males
- 39.1%Never married
- 60.9%Now married
- 0.0%Separated
- 0.0%Widowed
- 0.0%Divorced
- Females
- 11.4%Never married
- 83.2%Now married
- 0.0%Separated
- 5.4%Widowed
- 0.0%Divorced
Women who did not give birth in the past 12 months
| Now married: | 82.9% (106) |
| Unmarried: | 17.1% (22) |
Marital status - Native Hawaiian / Pacific Islander population 15 years and over
- Males
- 64.8%Never married
- 33.3%Now married
- 0.0%Separated
- 0.0%Widowed
- 1.9%Divorced
- Females
- 51.1%Never married
- 48.9%Now married
- 0.0%Separated
- 0.0%Widowed
- 0.0%Divorced
Women who did not give birth in the past 12 months
| Now married: | 0.0% (0) |
| Unmarried: | 100.0% (27) |
Marital status - Other race population 15 years and over
- Males
- 36.6%Never married
- 58.4%Now married
- 0.0%Separated
- 5.0%Widowed
- 0.0%Divorced
- Females
- 28.2%Never married
- 71.8%Now married
- 0.0%Separated
- 0.0%Widowed
- 0.0%Divorced
Women who did not give birth in the past 12 months
| Now married: | 81.8% (29) |
| Unmarried: | 18.2% (7) |
Marital status - Two or more races population 15 years and over
- Males
- 32.0%Never married
- 64.0%Now married
- 0.0%Separated
- 0.0%Widowed
- 4.1%Divorced
- Females
- 17.4%Never married
- 48.2%Now married
- 0.0%Separated
- 0.0%Widowed
- 34.3%Divorced
Women who did not give birth in the past 12 months
| Now married: | 65.7% (270) |
| Unmarried: | 34.3% (141) |
Marital status - White alone, not Hispanic / Latino population 15 years and over
- Males
- 15.9%Never married
- 73.9%Now married
- 0.3%Separated
- 1.8%Widowed
- 8.2%Divorced
- Females
- 14.3%Never married
- 70.8%Now married
- 0.6%Separated
- 5.5%Widowed
- 8.9%Divorced
Women who gave birth in the past 12 months
| Now married: | 96.1% (96) |
| Unmarried: | 3.9% (4) |
Women who did not give birth in the past 12 months
| Now married: | 66.5% (1,353) |
| Unmarried: | 33.5% (683) |
Marital status - Hispanic or Latino population 15 years and over
- Males
- 42.8%Never married
- 56.0%Now married
- 0.0%Separated
- 1.2%Widowed
- 0.0%Divorced
- Females
- 32.5%Never married
- 58.8%Now married
- 0.0%Separated
- 5.3%Widowed
- 3.4%Divorced
Women who did not give birth in the past 12 months
| Now married: | 51.7% (185) |
| Unmarried: | 48.3% (173) |
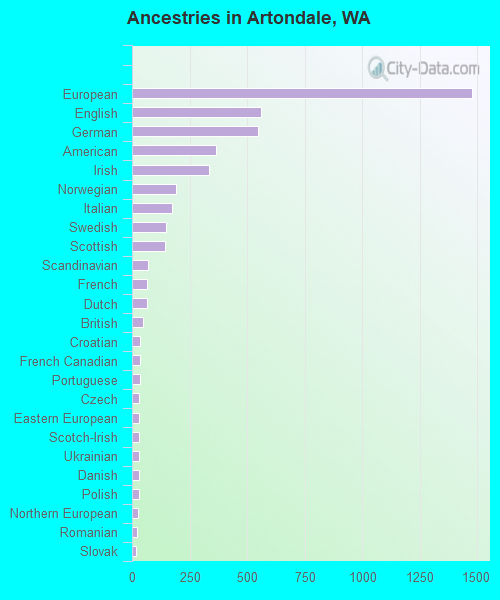
Ancestries in Artondale

- 1,47724.6%European
- 5609.3%English
- 5479.1%German
- 3676.1%American
- 3365.6%Irish
- 1913.2%Norwegian
- 1752.9%Italian
- 1482.5%Swedish
- 1442.4%Scottish
- 681.1%Scandinavian
- 671.1%French
- 631.0%Dutch
- 460.8%British
- 360.6%Croatian
- 360.6%French Canadian
- 330.5%Portuguese
- 310.5%Czech
- 310.5%Eastern European
- 300.5%Scotch-Irish
- 300.5%Ukrainian
- 290.5%Danish
- 290.5%Polish
- 260.4%Northern European
- 230.4%Romanian
- 180.3%Slovak
- 160.3%Greek
- 160.3%Swiss
- 140.2%Russian
- 120.2%Slavic
- 90.1%Brazilian
- 80.1%Canadian
- 70.1%Iranian
- 60.10%Belgian
- 20.03%Welsh
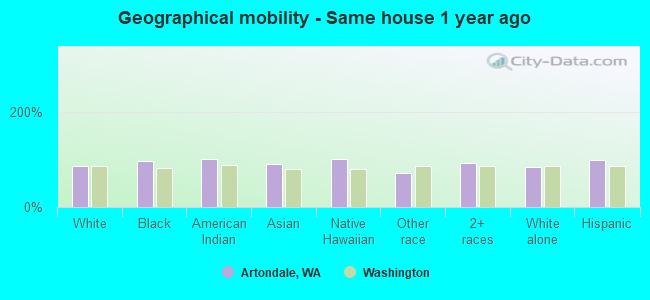
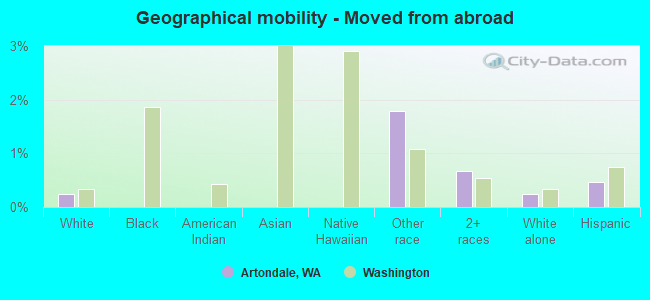
Geographical mobility in Artondale

- Same house 1 year ago
- 9,29185.1%White (Caucasian)
- 4396.4%Black or African American
- 42100.0%American Indian / Alaska Native
- 32689.7%Asian
- 107100.0%Native Hawaiian / Pacific Islander
- 15871.3%Other race
- 1,93892.2%Two or more races
- 8,84784.2%White alone, not Hispanic / Latino
- 1,25197.9%Hispanic or Latino
-
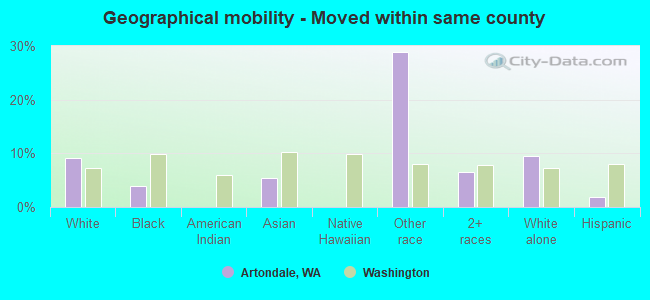
- Moved within same county
- 9989.1%White / Caucasian
- 23.9%Black or African American
- 195.4%Asian
- 6428.9%Other race
- 1376.5%Two or more races
- 9969.5%White alone, not Hispanic / Latino
- 241.9%Hispanic or Latino
-
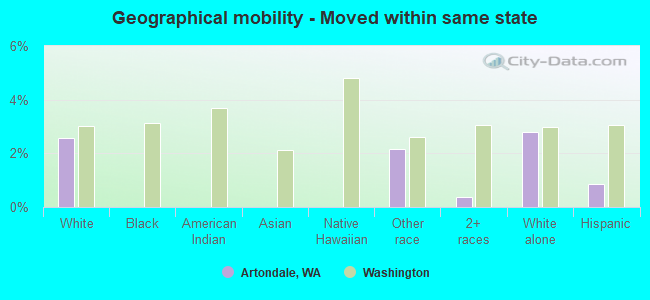
- Moved within same state
- 2822.6%White / Caucasian
- 52.2%Other race
- 80.4%Two or more races
- 2952.8%White alone, not Hispanic / Latino
- 110.9%Hispanic or Latino
-
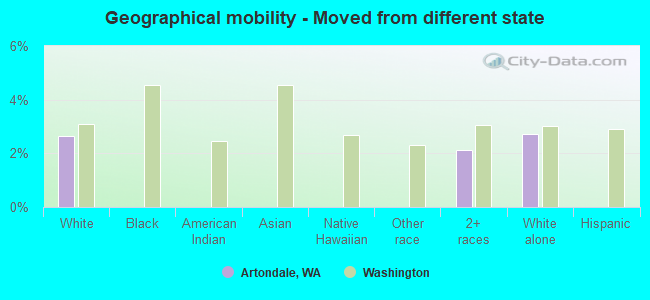
- Moved from different state
- 2902.7%White / Caucasian
- 452.1%Two or more races
- 2872.7%White alone, not Hispanic / Latino
-
- Moved from abroad
- 260.2%White
- 41.8%Other race
- 140.7%Two or more races
- 260.2%White alone, not Hispanic / Latino
- 60.5%Hispanic or Latino
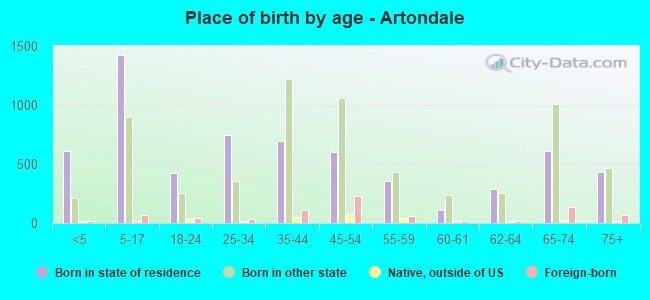
Children Nativity (place of birth) in Artondale
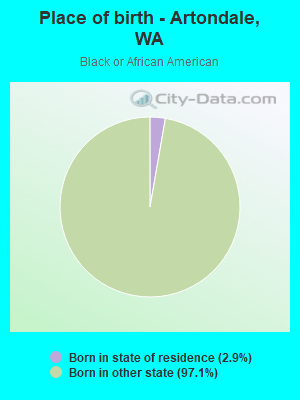
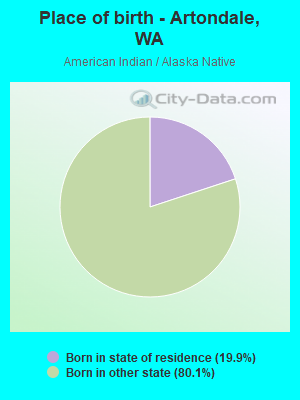
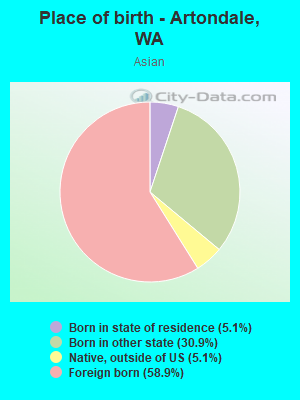
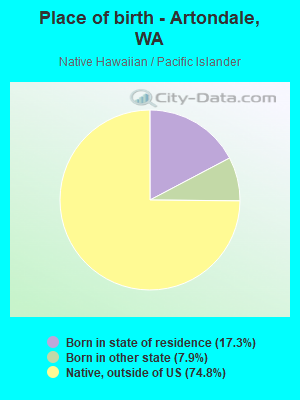
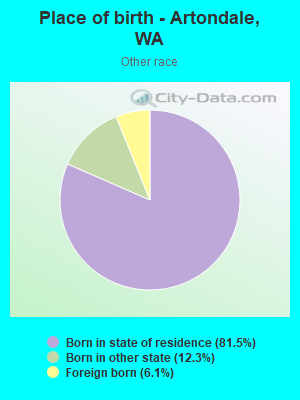
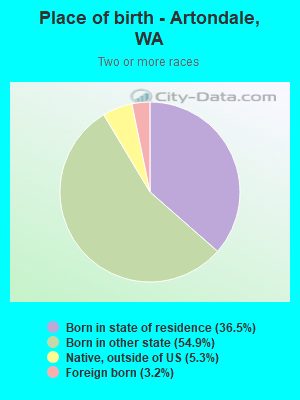
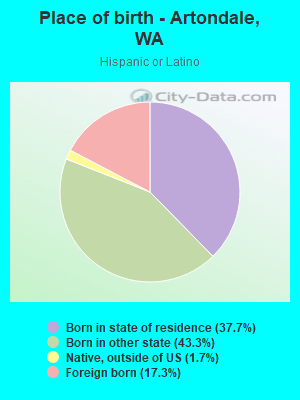
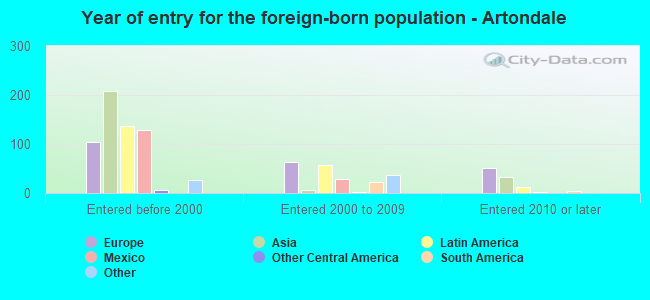
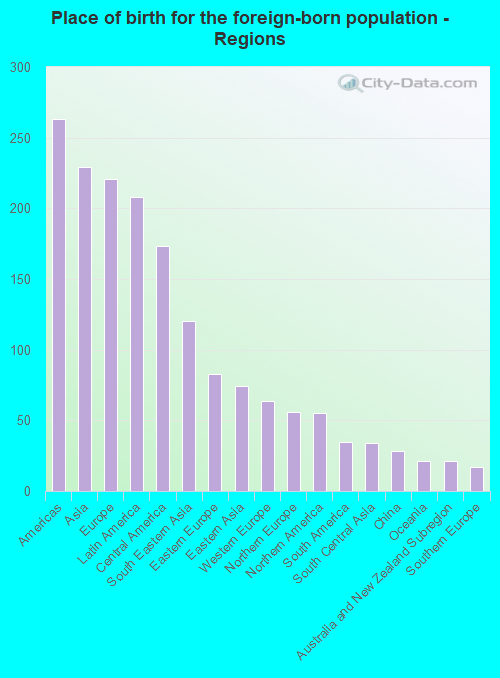
Place of birth for residents in Artondale
![Place of birth for the foreign-born population - Regions]()
- 263Americas
- 229Asia
- 221Europe
- 208Latin America
- 173Central America
- 120South Eastern Asia
- 83Eastern Europe
- 74Eastern Asia
- 64Western Europe
- 56Northern Europe
- 55Northern America
- 35South America
- 34South Central Asia
- 28China
- 21Oceania
- 21Australia and New Zealand Subregion
- 17Southern Europe
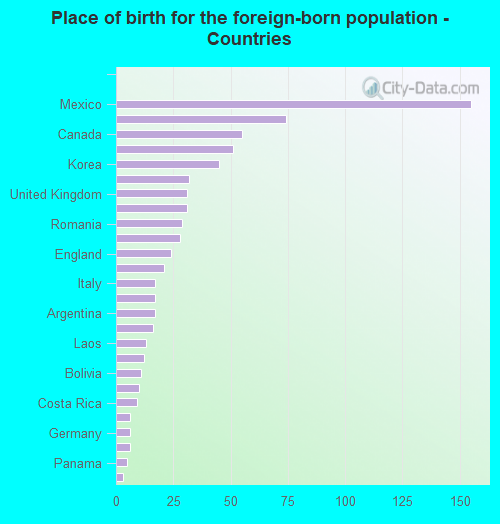
![Place of birth for the foreign-born population - Countries]()
- 155Mexico
- 74Vietnam
- 55Canada
- 51France
- 45Korea
- 32Philippines
- 31United Kingdom
- 31Ukraine
- 29Romania
- 28China
- 24England
- 21Australia
- 17Italy
- 17Iran
- 17Argentina
- 16India
- 13Laos
- 12Czechoslovakia
- 11Bolivia
- 10Russia
- 9Costa Rica
- 6Belgium
- 6Germany
- 6Brazil
- 5Panama
- 3Guatemala
- 1Japan
Grandparents responsible for own grandchildren in Artondale
Zip codes: 98335.