Races in Ashburn, Virginia (VA) Detailed Stats
Data:
Races - White alone (%)
Races - White alone (% change since 2000)
Races - Black alone (%)
Races - Black alone (% change since 2000)
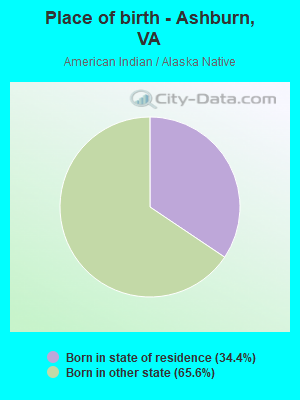
Races - American Indian alone (%)
Races - American Indian alone (% change since 2000)
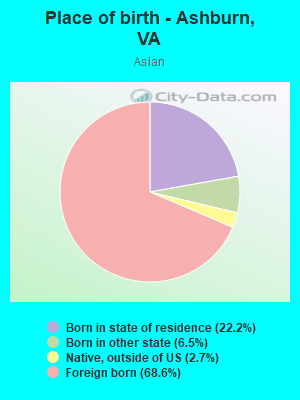
Races - Asian alone (%)
Races - Asian alone (% change since 2000)
Races - Hispanic (%)
Races - Hispanic (% change since 2000)
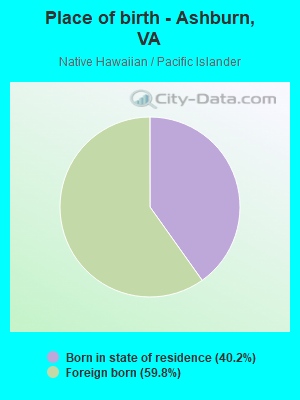
Races - Native Hawaiian and Other Pacific Islander alone (%)
Races - Native Hawaiian and Other Pacific Islander alone (% change since 2000)
Races - Two or more races(%)
Races - Two or more races(% change since 2000)
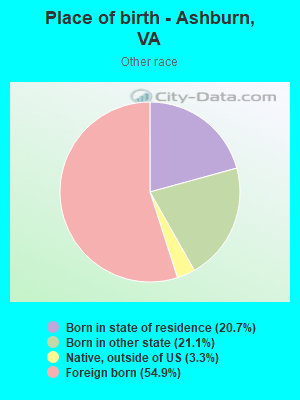
Races - Other race alone (%)
Races - Other race alone (% change since 2000)
Racial diversity
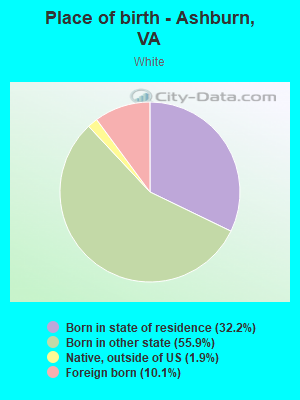
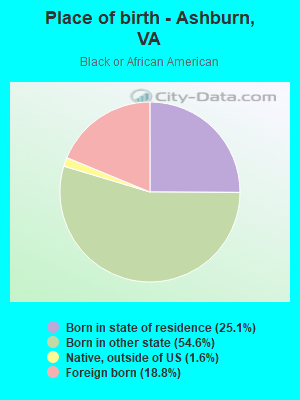
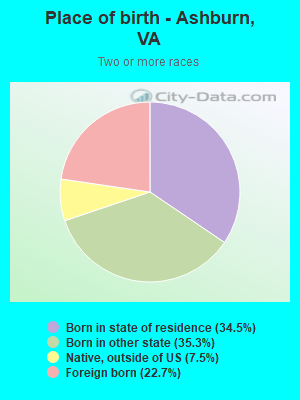
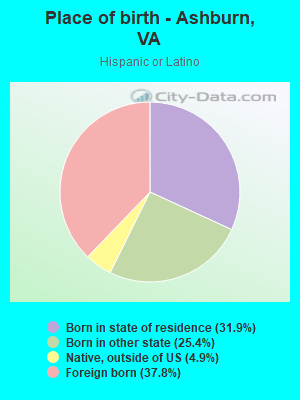
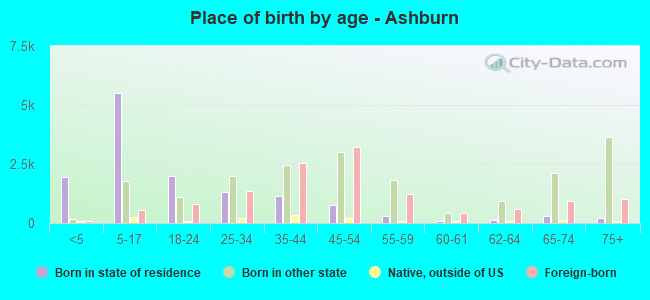
Place of birth - Born in state of residence (%)
Place of birth - Born in state of residence (%) - White
Place of birth - Born in state of residence (%) - Black or African American
Place of birth - Born in state of residence (%) - Asian
Place of birth - Born in state of residence (%) - Hispanic or Latino
Place of birth - Born in state of residence (%) - American Indian and Alaska Native
Place of birth - Born in state of residence (%) - Multirace
Place of birth - Born in state of residence (%) - Other Race
Place of birth - Born in other state (%)
Place of birth - Born in other state (%) - White
Place of birth - Born in other state (%) - Black or African American
Place of birth - Born in other state (%) - Asian
Place of birth - Born in other state (%) - Hispanic or Latino
Place of birth - Born in other state (%) - American Indian and Alaska Native
Place of birth - Born in other state (%) - Multirace
Place of birth - Born in other state (%) - Other Race
Place of birth - Native, outside of US (%)
Place of birth - Native, outside of US (%) - White
Place of birth - Native, outside of US (%) - Black or African American
Place of birth - Native, outside of US (%) - Asian
Place of birth - Native, outside of US (%) - Hispanic or Latino
Place of birth - Native, outside of US (%) - American Indian and Alaska Native
Place of birth - Native, outside of US (%) - Multirace
Place of birth - Native, outside of US (%) - Other Race
Place of birth - Foreign born (%)
Place of birth - Foreign born (%) - White
Place of birth - Foreign born (%) - Black or African American
Place of birth - Foreign born (%) - Asian
Place of birth - Foreign born (%) - Hispanic or Latino
Place of birth - Foreign born (%) - American Indian and Alaska Native
Place of birth - Foreign born (%) - Multirace
Place of birth - Foreign born (%) - Other Race
Residents speaking English at home (%)
Residents speaking English at home - Born in the United States (%)
Residents speaking English at home - Native, born elsewhere (%)
Residents speaking English at home - Foreign born (%)
Residents speaking Spanish at home (%)
Residents speaking Spanish at home - Born in the United States (%)
Residents speaking Spanish at home - Native, born elsewhere (%)
Residents speaking Spanish at home - Foreign born (%)
Residents speaking other language at home (%)
Residents speaking other language at home - Born in the United States (%)
Residents speaking other language at home - Native, born elsewhere (%)
Residents speaking other language at home - Foreign born (%)
Marital status - Never married (%)
Marital status - Now married (%)
Marital status - Separated (%)
Marital status - Widowed (%)
Marital status - Divorced (%)
Ancestries Reported - Arab (%)
Ancestries Reported - Czech (%)
Ancestries Reported - Danish (%)
Ancestries Reported - Dutch (%)
Ancestries Reported - English (%)
Ancestries Reported - French (%)
Ancestries Reported - French Canadian (%)
Ancestries Reported - German (%)
Ancestries Reported - Greek (%)
Ancestries Reported - Hungarian (%)
Ancestries Reported - Irish (%)
Ancestries Reported - Italian (%)
Ancestries Reported - Lithuanian (%)
Ancestries Reported - Norwegian (%)
Ancestries Reported - Polish (%)
Ancestries Reported - Portuguese (%)
Ancestries Reported - Russian (%)
Ancestries Reported - Scotch-Irish (%)
Ancestries Reported - Scottish (%)
Ancestries Reported - Slovak (%)
Ancestries Reported - Subsaharan African (%)
Ancestries Reported - Swedish (%)
Ancestries Reported - Swiss (%)
Ancestries Reported - Ukrainian (%)
Ancestries Reported - United States (%)
Ancestries Reported - Welsh (%)
Ancestries Reported - West Indian (%)
Ancestries Reported - Other (%)
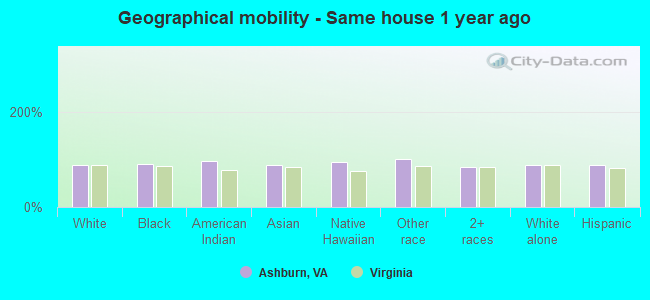
Geographical mobility - Same house 1 year ago (%)
Geographical mobility - Same house 1 year ago (%) - White
Geographical mobility - Same house 1 year ago (%) - Black or African American
Geographical mobility - Same house 1 year ago (%) - Asian
Geographical mobility - Same house 1 year ago (%) - Hispanic or Latino
Geographical mobility - Same house 1 year ago (%) - American Indian and Alaska Native
Geographical mobility - Same house 1 year ago (%) - Multirace
Geographical mobility - Same house 1 year ago (%) - Other Race
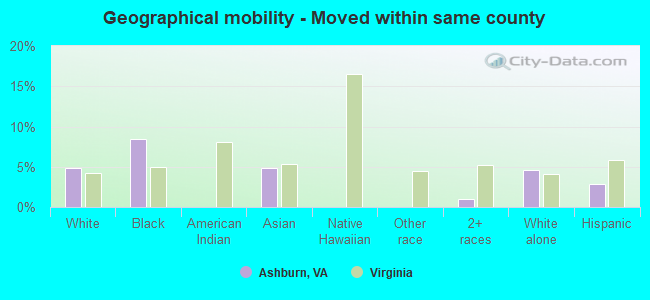
Geographical mobility - Moved within same county (%)
Geographical mobility - Moved within same county (%) - White
Geographical mobility - Moved within same county (%) - Black or African American
Geographical mobility - Moved within same county (%) - Asian
Geographical mobility - Moved within same county (%) - Hispanic or Latino
Geographical mobility - Moved within same county (%) - American Indian and Alaska Native
Geographical mobility - Moved within same county (%) - Multirace
Geographical mobility - Moved within same county (%) - Other Race
Geographical mobility - Moved from different county within same state (%)
Geographical mobility - Moved from different county within same state (%) - White
Geographical mobility - Moved from different county within same state (%) - Black or African American
Geographical mobility - Moved from different county within same state (%) - Asian
Geographical mobility - Moved from different county within same state (%) - Hispanic or Latino
Geographical mobility - Moved from different county within same state (%) - American Indian and Alaska Native
Geographical mobility - Moved from different county within same state (%) - Multirace
Geographical mobility - Moved from different county within same state (%) - Other Race
Geographical mobility - Moved from different state (%)
Geographical mobility - Moved from different state (%) - White
Geographical mobility - Moved from different state (%) - Black or African American
Geographical mobility - Moved from different state (%) - Asian
Geographical mobility - Moved from different state (%) - Hispanic or Latino
Geographical mobility - Moved from different state (%) - American Indian and Alaska Native
Geographical mobility - Moved from different state (%) - Multirace
Geographical mobility - Moved from different state (%) - Other Race
Geographical mobility - Moved from abroad (%)
Geographical mobility - Moved from abroad (%) - White
Geographical mobility - Moved from abroad (%) - Black or African American
Geographical mobility - Moved from abroad (%) - Asian
Geographical mobility - Moved from abroad (%) - Hispanic or Latino
Geographical mobility - Moved from abroad (%) - American Indian and Alaska Native
Geographical mobility - Moved from abroad (%) - Multirace
Geographical mobility - Moved from abroad (%) - Other Race
Place of birth for the foreign-born population - Ireland (%)
Place of birth for the foreign-born population - Denmark (%)
Place of birth for the foreign-born population - Norway (%)
Place of birth for the foreign-born population - Sweden (%)
Place of birth for the foreign-born population - United Kingdom (%)
Place of birth for the foreign-born population - England (%)
Place of birth for the foreign-born population - Scotland (%)
Place of birth for the foreign-born population - Other Northern Europe (%)
Place of birth for the foreign-born population - Austria (%)
Place of birth for the foreign-born population - Belgium (%)
Place of birth for the foreign-born population - France (%)
Place of birth for the foreign-born population - Germany (%)
Place of birth for the foreign-born population - Netherlands (%)
Place of birth for the foreign-born population - Switzerland (%)
Place of birth for the foreign-born population - Other Western Europe (%)
Place of birth for the foreign-born population - Greece (%)
Place of birth for the foreign-born population - Italy (%)
Place of birth for the foreign-born population - Portugal (%)
Place of birth for the foreign-born population - Spain (%)
Place of birth for the foreign-born population - Other Southern Europe (%)
Place of birth for the foreign-born population - Albania (%)
Place of birth for the foreign-born population - Belarus (%)
Place of birth for the foreign-born population - Bosnia and Herzegovina (%)
Place of birth for the foreign-born population - Bulgaria (%)
Place of birth for the foreign-born population - Croatia (%)
Place of birth for the foreign-born population - Czechoslovakia (%)
Place of birth for the foreign-born population - Hungary (%)
Place of birth for the foreign-born population - Latvia (%)
Place of birth for the foreign-born population - Lithuania (%)
Place of birth for the foreign-born population - North Macedonia (Macedonia) (%)
Place of birth for the foreign-born population - Moldova (%)
Place of birth for the foreign-born population - Poland (%)
Place of birth for the foreign-born population - Romania (%)
Place of birth for the foreign-born population - Russia (%)
Place of birth for the foreign-born population - Serbia (%)
Place of birth for the foreign-born population - Ukraine (%)
Place of birth for the foreign-born population - Other Eastern Europe (%)
Place of birth for the foreign-born population - China (%)
Place of birth for the foreign-born population - Hong Kong (%)
Place of birth for the foreign-born population - Taiwan (%)
Place of birth for the foreign-born population - Japan (%)
Place of birth for the foreign-born population - Korea (%)
Place of birth for the foreign-born population - Other Eastern Asia (%)
Place of birth for the foreign-born population - Afghanistan (%)
Place of birth for the foreign-born population - Bangladesh (%)
Place of birth for the foreign-born population - India (%)
Place of birth for the foreign-born population - Iran (%)
Place of birth for the foreign-born population - Kazakhstan (%)
Place of birth for the foreign-born population - Nepal (%)
Place of birth for the foreign-born population - Pakistan (%)
Place of birth for the foreign-born population - Sri Lanka (%)
Place of birth for the foreign-born population - Uzbekistan (%)
Place of birth for the foreign-born population - Other South Central Asia (%)
Place of birth for the foreign-born population - Burma (%)
Place of birth for the foreign-born population - Cambodia (%)
Place of birth for the foreign-born population - Indonesia (%)
Place of birth for the foreign-born population - Laos (%)
Place of birth for the foreign-born population - Malaysia (%)
Place of birth for the foreign-born population - Philippines (%)
Place of birth for the foreign-born population - Singapore (%)
Place of birth for the foreign-born population - Thailand (%)
Place of birth for the foreign-born population - Vietnam (%)
Place of birth for the foreign-born population - Other South Eastern Asia (%)
Place of birth for the foreign-born population - Armenia (%)
Place of birth for the foreign-born population - Iraq (%)
Place of birth for the foreign-born population - Israel (%)
Place of birth for the foreign-born population - Jordan (%)
Place of birth for the foreign-born population - Kuwait (%)
Place of birth for the foreign-born population - Lebanon (%)
Place of birth for the foreign-born population - Saudi Arabia (%)
Place of birth for the foreign-born population - Syria (%)
Place of birth for the foreign-born population - Turkey (%)
Place of birth for the foreign-born population - Yemen (%)
Place of birth for the foreign-born population - Other Western Asia (%)
Place of birth for the foreign-born population - Eritrea (%)
Place of birth for the foreign-born population - Ethiopia (%)
Place of birth for the foreign-born population - Kenya (%)
Place of birth for the foreign-born population - Somalia (%)
Place of birth for the foreign-born population - Uganda (%)
Place of birth for the foreign-born population - Zimbabwe (%)
Place of birth for the foreign-born population - Other Eastern Africa (%)
Place of birth for the foreign-born population - Cameroon (%)
Place of birth for the foreign-born population - Congo (%)
Place of birth for the foreign-born population - Democratic Republic of Congo (Zaire) (%)
Place of birth for the foreign-born population - Other Middle Africa (%)
Place of birth for the foreign-born population - Egypt (%)
Place of birth for the foreign-born population - Morocco (%)
Place of birth for the foreign-born population - Sudan (%)
Place of birth for the foreign-born population - Other Northern Africa (%)
Place of birth for the foreign-born population - South Africa (%)
Place of birth for the foreign-born population - Other Southern Africa (%)
Place of birth for the foreign-born population - Cabo Verde (%)
Place of birth for the foreign-born population - Ghana (%)
Place of birth for the foreign-born population - Liberia (%)
Place of birth for the foreign-born population - Nigeria (%)
Place of birth for the foreign-born population - Senegal (%)
Place of birth for the foreign-born population - Sierra Leone (%)
Place of birth for the foreign-born population - Other Western Africa (%)
Place of birth for the foreign-born population - Australia (%)
Place of birth for the foreign-born population - New Zealand (%)
Place of birth for the foreign-born population - Fiji (%)
Place of birth for the foreign-born population - Micronesia (%)
Place of birth for the foreign-born population - Bahamas (%)
Place of birth for the foreign-born population - Barbados (%)
Place of birth for the foreign-born population - Cuba (%)
Place of birth for the foreign-born population - Dominica (%)
Place of birth for the foreign-born population - Dominican Republic (%)
Place of birth for the foreign-born population - Grenada (%)
Place of birth for the foreign-born population - Haiti (%)
Place of birth for the foreign-born population - Jamaica (%)
Place of birth for the foreign-born population - St. Vincent and the Grenadines (%)
Place of birth for the foreign-born population - Trinidad and Tobago (%)
Place of birth for the foreign-born population - West Indies (%)
Place of birth for the foreign-born population - Other Caribbean (%)
Place of birth for the foreign-born population - Belize (%)
Place of birth for the foreign-born population - Costa Rica (%)
Place of birth for the foreign-born population - El Salvador (%)
Place of birth for the foreign-born population - Guatemala (%)
Place of birth for the foreign-born population - Honduras (%)
Place of birth for the foreign-born population - Mexico (%)
Place of birth for the foreign-born population - Nicaragua (%)
Place of birth for the foreign-born population - Panama (%)
Place of birth for the foreign-born population - Other Central America (%)
Place of birth for the foreign-born population - Argentina (%)
Place of birth for the foreign-born population - Bolivia (%)
Place of birth for the foreign-born population - Brazil (%)
Place of birth for the foreign-born population - Chile (%)
Place of birth for the foreign-born population - Colombia (%)
Place of birth for the foreign-born population - Ecuador (%)
Place of birth for the foreign-born population - Guyana (%)
Place of birth for the foreign-born population - Peru (%)
Place of birth for the foreign-born population - Uruguay (%)
Place of birth for the foreign-born population - Venezuela (%)
Place of birth for the foreign-born population - Other South America (%)
Place of birth for the foreign-born population - Canada (%)
Place of birth for the foreign-born population - Other Northern America (%)
Place of birth for the foreign-born population - Other (%)
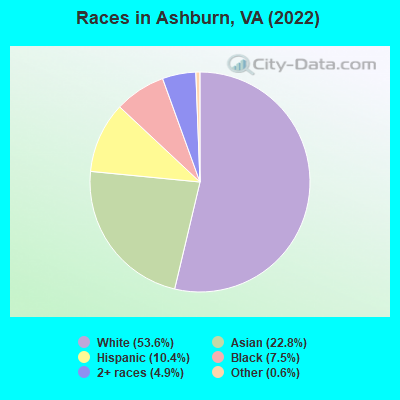
According to 2022 data, the most numerous races in Ashburn, VA are White alone (25,033 residents), Black alone (3,509 residents), and Hispanic (4,878 residents). 66.9% of Ashburn residents speak English at home.
Race distribution in Ashburn 25,033 53.6% White alone 10,656 22.8% Asian alone 4,878 10.4% Hispanic 3,509 7.5% Black alone 2,265 4.9% Two or more races 267 0.6% Other race alone 28 0.06% American Indian alone 26 0.06% Native Hawaiian and Other
2000 2022
4,965,637 70.2% White alone 1,376,378 19.4% Black alone 329,540 4.7% Hispanic 259,277 3.7% Asian alone 114,022 1.6% Two or more races 18,596 0.3% American Indian alone 11,685 0.2% Other race alone 3,380 0.05% Native Hawaiian and Other
5,095,130 58.7% White alone 1,594,785 18.4% Black alone 905,750 10.4% Hispanic 602,881 6.9% Asian alone 406,047 4.7% Two or more races 60,419 0.7% Other race alone 11,738 0.1% American Indian alone 6,869 0.08% Native Hawaiian and Other
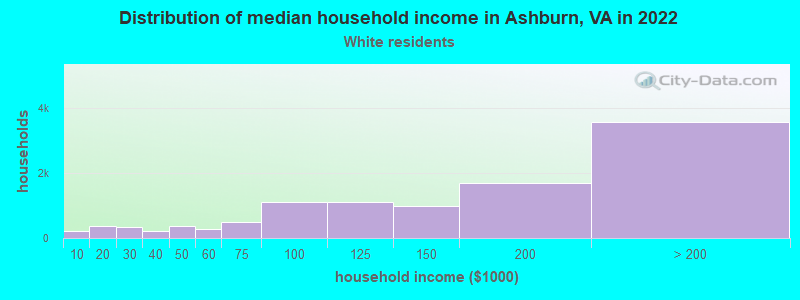
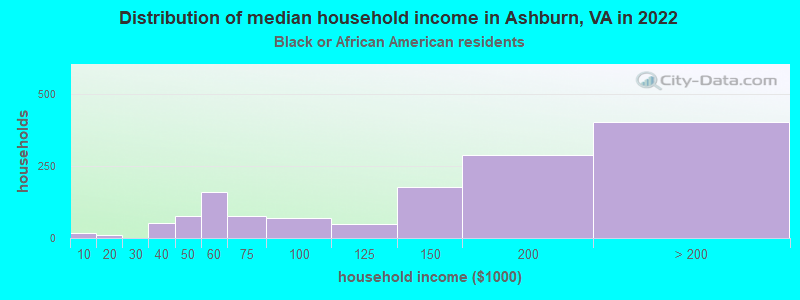
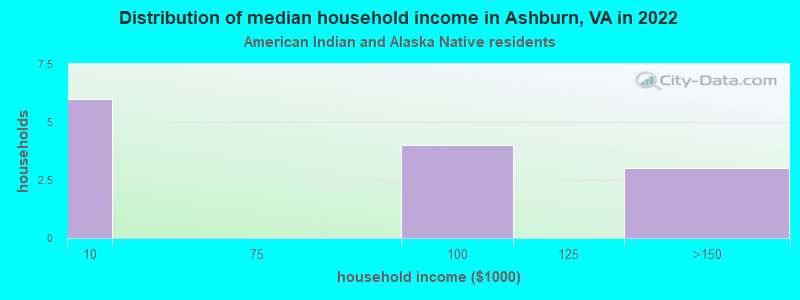
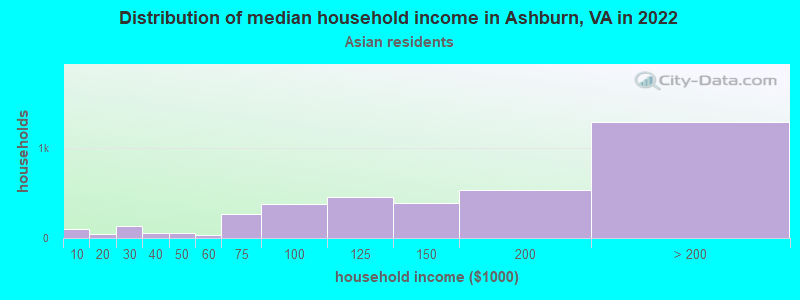
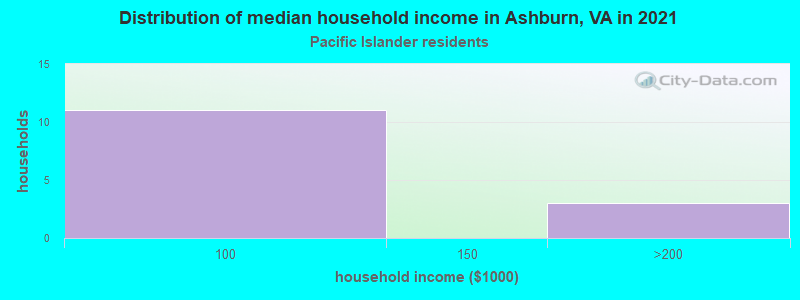
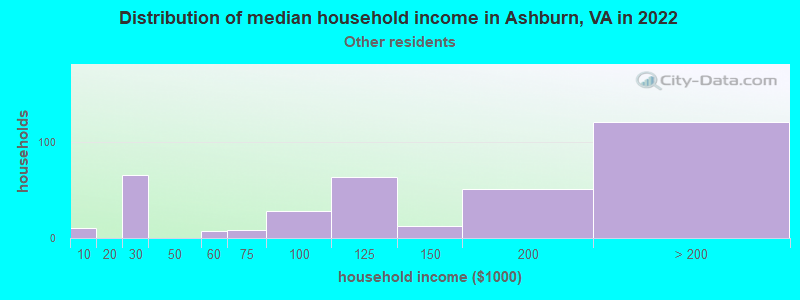
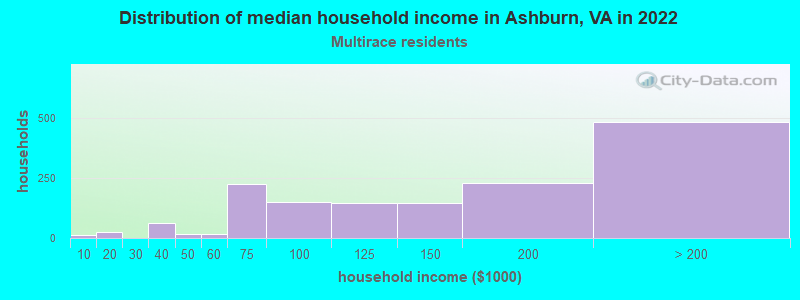
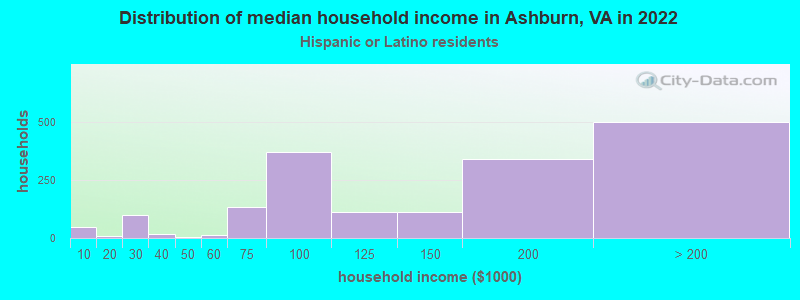
Income and house value in Ashburn Median household income in 2022 $145,315 White non-Hispanic householders$144,354 Black householders$153,304 Asian householders$106,902 Some other race householders$148,793 Two or more races householders$137,644 Hispanic or Latino race householders
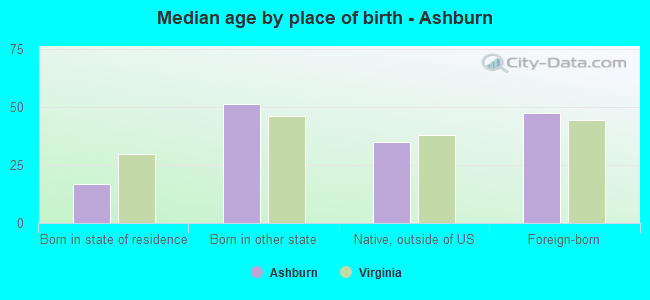
Median age by race in Ashburn
45.2 Median age for White residents43.2 47.3 46.3 Median age for Black or African American residents43.4 45.2 68.1 Median age for American Indian / Alaska Native residents61.0 70.8 39.3 Median age for Asian residents39.7 38.6 80.7 Median age for Native Hawaiian / Pacific Islander residents44.8 -714,150,046.8 40.4 Median age for Other race residents34.1 39.1 26.4 Median age for Two or more races residents25.7 26.4 46.5 Median age for White alone residents44.1 48.1 30.9 Median age for Hispanic or Latino residents31.3 30.6
Owner/renter occupied households by race in Ashburn
House owners and renters - White residents 7,631 71.2% Owner occupied3,085 28.8% Renter occupiedHouse owners and renters - Black or African American residents 677 48.6% Owner occupied716 51.4% Renter occupiedHouse owners and renters - American Indian / Alaska Native residents 11 66.3% Owner occupied6 33.7% Renter occupiedHouse owners and renters - Asian residents 2,838 79.3% Owner occupied742 20.7% Renter occupiedHouse owners and renters - Native Hawaiian / Pacific Islander residents 11 100.0% Owner occupiedHouse owners and renters - Other race residents 161 51.7% Owner occupied151 48.3% Renter occupiedHouse owners and renters - Two or more races residents 970 69.4% Owner occupied428 30.6% Renter occupiedHouse owners and renters - White alone residents 7,288 71.5% Owner occupied2,908 28.5% Renter occupiedHouse owners and renters - Hispanic or Latino residents 1,217 70.3% Owner occupied514 29.7% Renter occupied
Language usage in Ashburn
English speakers - Total 66.9% of residents of Ashburn speak English at home.
6.9% of residents speak Spanish at home 2,460 79.6% Speak English very well629 20.4% Speak English less than very well26.5% of residents speak other language at home 8,168 69.3% Speak English very well3,610 30.7% Speak English less than very well
English speakers - Born in the United States 91.6% of residents of Ashburn speak English at home.
3.2% of residents speak Spanish at home 603 97.4% Speak English very well16 2.6% Speak English less than very well4.9% of residents speak other language at home 840 89.9% Speak English very well94 10.1% Speak English less than very well
English speakers - Native, born elsewhere 52.7% of residents of Ashburn speak English at home.
13.3% of residents speak Spanish at home 152 96.8% Speak English very well5 3.2% Speak English less than very well30.6% of residents speak other language at home 360 100.0% Speak English very well
English speakers - Foreign-born 16.1% of residents of Ashburn speak English at home.
12.5% of residents speak Spanish at home 1,007 64.6% Speak English very well551 35.4% Speak English less than very well72.9% of residents speak other language at home 5,792 63.8% Speak English very well3,285 36.2% Speak English less than very well
White (Caucasian) - Speak only English Native:
94.4% (21,071)Foreign-born:
26.2% (684)
White (Caucasian) - Speak another language Native:
5.6% (1,247)Foreign-born:
72.7% (1,902)
Black or African American - Speak only English Native:
94.7% (2,701)Foreign-born:
36.1% (248)
Black or African American - Speak another language Native:
4.9% (140)Foreign-born:
58.8% (404)
Asian - Speak only English Native:
46.5% (1,362)Foreign-born:
9.4% (689)
Asian - Speak another language Native:
54.6% (1,601)Foreign-born:
90.6% (6,624)
Native Hawaiian / Pacific Islander - Speak only English Native:
88.0% (14)Foreign-born:
47.9% (18)
Other race - Speak only English Native:
47.0% (202)Foreign-born:
26.9% (138)
Other race - Speak another language Native:
52.8% (228)Foreign-born:
70.6% (361)
Two or more races - Speak only English Native:
70.7% (2,280)Foreign-born:
15.7% (168)
Two or more races - Speak another language Native:
28.0% (903)Foreign-born:
85.0% (914)
White alone - Speak only English Native:
94.9% (20,561)Foreign-born:
25.2% (582)
White alone - Speak another language Native:
4.8% (1,049)Foreign-born:
72.2% (1,668)
Hispanic or Latino - Speak only English Native:
56.0% (1,471)Foreign-born:
15.9% (291)
Hispanic or Latino - Speak another language Native:
44.5% (1,168)Foreign-born:
84.8% (1,554)
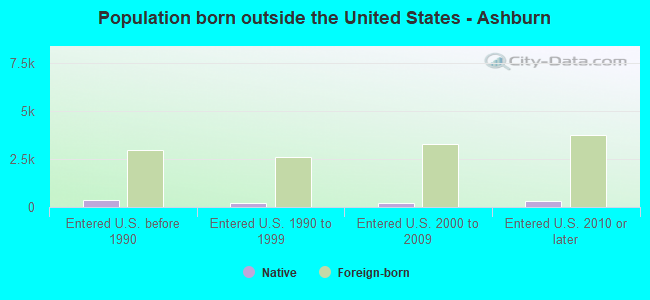
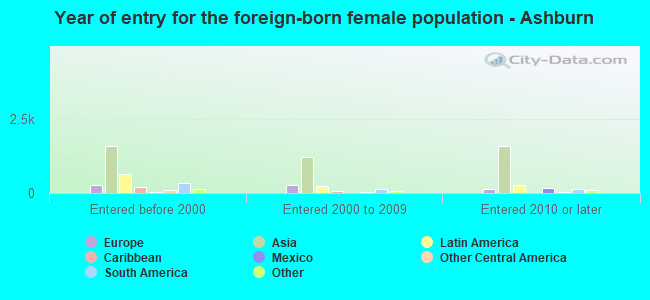
Foreign-born residents in Ashburn
Marital status for residents in Ashburn Marital status - White (Caucasian) population 15 years and over
Males 24.5% Never married61.7% Now married1.3% Separated3.8% Widowed8.6% DivorcedFemales 22.1% Never married56.3% Now married1.1% Separated10.4% Widowed10.2% DivorcedWomen who gave birth in the past 12 months Now married:
81.4% (177)Unmarried:
18.6% (40)
Women who did not give birth in the past 12 months Now married:
53.8% (2,766)Unmarried:
46.2% (2,372)
Marital status - Black or African American population 15 years and over
Males 25.9% Never married61.6% Now married1.2% Separated1.0% Widowed10.2% DivorcedFemales 37.7% Never married47.3% Now married4.9% Separated3.2% Widowed6.9% DivorcedWomen who gave birth in the past 12 months Now married:
63.2% (12)Unmarried:
36.8% (7)
Women who did not give birth in the past 12 months Now married:
32.4% (265)Unmarried:
67.6% (553)
Marital status - American Indian / Alaska Native population 15 years and over
Males 46.7% Never married53.3% Now married0.0% Separated0.0% Widowed0.0% DivorcedFemales 20.8% Never married50.0% Now married0.0% Separated0.0% Widowed29.2% DivorcedWomen who did not give birth in the past 12 months Now married:
0.0% (0)Unmarried:
100.0% (5)
Marital status - Asian population 15 years and over
Males 24.6% Never married71.8% Now married0.5% Separated1.9% Widowed1.2% DivorcedFemales 20.2% Never married67.0% Now married1.0% Separated7.9% Widowed3.9% DivorcedWomen who gave birth in the past 12 months Now married:
100.0% (68)Unmarried:
0.0% (0)
Women who did not give birth in the past 12 months Now married:
66.8% (1,914)Unmarried:
33.2% (953)
Marital status - Native Hawaiian / Pacific Islander population 15 years and over
Males 28.0% Never married72.0% Now married0.0% Separated0.0% Widowed0.0% DivorcedFemales 100.0% Never married0.0% Now married0.0% Separated0.0% Widowed0.0% DivorcedWomen who did not give birth in the past 12 months Now married:
0.0% (0)Unmarried:
100.0% (7)
Marital status - Other race population 15 years and over
Males 43.0% Never married41.0% Now married3.1% Separated0.0% Widowed12.9% DivorcedFemales 30.2% Never married18.8% Now married2.4% Separated2.1% Widowed46.6% DivorcedWomen who gave birth in the past 12 months Now married:
100.0% (12)Unmarried:
0.0% (0)
Women who did not give birth in the past 12 months Now married:
15.5% (48)Unmarried:
84.5% (263)
Marital status - Two or more races population 15 years and over
Males 49.3% Never married45.0% Now married0.0% Separated0.7% Widowed5.0% DivorcedFemales 41.7% Never married48.8% Now married2.6% Separated1.2% Widowed5.7% DivorcedWomen who did not give birth in the past 12 months Now married:
47.9% (628)Unmarried:
52.1% (684)
Marital status - White alone, not Hispanic / Latino population 15 years and over
Males 24.0% Never married61.8% Now married1.4% Separated4.0% Widowed8.7% DivorcedFemales 22.5% Never married55.7% Now married0.9% Separated10.8% Widowed10.0% DivorcedWomen who gave birth in the past 12 months Now married:
88.9% (139)Unmarried:
11.1% (17)
Women who did not give birth in the past 12 months Now married:
52.9% (2,666)Unmarried:
47.1% (2,378)
Marital status - Hispanic or Latino population 15 years and over
Males 35.7% Never married55.0% Now married0.4% Separated0.3% Widowed8.7% DivorcedFemales 29.5% Never married51.7% Now married2.6% Separated2.1% Widowed14.1% DivorcedWomen who gave birth in the past 12 months Now married:
59.8% (50)Unmarried:
40.2% (34)
Women who did not give birth in the past 12 months Now married:
49.7% (530)Unmarried:
50.3% (537)
Ancestries in Ashburn
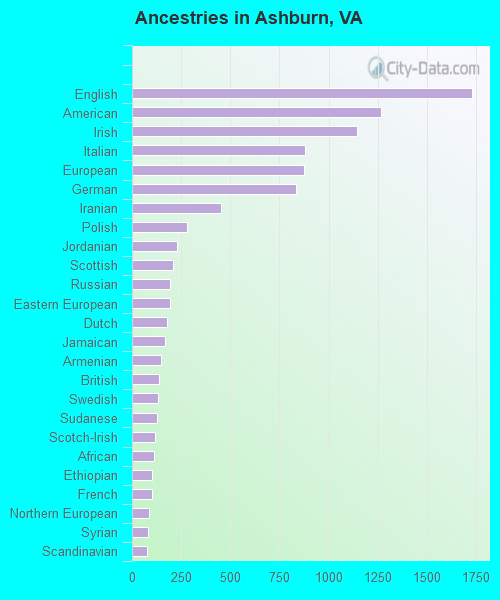
1,730 7.4% English1,267 5.4% American1,143 4.9% Irish882 3.8% Italian874 3.7% European837 3.6% German451 1.9% Iranian281 1.2% Polish231 1.0% Jordanian211 0.9% Scottish193 0.8% Russian193 0.8% Eastern European178 0.8% Dutch170 0.7% Jamaican149 0.6% Armenian138 0.6% British130 0.6% Swedish126 0.5% Sudanese116 0.5% Scotch-Irish114 0.5% African104 0.4% Ethiopian101 0.4% French86 0.4% Northern European80 0.3% Syrian76 0.3% Scandinavian74 0.3% Greek71 0.3% Hungarian69 0.3% Nigerian64 0.3% Norwegian62 0.3% Moroccan60 0.3% Canadian59 0.3% Ukrainian58 0.2% Brazilian58 0.2% Egyptian56 0.2% Ghanaian54 0.2% Portuguese54 0.2% Welsh45 0.2% Czech43 0.2% Lebanese40 0.2% Lithuanian39 0.2% Palestinian31 0.1% Albanian28 0.1% French Canadian15 0.06% Croatian12 0.05% Liberian9 0.04% Slovak9 0.04% Swiss9 0.04% Afghan9 0.04% U.S. Virgin Islander4 0.02% Slavic
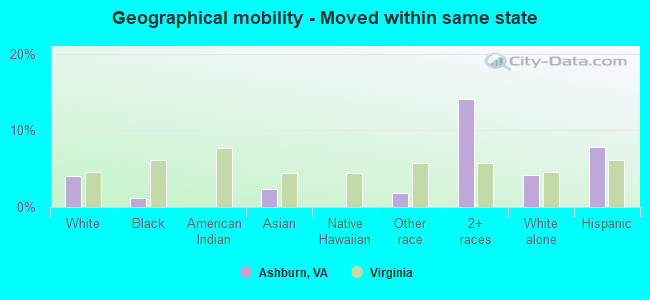
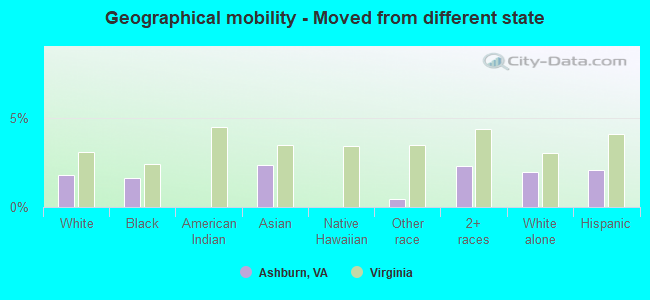
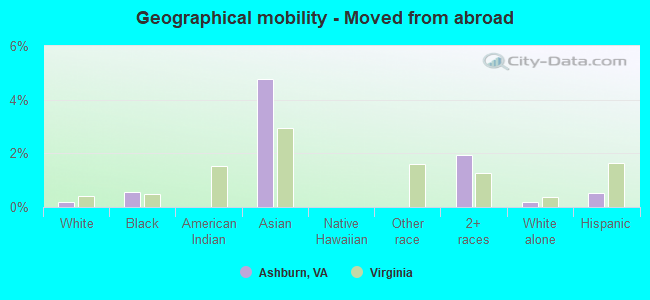
Geographical mobility in Ashburn Same house 1 year ago 23,096 89.3% White (Caucasian)3,280 90.7% Black or African American44 96.1% American Indian / Alaska Native9,309 86.5% Asian39 95.3% Native Hawaiian / Pacific Islander952 100.0% Other race3,901 84.0% Two or more races22,107 89.3% White alone, not Hispanic / Latino4,298 89.3% Hispanic or LatinoMoved within same county 1,264 4.9% White / Caucasian304 8.4% Black or African American526 4.9% Asian47 1.0% Two or more races1,146 4.6% White alone, not Hispanic / Latino135 2.8% Hispanic or LatinoMoved within same state 1,040 4.0% White / Caucasian43 1.2% Black or African American252 2.3% Asian18 1.9% Other race654 14.1% Two or more races1,031 4.2% White alone, not Hispanic / Latino379 7.9% Hispanic or LatinoMoved from different state 466 1.8% White / Caucasian59 1.6% Black or African American254 2.4% Asian4 0.5% Other race106 2.3% Two or more races482 1.9% White alone, not Hispanic / Latino101 2.1% Hispanic or LatinoMoved from abroad 45 0.2% White20 0.5% Black or African American514 4.8% Asian91 1.9% Two or more races43 0.2% White alone, not Hispanic / Latino24 0.5% Hispanic or Latino
Children Nativity (place of birth) in Ashburn
Children under 6 years - Living with two parents Both parents native 1,028 100.0% NativeBoth parents foreign-born 585 94.0% Native37 6.0% Foreign-bornOne native, one foreign-born parent 345 100.0% NativeChildren under 6 years - Living with one parent Native parent 325 100.0% NativeForeign-born parent 97 100.0% NativeChildren 6 to 17 years - Living with two parents Both parents native 3,414 100.0% NativeBoth parents foreign-born 1,467 72.9% Native545 27.1% Foreign-bornOne native, one foreign-born parent 1,046 98.5% Native16 1.5% Foreign-bornChildren 6 to 17 years - Living with one parent Native parent 988 100.0% NativeForeign-born parent 345 49.1% Native357 50.9% Foreign-born
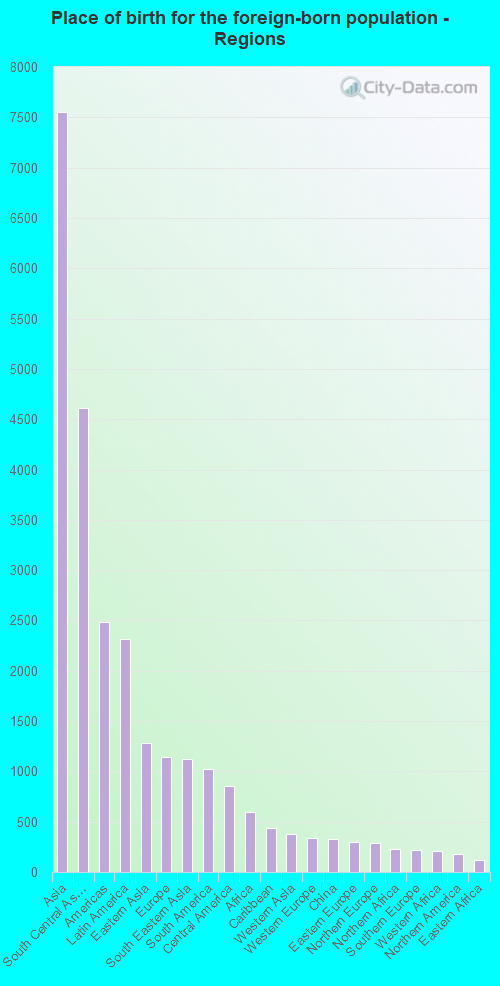
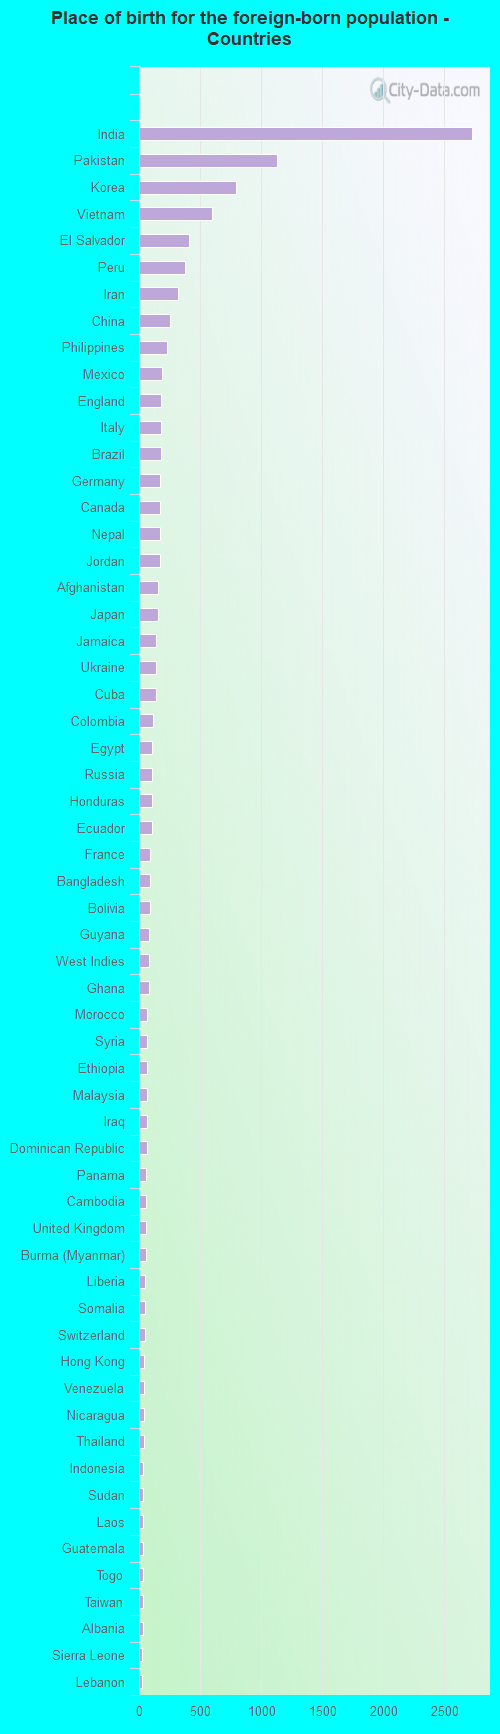
Place of birth for residents in Ashburn 7,554 Asia4,608 South Central Asia2,486 Americas2,312 Latin America1,284 Eastern Asia1,146 Europe1,122 South Eastern Asia1,024 South America851 Central America596 Africa436 Caribbean373 Western Asia336 Western Europe331 China300 Eastern Europe285 Northern Europe229 Northern Africa223 Southern Europe208 Western Africa174 Northern America124 Eastern Africa22 Middle Africa18 Oceania11 Southern Africa2,731 India1,134 Pakistan798 Korea602 Vietnam412 El Salvador379 Peru317 Iran252 China227 Philippines185 Mexico184 England179 Italy178 Brazil174 Germany174 Canada172 Nepal170 Jordan159 Afghanistan155 Japan142 Jamaica138 Ukraine137 Cuba114 Colombia110 Egypt107 Russia106 Honduras104 Ecuador94 France93 Bangladesh88 Bolivia83 Guyana83 West Indies79 Ghana68 Morocco67 Syria66 Ethiopia65 Malaysia64 Iraq62 Dominican Republic61 Panama60 Cambodia59 United Kingdom56 Burma (Myanmar)50 Liberia48 Somalia46 Switzerland45 Hong Kong44 Venezuela44 Nicaragua37 Thailand36 Indonesia35 Sudan35 Laos35 Guatemala34 Togo33 Taiwan33 Albania27 Sierra Leone27 Lebanon22 Cameroon22 Spain21 Argentina21 Netherlands17 Ivory Coast16 Kuwait15 Scotland15 Greece14 United Arab Emirates12 Saudi Arabia11 South Africa11 Poland10 Chile9 Sweden9 Trinidad and Tobago9 Denmark8 Ireland7 Algeria7 Marshall Islands6 Portugal6 Azores Islands5 Hungary4 Romania
Grandparents responsible for own grandchildren in Ashburn
Grandparents (30 to 59 years) White / Caucasian 33 23.3% Responsible for grandchildren110 76.7% Not responsible for grandchildrenBlack or African American 5 100.0% Not responsible for grandchildrenAsian 17 83.5% Responsible for grandchildren3 16.5% Not responsible for grandchildrenTwo or more races 39 76.0% Responsible for grandchildren12 24.0% Not responsible for grandchildrenWhite alone, not Hispanic / Latino 29 28.3% Responsible for grandchildren72 71.7% Not responsible for grandchildrenHispanic or Latino 14 19.7% Responsible for grandchildren56 80.3% Not responsible for grandchildrenGrandparents (60 years and over) White / Caucasian 58 28.5% Responsible for grandchildren145 71.5% Not responsible for grandchildrenBlack or African American 17 70.7% Responsible for grandchildren7 29.3% Not responsible for grandchildrenAsian 17 6.4% Responsible for grandchildren247 93.6% Not responsible for grandchildrenTwo or more races 87 100.0% Not responsible for grandchildrenWhite alone, not Hispanic / Latino 59 27.7% Responsible for grandchildren153 72.3% Not responsible for grandchildrenHispanic or Latino 81 100.0% Not responsible for grandchildren