Races in Ashwaubenon, Wisconsin (WI) Detailed Stats
Data:
Races - White alone (%)
Races - White alone (% change since 2000)
Races - Black alone (%)
Races - Black alone (% change since 2000)
Races - American Indian alone (%)
Races - American Indian alone (% change since 2000)
Races - Asian alone (%)
Races - Asian alone (% change since 2000)
Races - Hispanic (%)
Races - Hispanic (% change since 2000)
Races - Native Hawaiian and Other Pacific Islander alone (%)
Races - Native Hawaiian and Other Pacific Islander alone (% change since 2000)
Races - Two or more races(%)
Races - Two or more races(% change since 2000)
Races - Other race alone (%)
Races - Other race alone (% change since 2000)
Racial diversity
Place of birth - Born in state of residence (%)
Place of birth - Born in state of residence (%) - White
Place of birth - Born in state of residence (%) - Black or African American
Place of birth - Born in state of residence (%) - Asian
Place of birth - Born in state of residence (%) - Hispanic or Latino
Place of birth - Born in state of residence (%) - American Indian and Alaska Native
Place of birth - Born in state of residence (%) - Multirace
Place of birth - Born in state of residence (%) - Other Race
Place of birth - Born in other state (%)
Place of birth - Born in other state (%) - White
Place of birth - Born in other state (%) - Black or African American
Place of birth - Born in other state (%) - Asian
Place of birth - Born in other state (%) - Hispanic or Latino
Place of birth - Born in other state (%) - American Indian and Alaska Native
Place of birth - Born in other state (%) - Multirace
Place of birth - Born in other state (%) - Other Race
Place of birth - Native, outside of US (%)
Place of birth - Native, outside of US (%) - White
Place of birth - Native, outside of US (%) - Black or African American
Place of birth - Native, outside of US (%) - Asian
Place of birth - Native, outside of US (%) - Hispanic or Latino
Place of birth - Native, outside of US (%) - American Indian and Alaska Native
Place of birth - Native, outside of US (%) - Multirace
Place of birth - Native, outside of US (%) - Other Race
Place of birth - Foreign born (%)
Place of birth - Foreign born (%) - White
Place of birth - Foreign born (%) - Black or African American
Place of birth - Foreign born (%) - Asian
Place of birth - Foreign born (%) - Hispanic or Latino
Place of birth - Foreign born (%) - American Indian and Alaska Native
Place of birth - Foreign born (%) - Multirace
Place of birth - Foreign born (%) - Other Race
Residents speaking English at home (%)
Residents speaking English at home - Born in the United States (%)
Residents speaking English at home - Native, born elsewhere (%)
Residents speaking English at home - Foreign born (%)
Residents speaking Spanish at home (%)
Residents speaking Spanish at home - Born in the United States (%)
Residents speaking Spanish at home - Native, born elsewhere (%)
Residents speaking Spanish at home - Foreign born (%)
Residents speaking other language at home (%)
Residents speaking other language at home - Born in the United States (%)
Residents speaking other language at home - Native, born elsewhere (%)
Residents speaking other language at home - Foreign born (%)
Marital status - Never married (%)
Marital status - Now married (%)
Marital status - Separated (%)
Marital status - Widowed (%)
Marital status - Divorced (%)
Ancestries Reported - Arab (%)
Ancestries Reported - Czech (%)
Ancestries Reported - Danish (%)
Ancestries Reported - Dutch (%)
Ancestries Reported - English (%)
Ancestries Reported - French (%)
Ancestries Reported - French Canadian (%)
Ancestries Reported - German (%)
Ancestries Reported - Greek (%)
Ancestries Reported - Hungarian (%)
Ancestries Reported - Irish (%)
Ancestries Reported - Italian (%)
Ancestries Reported - Lithuanian (%)
Ancestries Reported - Norwegian (%)
Ancestries Reported - Polish (%)
Ancestries Reported - Portuguese (%)
Ancestries Reported - Russian (%)
Ancestries Reported - Scotch-Irish (%)
Ancestries Reported - Scottish (%)
Ancestries Reported - Slovak (%)
Ancestries Reported - Subsaharan African (%)
Ancestries Reported - Swedish (%)
Ancestries Reported - Swiss (%)
Ancestries Reported - Ukrainian (%)
Ancestries Reported - United States (%)
Ancestries Reported - Welsh (%)
Ancestries Reported - West Indian (%)
Ancestries Reported - Other (%)
Geographical mobility - Same house 1 year ago (%)
Geographical mobility - Same house 1 year ago (%) - White
Geographical mobility - Same house 1 year ago (%) - Black or African American
Geographical mobility - Same house 1 year ago (%) - Asian
Geographical mobility - Same house 1 year ago (%) - Hispanic or Latino
Geographical mobility - Same house 1 year ago (%) - American Indian and Alaska Native
Geographical mobility - Same house 1 year ago (%) - Multirace
Geographical mobility - Same house 1 year ago (%) - Other Race
Geographical mobility - Moved within same county (%)
Geographical mobility - Moved within same county (%) - White
Geographical mobility - Moved within same county (%) - Black or African American
Geographical mobility - Moved within same county (%) - Asian
Geographical mobility - Moved within same county (%) - Hispanic or Latino
Geographical mobility - Moved within same county (%) - American Indian and Alaska Native
Geographical mobility - Moved within same county (%) - Multirace
Geographical mobility - Moved within same county (%) - Other Race
Geographical mobility - Moved from different county within same state (%)
Geographical mobility - Moved from different county within same state (%) - White
Geographical mobility - Moved from different county within same state (%) - Black or African American
Geographical mobility - Moved from different county within same state (%) - Asian
Geographical mobility - Moved from different county within same state (%) - Hispanic or Latino
Geographical mobility - Moved from different county within same state (%) - American Indian and Alaska Native
Geographical mobility - Moved from different county within same state (%) - Multirace
Geographical mobility - Moved from different county within same state (%) - Other Race
Geographical mobility - Moved from different state (%)
Geographical mobility - Moved from different state (%) - White
Geographical mobility - Moved from different state (%) - Black or African American
Geographical mobility - Moved from different state (%) - Asian
Geographical mobility - Moved from different state (%) - Hispanic or Latino
Geographical mobility - Moved from different state (%) - American Indian and Alaska Native
Geographical mobility - Moved from different state (%) - Multirace
Geographical mobility - Moved from different state (%) - Other Race
Geographical mobility - Moved from abroad (%)
Geographical mobility - Moved from abroad (%) - White
Geographical mobility - Moved from abroad (%) - Black or African American
Geographical mobility - Moved from abroad (%) - Asian
Geographical mobility - Moved from abroad (%) - Hispanic or Latino
Geographical mobility - Moved from abroad (%) - American Indian and Alaska Native
Geographical mobility - Moved from abroad (%) - Multirace
Geographical mobility - Moved from abroad (%) - Other Race
Place of birth for the foreign-born population - Ireland (%)
Place of birth for the foreign-born population - Denmark (%)
Place of birth for the foreign-born population - Norway (%)
Place of birth for the foreign-born population - Sweden (%)
Place of birth for the foreign-born population - United Kingdom (%)
Place of birth for the foreign-born population - England (%)
Place of birth for the foreign-born population - Scotland (%)
Place of birth for the foreign-born population - Other Northern Europe (%)
Place of birth for the foreign-born population - Austria (%)
Place of birth for the foreign-born population - Belgium (%)
Place of birth for the foreign-born population - France (%)
Place of birth for the foreign-born population - Germany (%)
Place of birth for the foreign-born population - Netherlands (%)
Place of birth for the foreign-born population - Switzerland (%)
Place of birth for the foreign-born population - Other Western Europe (%)
Place of birth for the foreign-born population - Greece (%)
Place of birth for the foreign-born population - Italy (%)
Place of birth for the foreign-born population - Portugal (%)
Place of birth for the foreign-born population - Spain (%)
Place of birth for the foreign-born population - Other Southern Europe (%)
Place of birth for the foreign-born population - Albania (%)
Place of birth for the foreign-born population - Belarus (%)
Place of birth for the foreign-born population - Bosnia and Herzegovina (%)
Place of birth for the foreign-born population - Bulgaria (%)
Place of birth for the foreign-born population - Croatia (%)
Place of birth for the foreign-born population - Czechoslovakia (%)
Place of birth for the foreign-born population - Hungary (%)
Place of birth for the foreign-born population - Latvia (%)
Place of birth for the foreign-born population - Lithuania (%)
Place of birth for the foreign-born population - North Macedonia (Macedonia) (%)
Place of birth for the foreign-born population - Moldova (%)
Place of birth for the foreign-born population - Poland (%)
Place of birth for the foreign-born population - Romania (%)
Place of birth for the foreign-born population - Russia (%)
Place of birth for the foreign-born population - Serbia (%)
Place of birth for the foreign-born population - Ukraine (%)
Place of birth for the foreign-born population - Other Eastern Europe (%)
Place of birth for the foreign-born population - China (%)
Place of birth for the foreign-born population - Hong Kong (%)
Place of birth for the foreign-born population - Taiwan (%)
Place of birth for the foreign-born population - Japan (%)
Place of birth for the foreign-born population - Korea (%)
Place of birth for the foreign-born population - Other Eastern Asia (%)
Place of birth for the foreign-born population - Afghanistan (%)
Place of birth for the foreign-born population - Bangladesh (%)
Place of birth for the foreign-born population - India (%)
Place of birth for the foreign-born population - Iran (%)
Place of birth for the foreign-born population - Kazakhstan (%)
Place of birth for the foreign-born population - Nepal (%)
Place of birth for the foreign-born population - Pakistan (%)
Place of birth for the foreign-born population - Sri Lanka (%)
Place of birth for the foreign-born population - Uzbekistan (%)
Place of birth for the foreign-born population - Other South Central Asia (%)
Place of birth for the foreign-born population - Burma (%)
Place of birth for the foreign-born population - Cambodia (%)
Place of birth for the foreign-born population - Indonesia (%)
Place of birth for the foreign-born population - Laos (%)
Place of birth for the foreign-born population - Malaysia (%)
Place of birth for the foreign-born population - Philippines (%)
Place of birth for the foreign-born population - Singapore (%)
Place of birth for the foreign-born population - Thailand (%)
Place of birth for the foreign-born population - Vietnam (%)
Place of birth for the foreign-born population - Other South Eastern Asia (%)
Place of birth for the foreign-born population - Armenia (%)
Place of birth for the foreign-born population - Iraq (%)
Place of birth for the foreign-born population - Israel (%)
Place of birth for the foreign-born population - Jordan (%)
Place of birth for the foreign-born population - Kuwait (%)
Place of birth for the foreign-born population - Lebanon (%)
Place of birth for the foreign-born population - Saudi Arabia (%)
Place of birth for the foreign-born population - Syria (%)
Place of birth for the foreign-born population - Turkey (%)
Place of birth for the foreign-born population - Yemen (%)
Place of birth for the foreign-born population - Other Western Asia (%)
Place of birth for the foreign-born population - Eritrea (%)
Place of birth for the foreign-born population - Ethiopia (%)
Place of birth for the foreign-born population - Kenya (%)
Place of birth for the foreign-born population - Somalia (%)
Place of birth for the foreign-born population - Uganda (%)
Place of birth for the foreign-born population - Zimbabwe (%)
Place of birth for the foreign-born population - Other Eastern Africa (%)
Place of birth for the foreign-born population - Cameroon (%)
Place of birth for the foreign-born population - Congo (%)
Place of birth for the foreign-born population - Democratic Republic of Congo (Zaire) (%)
Place of birth for the foreign-born population - Other Middle Africa (%)
Place of birth for the foreign-born population - Egypt (%)
Place of birth for the foreign-born population - Morocco (%)
Place of birth for the foreign-born population - Sudan (%)
Place of birth for the foreign-born population - Other Northern Africa (%)
Place of birth for the foreign-born population - South Africa (%)
Place of birth for the foreign-born population - Other Southern Africa (%)
Place of birth for the foreign-born population - Cabo Verde (%)
Place of birth for the foreign-born population - Ghana (%)
Place of birth for the foreign-born population - Liberia (%)
Place of birth for the foreign-born population - Nigeria (%)
Place of birth for the foreign-born population - Senegal (%)
Place of birth for the foreign-born population - Sierra Leone (%)
Place of birth for the foreign-born population - Other Western Africa (%)
Place of birth for the foreign-born population - Australia (%)
Place of birth for the foreign-born population - New Zealand (%)
Place of birth for the foreign-born population - Fiji (%)
Place of birth for the foreign-born population - Micronesia (%)
Place of birth for the foreign-born population - Bahamas (%)
Place of birth for the foreign-born population - Barbados (%)
Place of birth for the foreign-born population - Cuba (%)
Place of birth for the foreign-born population - Dominica (%)
Place of birth for the foreign-born population - Dominican Republic (%)
Place of birth for the foreign-born population - Grenada (%)
Place of birth for the foreign-born population - Haiti (%)
Place of birth for the foreign-born population - Jamaica (%)
Place of birth for the foreign-born population - St. Vincent and the Grenadines (%)
Place of birth for the foreign-born population - Trinidad and Tobago (%)
Place of birth for the foreign-born population - West Indies (%)
Place of birth for the foreign-born population - Other Caribbean (%)
Place of birth for the foreign-born population - Belize (%)
Place of birth for the foreign-born population - Costa Rica (%)
Place of birth for the foreign-born population - El Salvador (%)
Place of birth for the foreign-born population - Guatemala (%)
Place of birth for the foreign-born population - Honduras (%)
Place of birth for the foreign-born population - Mexico (%)
Place of birth for the foreign-born population - Nicaragua (%)
Place of birth for the foreign-born population - Panama (%)
Place of birth for the foreign-born population - Other Central America (%)
Place of birth for the foreign-born population - Argentina (%)
Place of birth for the foreign-born population - Bolivia (%)
Place of birth for the foreign-born population - Brazil (%)
Place of birth for the foreign-born population - Chile (%)
Place of birth for the foreign-born population - Colombia (%)
Place of birth for the foreign-born population - Ecuador (%)
Place of birth for the foreign-born population - Guyana (%)
Place of birth for the foreign-born population - Peru (%)
Place of birth for the foreign-born population - Uruguay (%)
Place of birth for the foreign-born population - Venezuela (%)
Place of birth for the foreign-born population - Other South America (%)
Place of birth for the foreign-born population - Canada (%)
Place of birth for the foreign-born population - Other Northern America (%)
Place of birth for the foreign-born population - Other (%)
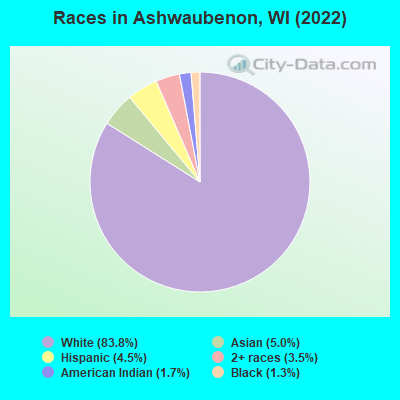
According to 2022 data, the most numerous races in Ashwaubenon, WI are White alone (14,274 residents), Hispanic (760 residents), and Black alone (224 residents). 92.2% of Ashwaubenon residents speak English at home. 4.4% of Ashwaubenon, WI residents are foreign-born (2.8% born in Asia, 1.2% born in Latin America), which is 12.4% less than the foreign-born rate of 5.0% across the entire state of Wisconsin.
Race distribution in Ashwaubenon
2000 2022
4,681,630 87.3% White alone 300,245 5.6% Black alone 192,921 3.6% Hispanic 87,995 1.6% Asian alone 51,921 1.0% Two or more races 43,980 0.8% American Indian alone 3,637 0.07% Other race alone 1,346 0.03% Native Hawaiian and Other
4,654,031 79.0% White alone 447,022 7.6% Hispanic 345,678 5.9% Black alone 217,532 3.7% Two or more races 172,242 2.9% Asian alone 33,762 0.6% American Indian alone 19,680 0.3% Other race alone 2,592 0.04% Native Hawaiian and Other
Income and house value in Ashwaubenon Median household income in 2022 $66,389 White non-Hispanic householders$13,104 Black householders$38,970 American Indian and Alaska Native householders$143,726 Asian householders$38,642 Some other race householders$31,120 Two or more races householders$28,717 Hispanic or Latino race householdersMedian 2022 house value $247,487 White Non-Hispanic householders$332,095 Black or African American householders$187,403 American Indian or Alaska Native householders $284,477 Asian householders$370,516 Two or more races householders
Median age by race in Ashwaubenon
45.5 Median age for White residents45.4 45.4 36.7 Median age for Black or African American residents30.6 38.2 26.8 Median age for American Indian / Alaska Native residents19.9 52.8 36.0 Median age for Asian residents36.1 35.7 -825,688,072.6 Median age for Native Hawaiian / Pacific Islander residents-862,745,097.2 -732,444,443.7 19.0 Median age for Other race residents19.9 18.0 25.7 Median age for Two or more races residents26.0 26.8 45.4 Median age for White alone residents46.5 45.7 24.0 Median age for Hispanic or Latino residents28.1 21.4
Owner/renter occupied households by race in Ashwaubenon
House owners and renters - White residents 4,329 60.6% Owner occupied2,815 39.4% Renter occupiedHouse owners and renters - Black or African American residents 8 7.1% Owner occupied106 92.9% Renter occupiedHouse owners and renters - American Indian / Alaska Native residents 21 14.8% Owner occupied118 85.2% Renter occupiedHouse owners and renters - Asian residents 152 45.8% Owner occupied179 54.2% Renter occupiedHouse owners and renters - Other race residents 63 86.8% Owner occupied10 13.2% Renter occupiedHouse owners and renters - Two or more races residents 132 34.2% Owner occupied253 65.8% Renter occupiedHouse owners and renters - White alone residents 4,328 61.0% Owner occupied2,763 39.0% Renter occupiedHouse owners and renters - Hispanic or Latino residents 93 29.8% Owner occupied220 70.2% Renter occupied
Language usage in Ashwaubenon
English speakers - Total 92.2% of residents of Ashwaubenon speak English at home.
2.7% of residents speak Spanish at home 239 53.8% Speak English very well205 46.2% Speak English less than very well5.2% of residents speak other language at home 563 65.9% Speak English very well291 34.1% Speak English less than very well
English speakers - Born in the United States 93.7% of residents of Ashwaubenon speak English at home.
3.2% of residents speak Spanish at home 71 83.5% Speak English very well14 16.5% Speak English less than very well1.8% of residents speak other language at home 23 48.9% Speak English very well24 51.1% Speak English less than very well
English speakers - Native, born elsewhere 44.7% of residents of Ashwaubenon speak English at home.
35.9% of residents speak Spanish at home 74 100.0% Speak English less than very well5.8% of residents speak other language at home 12 100.0% Speak English very well
English speakers - Foreign-born 25.8% of residents of Ashwaubenon speak English at home.
19.6% of residents speak Spanish at home 45 33.8% Speak English very well88 66.2% Speak English less than very well55.6% of residents speak other language at home 212 56.2% Speak English very well165 43.8% Speak English less than very well
White (Caucasian) - Speak only English Native:
97.5% (13,510)Foreign-born:
67.6% (46)
White (Caucasian) - Speak another language Native:
2.5% (344)Foreign-born:
45.2% (31)
Asian - Speak only English Native:
50.3% (144)Foreign-born:
30.2% (153)
Asian - Speak another language Native:
47.6% (136)Foreign-born:
72.2% (366)
Other race - Speak another language Native:
70.0% (98)Foreign-born:
99.2% (132)
Two or more races - Speak another language Native:
17.9% (149)Foreign-born:
85.5% (45)
White alone - Speak only English Native:
97.3% (13,440)Foreign-born:
34.7% (21)
White alone - Speak another language Native:
2.8% (380)Foreign-born:
63.5% (38)
Hispanic or Latino - Speak only English Native:
46.6% (204)Foreign-born:
24.3% (41)
Hispanic or Latino - Speak another language Native:
52.6% (230)Foreign-born:
81.5% (137)
Foreign-born residents in Ashwaubenon 758 residents are foreign born (2.8% Asia , 1.2% Latin America ).
This city:
4.4%Wisconsin:
5.0%
Marital status for residents in Ashwaubenon Marital status - White (Caucasian) population 15 years and over
Males 35.7% Never married51.6% Now married0.3% Separated3.9% Widowed8.5% DivorcedFemales 26.3% Never married47.9% Now married1.1% Separated11.7% Widowed13.1% DivorcedWomen who gave birth in the past 12 months Now married:
55.9% (37)Unmarried:
44.1% (29)
Women who did not give birth in the past 12 months Now married:
35.0% (1,018)Unmarried:
65.0% (1,888)
Marital status - Black or African American population 15 years and over
Males 34.8% Never married0.0% Now married0.0% Separated0.0% Widowed65.2% DivorcedFemales 91.7% Never married0.0% Now married0.0% Separated8.3% Widowed0.0% DivorcedWomen who did not give birth in the past 12 months Now married:
0.0% (0)Unmarried:
100.0% (117)
Marital status - American Indian / Alaska Native population 15 years and over
Males 75.7% Never married15.7% Now married0.0% Separated0.0% Widowed8.7% DivorcedFemales 14.4% Never married26.1% Now married9.9% Separated0.0% Widowed49.5% DivorcedWomen who did not give birth in the past 12 months Now married:
27.3% (23)Unmarried:
72.7% (61)
Marital status - Asian population 15 years and over
Males 54.4% Never married38.9% Now married6.7% Separated0.0% Widowed0.0% DivorcedFemales 35.0% Never married45.6% Now married7.3% Separated1.6% Widowed10.6% DivorcedWomen who gave birth in the past 12 months Now married:
100.0% (9)Unmarried:
0.0% (0)
Women who did not give birth in the past 12 months Now married:
59.1% (192)Unmarried:
40.9% (133)
Marital status - Other race population 15 years and over
Males 64.1% Never married35.9% Now married0.0% Separated0.0% Widowed0.0% DivorcedFemales 45.9% Never married38.8% Now married0.0% Separated15.3% Widowed0.0% DivorcedWomen who did not give birth in the past 12 months Now married:
45.8% (30)Unmarried:
54.2% (35)
Marital status - Two or more races population 15 years and over
Males 35.3% Never married42.0% Now married0.0% Separated0.0% Widowed22.7% DivorcedFemales 44.0% Never married47.6% Now married0.0% Separated0.0% Widowed8.3% DivorcedWomen who gave birth in the past 12 months Now married:
80.0% (83)Unmarried:
20.0% (21)
Women who did not give birth in the past 12 months Now married:
21.6% (64)Unmarried:
78.4% (232)
Marital status - White alone, not Hispanic / Latino population 15 years and over
Males 35.4% Never married51.8% Now married0.3% Separated4.0% Widowed8.5% DivorcedFemales 26.0% Never married48.4% Now married1.1% Separated11.4% Widowed13.1% DivorcedWomen who gave birth in the past 12 months Now married:
55.9% (38)Unmarried:
44.1% (30)
Women who did not give birth in the past 12 months Now married:
35.3% (1,022)Unmarried:
64.7% (1,871)
Marital status - Hispanic or Latino population 15 years and over
Males 57.1% Never married42.9% Now married0.0% Separated0.0% Widowed0.0% DivorcedFemales 50.7% Never married23.0% Now married4.1% Separated15.6% Widowed6.7% DivorcedWomen who did not give birth in the past 12 months Now married:
34.8% (81)Unmarried:
65.2% (152)
Ancestries in Ashwaubenon
1,782 24.1% German850 11.5% Irish692 9.4% American381 5.1% Polish278 3.8% Belgian209 2.8% European184 2.5% Dutch184 2.5% English159 2.1% Ukrainian150 2.0% Norwegian112 1.5% Russian104 1.4% Czech85 1.1% French66 0.9% Italian59 0.8% Scottish37 0.5% Swedish28 0.4% French Canadian28 0.4% Luxembourger24 0.3% Canadian23 0.3% Danish19 0.3% African16 0.2% Croatian13 0.2% Slovak12 0.2% Slavic11 0.1% Eastern European10 0.1% British10 0.1% Northern European7 0.09% Swiss
Children Nativity (place of birth) in Ashwaubenon
Children under 6 years - Living with two parents Both parents native 426 100.0% NativeBoth parents foreign-born 75 100.0% NativeOne native, one foreign-born parent 26 100.0% NativeChildren under 6 years - Living with one parent Native parent 252 100.0% NativeChildren 6 to 17 years - Living with two parents Both parents native 1,098 99.2% Native9 0.8% Foreign-bornBoth parents foreign-born 172 93.8% Native11 6.2% Foreign-bornOne native, one foreign-born parent 64 100.0% NativeChildren 6 to 17 years - Living with one parent Native parent 715 99.5% Native4 0.5% Foreign-bornForeign-born parent 14 48.4% Native15 51.6% Foreign-born
Grandparents responsible for own grandchildren in Ashwaubenon
Grandparents (30 to 59 years) White / Caucasian 20 30.1% Responsible for grandchildren47 69.9% Not responsible for grandchildrenWhite alone, not Hispanic / Latino 21 28.2% Responsible for grandchildren54 71.8% Not responsible for grandchildrenGrandparents (60 years and over) White / Caucasian 18 27.8% Responsible for grandchildren47 72.2% Not responsible for grandchildrenWhite alone, not Hispanic / Latino 18 28.9% Responsible for grandchildren45 71.1% Not responsible for grandchildren