Races in Atlantic Beach, Florida (FL) Detailed Stats
Data:
Races - White alone (%)
Races - White alone (% change since 2000)
Races - Black alone (%)
Races - Black alone (% change since 2000)
Races - American Indian alone (%)
Races - American Indian alone (% change since 2000)
Races - Asian alone (%)
Races - Asian alone (% change since 2000)
Races - Hispanic (%)
Races - Hispanic (% change since 2000)
Races - Native Hawaiian and Other Pacific Islander alone (%)
Races - Native Hawaiian and Other Pacific Islander alone (% change since 2000)
Races - Two or more races(%)
Races - Two or more races(% change since 2000)
Races - Other race alone (%)
Races - Other race alone (% change since 2000)
Racial diversity
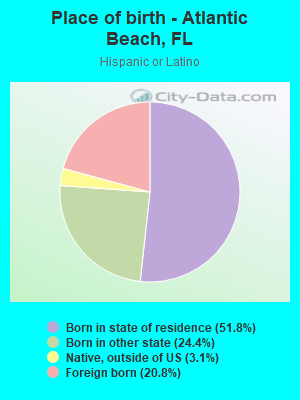
Place of birth - Born in state of residence (%)
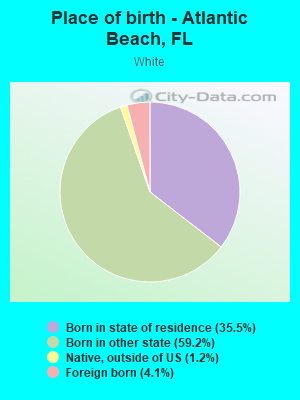
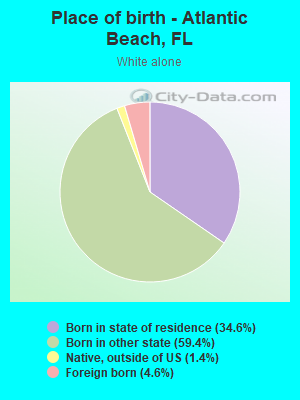
Place of birth - Born in state of residence (%) - White
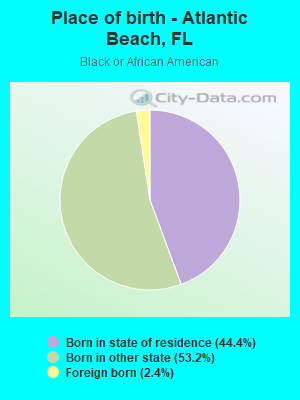
Place of birth - Born in state of residence (%) - Black or African American
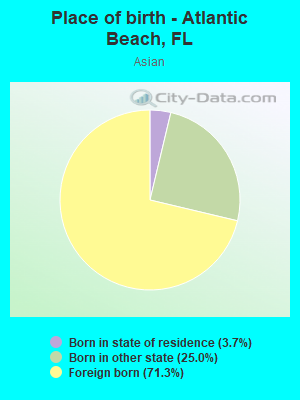
Place of birth - Born in state of residence (%) - Asian
Place of birth - Born in state of residence (%) - Hispanic or Latino
Place of birth - Born in state of residence (%) - American Indian and Alaska Native
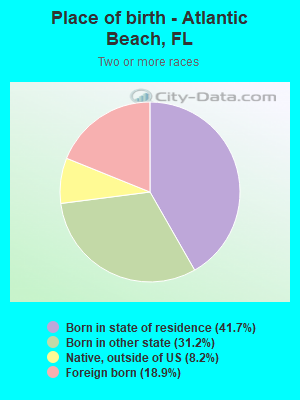
Place of birth - Born in state of residence (%) - Multirace
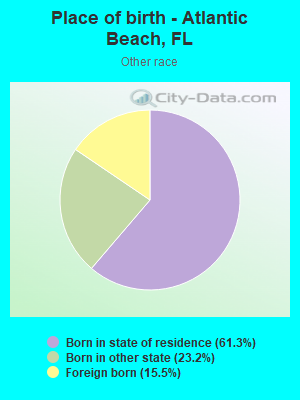
Place of birth - Born in state of residence (%) - Other Race
Place of birth - Born in other state (%)
Place of birth - Born in other state (%) - White
Place of birth - Born in other state (%) - Black or African American
Place of birth - Born in other state (%) - Asian
Place of birth - Born in other state (%) - Hispanic or Latino
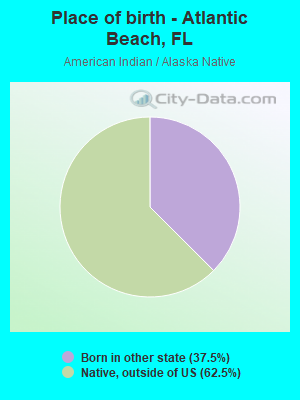
Place of birth - Born in other state (%) - American Indian and Alaska Native
Place of birth - Born in other state (%) - Multirace
Place of birth - Born in other state (%) - Other Race
Place of birth - Native, outside of US (%)
Place of birth - Native, outside of US (%) - White
Place of birth - Native, outside of US (%) - Black or African American
Place of birth - Native, outside of US (%) - Asian
Place of birth - Native, outside of US (%) - Hispanic or Latino
Place of birth - Native, outside of US (%) - American Indian and Alaska Native
Place of birth - Native, outside of US (%) - Multirace
Place of birth - Native, outside of US (%) - Other Race
Place of birth - Foreign born (%)
Place of birth - Foreign born (%) - White
Place of birth - Foreign born (%) - Black or African American
Place of birth - Foreign born (%) - Asian
Place of birth - Foreign born (%) - Hispanic or Latino
Place of birth - Foreign born (%) - American Indian and Alaska Native
Place of birth - Foreign born (%) - Multirace
Place of birth - Foreign born (%) - Other Race
Residents speaking English at home (%)
Residents speaking English at home - Born in the United States (%)
Residents speaking English at home - Native, born elsewhere (%)
Residents speaking English at home - Foreign born (%)
Residents speaking Spanish at home (%)
Residents speaking Spanish at home - Born in the United States (%)
Residents speaking Spanish at home - Native, born elsewhere (%)
Residents speaking Spanish at home - Foreign born (%)
Residents speaking other language at home (%)
Residents speaking other language at home - Born in the United States (%)
Residents speaking other language at home - Native, born elsewhere (%)
Residents speaking other language at home - Foreign born (%)
Marital status - Never married (%)
Marital status - Now married (%)
Marital status - Separated (%)
Marital status - Widowed (%)
Marital status - Divorced (%)
Ancestries Reported - Arab (%)
Ancestries Reported - Czech (%)
Ancestries Reported - Danish (%)
Ancestries Reported - Dutch (%)
Ancestries Reported - English (%)
Ancestries Reported - French (%)
Ancestries Reported - French Canadian (%)
Ancestries Reported - German (%)
Ancestries Reported - Greek (%)
Ancestries Reported - Hungarian (%)
Ancestries Reported - Irish (%)
Ancestries Reported - Italian (%)
Ancestries Reported - Lithuanian (%)
Ancestries Reported - Norwegian (%)
Ancestries Reported - Polish (%)
Ancestries Reported - Portuguese (%)
Ancestries Reported - Russian (%)
Ancestries Reported - Scotch-Irish (%)
Ancestries Reported - Scottish (%)
Ancestries Reported - Slovak (%)
Ancestries Reported - Subsaharan African (%)
Ancestries Reported - Swedish (%)
Ancestries Reported - Swiss (%)
Ancestries Reported - Ukrainian (%)
Ancestries Reported - United States (%)
Ancestries Reported - Welsh (%)
Ancestries Reported - West Indian (%)
Ancestries Reported - Other (%)
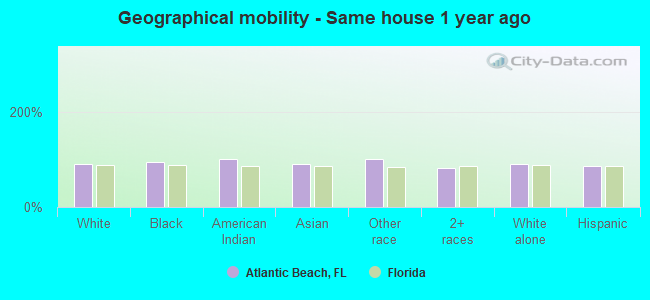
Geographical mobility - Same house 1 year ago (%)
Geographical mobility - Same house 1 year ago (%) - White
Geographical mobility - Same house 1 year ago (%) - Black or African American
Geographical mobility - Same house 1 year ago (%) - Asian
Geographical mobility - Same house 1 year ago (%) - Hispanic or Latino
Geographical mobility - Same house 1 year ago (%) - American Indian and Alaska Native
Geographical mobility - Same house 1 year ago (%) - Multirace
Geographical mobility - Same house 1 year ago (%) - Other Race
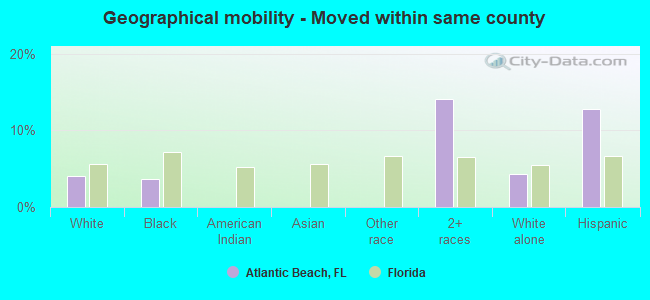
Geographical mobility - Moved within same county (%)
Geographical mobility - Moved within same county (%) - White
Geographical mobility - Moved within same county (%) - Black or African American
Geographical mobility - Moved within same county (%) - Asian
Geographical mobility - Moved within same county (%) - Hispanic or Latino
Geographical mobility - Moved within same county (%) - American Indian and Alaska Native
Geographical mobility - Moved within same county (%) - Multirace
Geographical mobility - Moved within same county (%) - Other Race
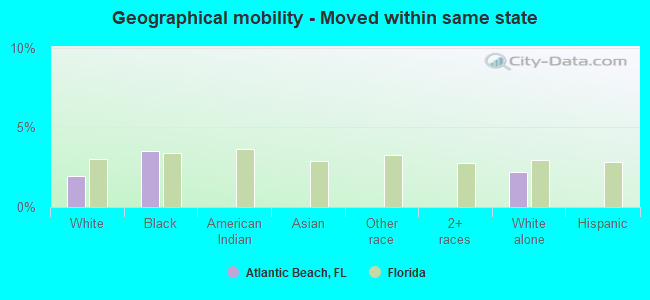
Geographical mobility - Moved from different county within same state (%)
Geographical mobility - Moved from different county within same state (%) - White
Geographical mobility - Moved from different county within same state (%) - Black or African American
Geographical mobility - Moved from different county within same state (%) - Asian
Geographical mobility - Moved from different county within same state (%) - Hispanic or Latino
Geographical mobility - Moved from different county within same state (%) - American Indian and Alaska Native
Geographical mobility - Moved from different county within same state (%) - Multirace
Geographical mobility - Moved from different county within same state (%) - Other Race
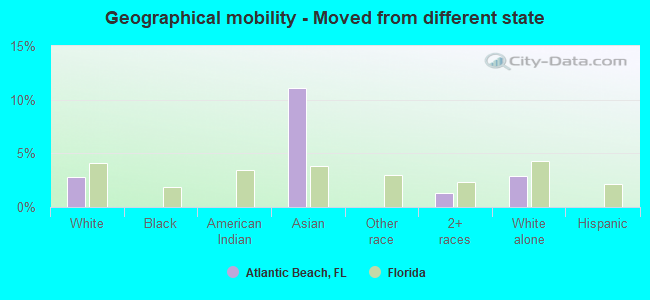
Geographical mobility - Moved from different state (%)
Geographical mobility - Moved from different state (%) - White
Geographical mobility - Moved from different state (%) - Black or African American
Geographical mobility - Moved from different state (%) - Asian
Geographical mobility - Moved from different state (%) - Hispanic or Latino
Geographical mobility - Moved from different state (%) - American Indian and Alaska Native
Geographical mobility - Moved from different state (%) - Multirace
Geographical mobility - Moved from different state (%) - Other Race
Geographical mobility - Moved from abroad (%)
Geographical mobility - Moved from abroad (%) - White
Geographical mobility - Moved from abroad (%) - Black or African American
Geographical mobility - Moved from abroad (%) - Asian
Geographical mobility - Moved from abroad (%) - Hispanic or Latino
Geographical mobility - Moved from abroad (%) - American Indian and Alaska Native
Geographical mobility - Moved from abroad (%) - Multirace
Geographical mobility - Moved from abroad (%) - Other Race
Place of birth for the foreign-born population - Ireland (%)
Place of birth for the foreign-born population - Denmark (%)
Place of birth for the foreign-born population - Norway (%)
Place of birth for the foreign-born population - Sweden (%)
Place of birth for the foreign-born population - United Kingdom (%)
Place of birth for the foreign-born population - England (%)
Place of birth for the foreign-born population - Scotland (%)
Place of birth for the foreign-born population - Other Northern Europe (%)
Place of birth for the foreign-born population - Austria (%)
Place of birth for the foreign-born population - Belgium (%)
Place of birth for the foreign-born population - France (%)
Place of birth for the foreign-born population - Germany (%)
Place of birth for the foreign-born population - Netherlands (%)
Place of birth for the foreign-born population - Switzerland (%)
Place of birth for the foreign-born population - Other Western Europe (%)
Place of birth for the foreign-born population - Greece (%)
Place of birth for the foreign-born population - Italy (%)
Place of birth for the foreign-born population - Portugal (%)
Place of birth for the foreign-born population - Spain (%)
Place of birth for the foreign-born population - Other Southern Europe (%)
Place of birth for the foreign-born population - Albania (%)
Place of birth for the foreign-born population - Belarus (%)
Place of birth for the foreign-born population - Bosnia and Herzegovina (%)
Place of birth for the foreign-born population - Bulgaria (%)
Place of birth for the foreign-born population - Croatia (%)
Place of birth for the foreign-born population - Czechoslovakia (%)
Place of birth for the foreign-born population - Hungary (%)
Place of birth for the foreign-born population - Latvia (%)
Place of birth for the foreign-born population - Lithuania (%)
Place of birth for the foreign-born population - North Macedonia (Macedonia) (%)
Place of birth for the foreign-born population - Moldova (%)
Place of birth for the foreign-born population - Poland (%)
Place of birth for the foreign-born population - Romania (%)
Place of birth for the foreign-born population - Russia (%)
Place of birth for the foreign-born population - Serbia (%)
Place of birth for the foreign-born population - Ukraine (%)
Place of birth for the foreign-born population - Other Eastern Europe (%)
Place of birth for the foreign-born population - China (%)
Place of birth for the foreign-born population - Hong Kong (%)
Place of birth for the foreign-born population - Taiwan (%)
Place of birth for the foreign-born population - Japan (%)
Place of birth for the foreign-born population - Korea (%)
Place of birth for the foreign-born population - Other Eastern Asia (%)
Place of birth for the foreign-born population - Afghanistan (%)
Place of birth for the foreign-born population - Bangladesh (%)
Place of birth for the foreign-born population - India (%)
Place of birth for the foreign-born population - Iran (%)
Place of birth for the foreign-born population - Kazakhstan (%)
Place of birth for the foreign-born population - Nepal (%)
Place of birth for the foreign-born population - Pakistan (%)
Place of birth for the foreign-born population - Sri Lanka (%)
Place of birth for the foreign-born population - Uzbekistan (%)
Place of birth for the foreign-born population - Other South Central Asia (%)
Place of birth for the foreign-born population - Burma (%)
Place of birth for the foreign-born population - Cambodia (%)
Place of birth for the foreign-born population - Indonesia (%)
Place of birth for the foreign-born population - Laos (%)
Place of birth for the foreign-born population - Malaysia (%)
Place of birth for the foreign-born population - Philippines (%)
Place of birth for the foreign-born population - Singapore (%)
Place of birth for the foreign-born population - Thailand (%)
Place of birth for the foreign-born population - Vietnam (%)
Place of birth for the foreign-born population - Other South Eastern Asia (%)
Place of birth for the foreign-born population - Armenia (%)
Place of birth for the foreign-born population - Iraq (%)
Place of birth for the foreign-born population - Israel (%)
Place of birth for the foreign-born population - Jordan (%)
Place of birth for the foreign-born population - Kuwait (%)
Place of birth for the foreign-born population - Lebanon (%)
Place of birth for the foreign-born population - Saudi Arabia (%)
Place of birth for the foreign-born population - Syria (%)
Place of birth for the foreign-born population - Turkey (%)
Place of birth for the foreign-born population - Yemen (%)
Place of birth for the foreign-born population - Other Western Asia (%)
Place of birth for the foreign-born population - Eritrea (%)
Place of birth for the foreign-born population - Ethiopia (%)
Place of birth for the foreign-born population - Kenya (%)
Place of birth for the foreign-born population - Somalia (%)
Place of birth for the foreign-born population - Uganda (%)
Place of birth for the foreign-born population - Zimbabwe (%)
Place of birth for the foreign-born population - Other Eastern Africa (%)
Place of birth for the foreign-born population - Cameroon (%)
Place of birth for the foreign-born population - Congo (%)
Place of birth for the foreign-born population - Democratic Republic of Congo (Zaire) (%)
Place of birth for the foreign-born population - Other Middle Africa (%)
Place of birth for the foreign-born population - Egypt (%)
Place of birth for the foreign-born population - Morocco (%)
Place of birth for the foreign-born population - Sudan (%)
Place of birth for the foreign-born population - Other Northern Africa (%)
Place of birth for the foreign-born population - South Africa (%)
Place of birth for the foreign-born population - Other Southern Africa (%)
Place of birth for the foreign-born population - Cabo Verde (%)
Place of birth for the foreign-born population - Ghana (%)
Place of birth for the foreign-born population - Liberia (%)
Place of birth for the foreign-born population - Nigeria (%)
Place of birth for the foreign-born population - Senegal (%)
Place of birth for the foreign-born population - Sierra Leone (%)
Place of birth for the foreign-born population - Other Western Africa (%)
Place of birth for the foreign-born population - Australia (%)
Place of birth for the foreign-born population - New Zealand (%)
Place of birth for the foreign-born population - Fiji (%)
Place of birth for the foreign-born population - Micronesia (%)
Place of birth for the foreign-born population - Bahamas (%)
Place of birth for the foreign-born population - Barbados (%)
Place of birth for the foreign-born population - Cuba (%)
Place of birth for the foreign-born population - Dominica (%)
Place of birth for the foreign-born population - Dominican Republic (%)
Place of birth for the foreign-born population - Grenada (%)
Place of birth for the foreign-born population - Haiti (%)
Place of birth for the foreign-born population - Jamaica (%)
Place of birth for the foreign-born population - St. Vincent and the Grenadines (%)
Place of birth for the foreign-born population - Trinidad and Tobago (%)
Place of birth for the foreign-born population - West Indies (%)
Place of birth for the foreign-born population - Other Caribbean (%)
Place of birth for the foreign-born population - Belize (%)
Place of birth for the foreign-born population - Costa Rica (%)
Place of birth for the foreign-born population - El Salvador (%)
Place of birth for the foreign-born population - Guatemala (%)
Place of birth for the foreign-born population - Honduras (%)
Place of birth for the foreign-born population - Mexico (%)
Place of birth for the foreign-born population - Nicaragua (%)
Place of birth for the foreign-born population - Panama (%)
Place of birth for the foreign-born population - Other Central America (%)
Place of birth for the foreign-born population - Argentina (%)
Place of birth for the foreign-born population - Bolivia (%)
Place of birth for the foreign-born population - Brazil (%)
Place of birth for the foreign-born population - Chile (%)
Place of birth for the foreign-born population - Colombia (%)
Place of birth for the foreign-born population - Ecuador (%)
Place of birth for the foreign-born population - Guyana (%)
Place of birth for the foreign-born population - Peru (%)
Place of birth for the foreign-born population - Uruguay (%)
Place of birth for the foreign-born population - Venezuela (%)
Place of birth for the foreign-born population - Other South America (%)
Place of birth for the foreign-born population - Canada (%)
Place of birth for the foreign-born population - Other Northern America (%)
Place of birth for the foreign-born population - Other (%)
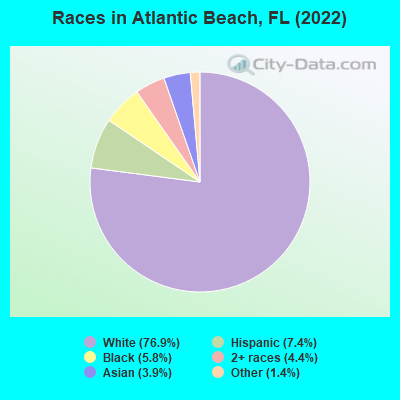
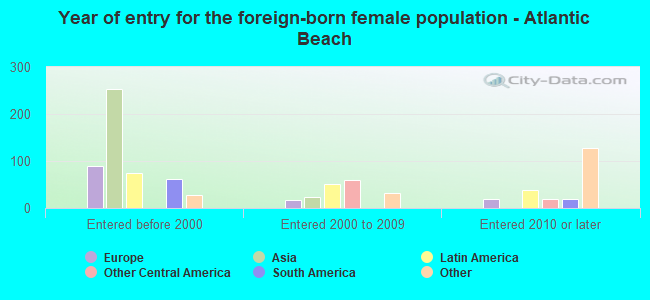
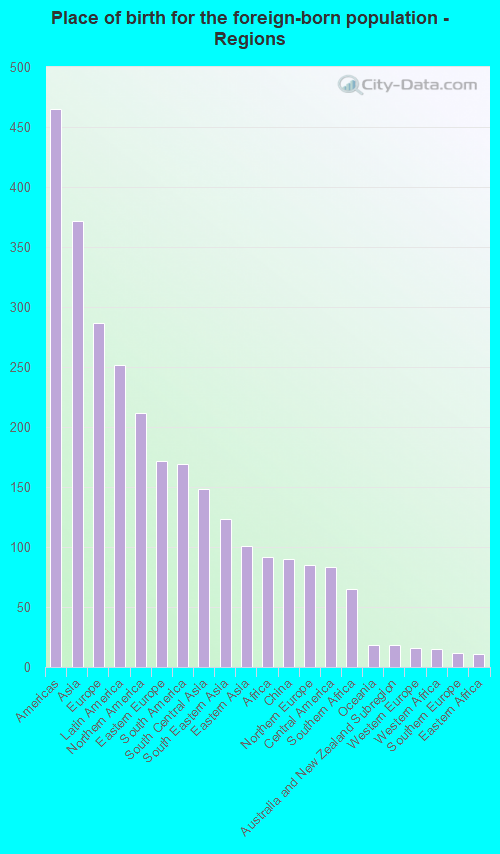
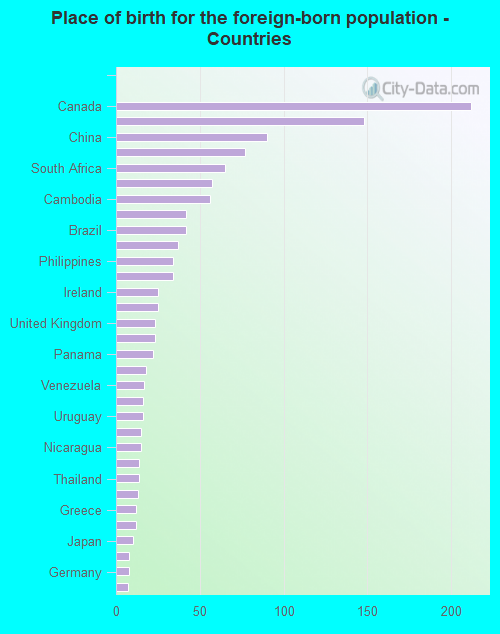
According to 2022 data, the most numerous races in Atlantic Beach, FL are White alone (10,506 residents), Hispanic (1,010 residents), and Black alone (797 residents). 91.5% of Atlantic Beach residents speak English at home. 9.1% of Atlantic Beach, FL residents are foreign-born (2.6% born in Asia, 2.0% born in Europe, 1.8% born in Latin America, 1.5% born in North America), which is 131.9% less than the foreign-born rate of 21.0% across the entire state of Florida.
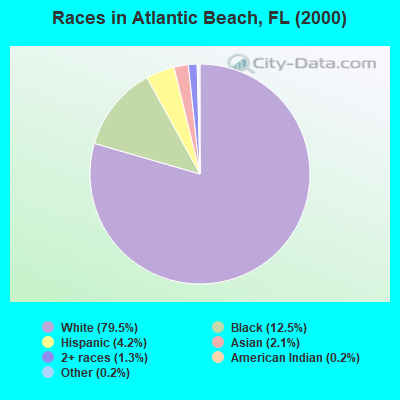
Race distribution in Atlantic Beach
2000 2022
10,458,509 65.4% White alone 2,682,715 16.8% Hispanic 2,264,268 14.2% Black alone 261,693 1.6% Asian alone 236,954 1.5% Two or more races 42,358 0.3% American Indian alone 28,994 0.2% Other race alone 6,887 0.04% Native Hawaiian and Other
11,309,403 50.8% White alone 6,025,039 27.1% Hispanic 3,241,015 14.6% Black alone 861,630 3.9% Two or more races 623,692 2.8% Asian alone 152,054 0.7% Other race alone 22,504 0.1% American Indian alone 9,486 0.04% Native Hawaiian and Other
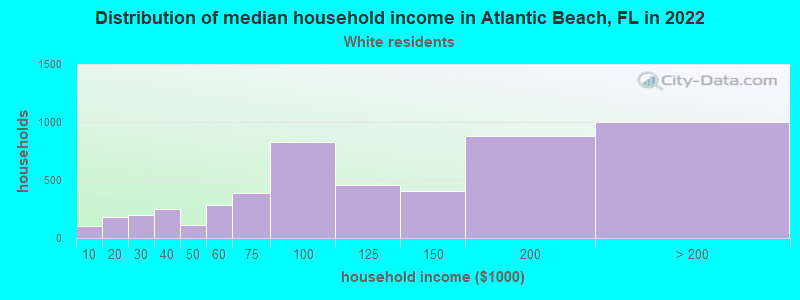
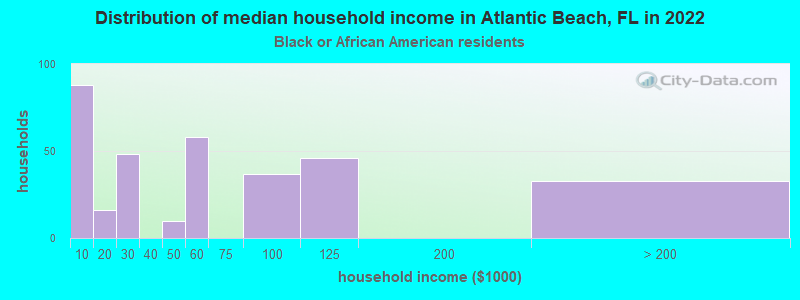
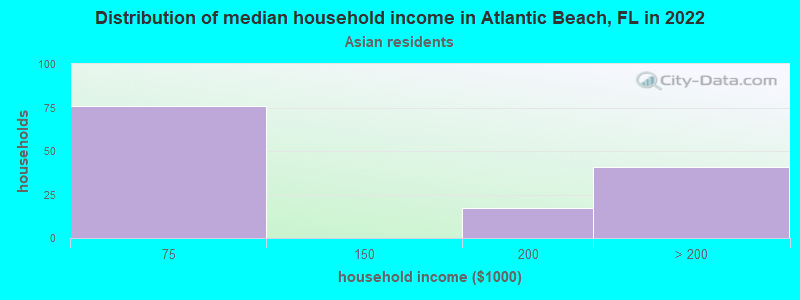
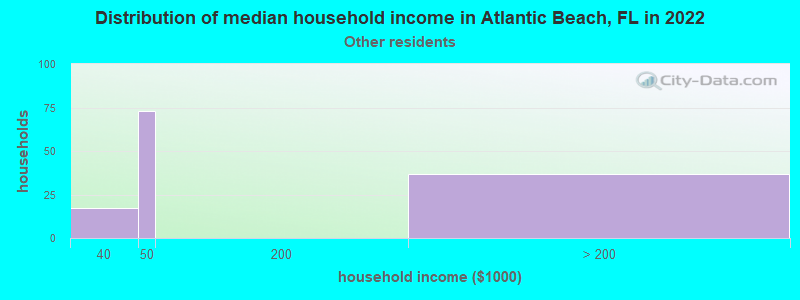
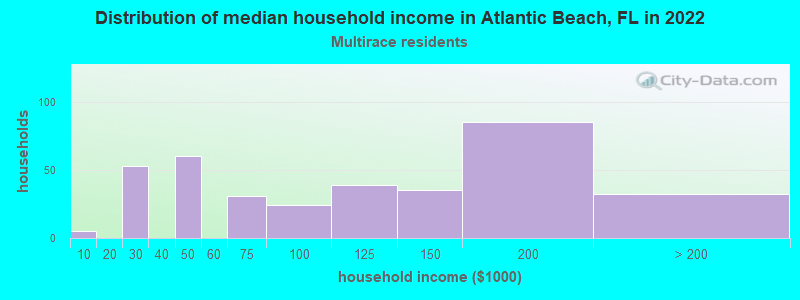
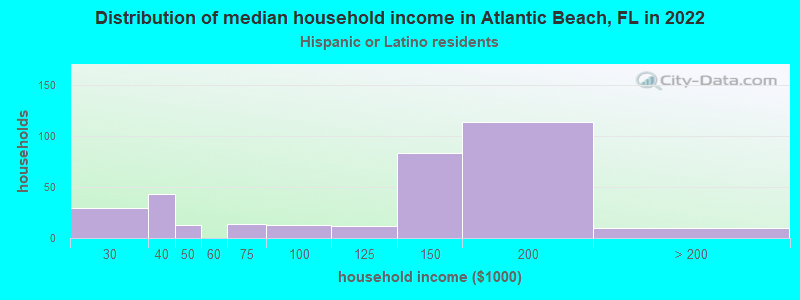
Income and house value in Atlantic Beach Median household income in 2022 $108,502 White non-Hispanic householders$102,284 Two or more races householders$144,148 Hispanic or Latino race householdersMedian 2022 house value $721,217 White Non-Hispanic householders$247,154 Black or African American householdersover $1,000,000 American Indian or Alaska Native householders $278,096 Asian householders$270,074 Some other race householders$339,980 Two or more races householders$330,812 Hispanic or Latino householders
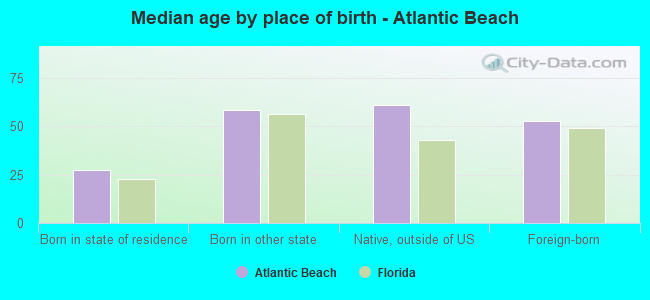
Median age by race in Atlantic Beach
50.9 Median age for White residents51.7 50.5 55.8 Median age for Black or African American residents63.0 48.1 20.2 Median age for American Indian / Alaska Native residents-546,423,134.9 -608,150,469.6 52.4 Median age for Asian residents50.0 52.8 -800,347,221.4 Median age for Native Hawaiian / Pacific Islander residents-1,214,756,257.0 -443,298,968.6 36.3 Median age for Other race residents37.9 35.6 29.4 Median age for Two or more races residents25.4 40.4 50.7 Median age for White alone residents51.7 50.5 26.5 Median age for Hispanic or Latino residents26.3 29.4
Owner/renter occupied households by race in Atlantic Beach
House owners and renters - White residents 3,697 73.6% Owner occupied1,326 26.4% Renter occupiedHouse owners and renters - Black or African American residents 262 76.6% Owner occupied80 23.4% Renter occupiedHouse owners and renters - American Indian / Alaska Native residents 2 100.0% Owner occupiedHouse owners and renters - Asian residents 65 45.6% Owner occupied77 54.4% Renter occupiedHouse owners and renters - Other race residents 58 47.7% Owner occupied63 52.3% Renter occupiedHouse owners and renters - Two or more races residents 296 78.7% Owner occupied80 21.3% Renter occupiedHouse owners and renters - White alone residents 3,711 74.4% Owner occupied1,280 25.6% Renter occupiedHouse owners and renters - Hispanic or Latino residents 149 50.4% Owner occupied147 49.6% Renter occupied
Language usage in Atlantic Beach
English speakers - Total 91.5% of residents of Atlantic Beach speak English at home.
4.0% of residents speak Spanish at home 430 83.3% Speak English very well86 16.7% Speak English less than very well3.6% of residents speak other language at home 439 93.2% Speak English very well32 6.8% Speak English less than very well
English speakers - Born in the United States 97.4% of residents of Atlantic Beach speak English at home.
1.5% of residents speak Spanish at home 102 93.6% Speak English very well7 6.4% Speak English less than very well0.9% of residents speak other language at home 63 100.0% Speak English very well
English speakers - Native, born elsewhere 94.0% of residents of Atlantic Beach speak English at home.
11.6% of residents speak other language at home 31 100.0% Speak English very well
English speakers - Foreign-born 43.7% of residents of Atlantic Beach speak English at home.
25.3% of residents speak Spanish at home 268 84.5% Speak English very well49 15.5% Speak English less than very well28.4% of residents speak other language at home 324 91.0% Speak English very well32 9.0% Speak English less than very well
White (Caucasian) - Speak only English Native:
99.9% (9,576)Foreign-born:
86.0% (369)
White (Caucasian) - Speak another language Native:
1.2% (110)Foreign-born:
23.5% (101)
Asian - Speak only English Native:
100.0% (139)Foreign-born:
20.9% (82)
Other race - Speak another language Native:
34.8% (105)Foreign-born:
99.0% (63)
Two or more races - Speak only English Native:
87.8% (912)Foreign-born:
13.5% (33)
Two or more races - Speak another language Native:
8.0% (83)Foreign-born:
73.7% (181)
White alone - Speak only English Native:
98.6% (9,385)Foreign-born:
81.0% (387)
White alone - Speak another language Native:
1.3% (122)Foreign-born:
24.5% (117)
Hispanic or Latino - Speak only English Native:
82.1% (605)Foreign-born:
21.4% (45)
Hispanic or Latino - Speak another language Native:
19.9% (147)Foreign-born:
71.9% (151)
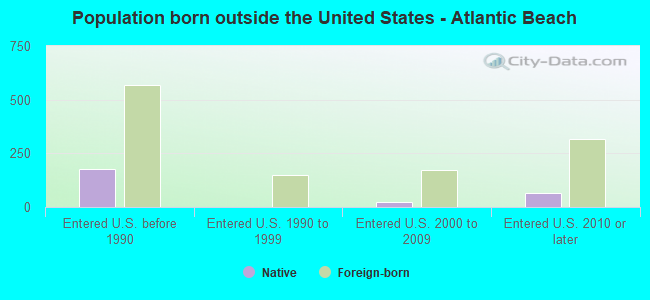
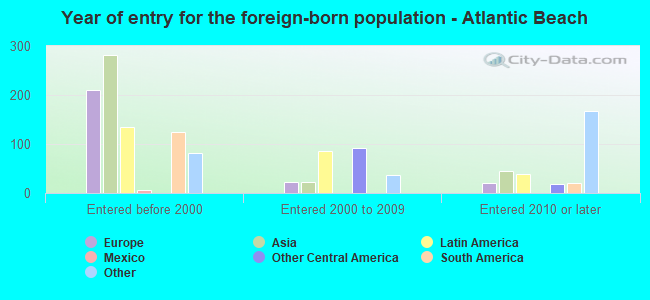
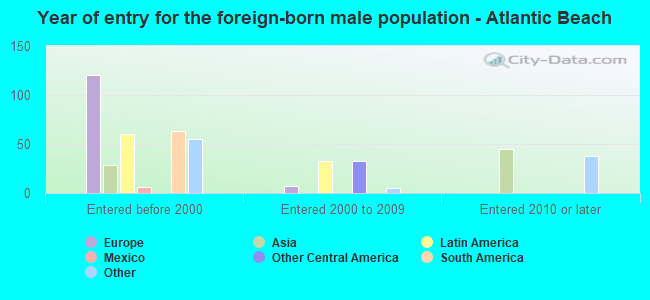
Foreign-born residents in Atlantic Beach 1,237 residents are foreign born (2.6% Asia , 2.0% Europe , 1.8% Latin America , 1.5% North America ).
This city:
9.1%Florida:
21.1%
Marital status for residents in Atlantic Beach Marital status - White (Caucasian) population 15 years and over
Males 24.8% Never married61.5% Now married0.2% Separated4.6% Widowed9.0% DivorcedFemales 22.4% Never married53.6% Now married1.5% Separated9.2% Widowed13.3% DivorcedWomen who gave birth in the past 12 months Now married:
100.0% (181)Unmarried:
0.0% (0)
Women who did not give birth in the past 12 months Now married:
44.7% (873)Unmarried:
55.3% (1,081)
Marital status - Black or African American population 15 years and over
Males 30.4% Never married58.0% Now married0.0% Separated3.5% Widowed8.1% DivorcedFemales 54.0% Never married19.3% Now married0.0% Separated23.2% Widowed3.5% DivorcedWomen who did not give birth in the past 12 months Now married:
23.7% (23)Unmarried:
76.3% (73)
Marital status - American Indian / Alaska Native population 15 years and over
Males 70.0% Never married30.0% Now married0.0% Separated0.0% Widowed0.0% DivorcedFemales 100.0% Never married0.0% Now married0.0% Separated0.0% Widowed0.0% DivorcedWomen who did not give birth in the past 12 months Now married:
0.0% (0)Unmarried:
100.0% (3)
Marital status - Asian population 15 years and over
Males 25.3% Never married74.7% Now married0.0% Separated0.0% Widowed0.0% DivorcedFemales 4.7% Never married76.0% Now married0.0% Separated0.0% Widowed19.4% DivorcedWomen who did not give birth in the past 12 months Now married:
67.7% (66)Unmarried:
32.3% (32)
Marital status - Other race population 15 years and over
Males 43.8% Never married56.3% Now married0.0% Separated0.0% Widowed0.0% DivorcedFemales 12.3% Never married71.5% Now married16.2% Separated0.0% Widowed0.0% DivorcedWomen who gave birth in the past 12 months Now married:
100.0% (19)Unmarried:
0.0% (0)
Women who did not give birth in the past 12 months Now married:
83.5% (103)Unmarried:
16.5% (20)
Marital status - Two or more races population 15 years and over
Males 51.8% Never married43.3% Now married0.0% Separated0.0% Widowed4.9% DivorcedFemales 34.6% Never married29.3% Now married1.4% Separated5.5% Widowed29.1% DivorcedWomen who did not give birth in the past 12 months Now married:
30.0% (85)Unmarried:
70.0% (199)
Marital status - White alone, not Hispanic / Latino population 15 years and over
Males 24.0% Never married61.9% Now married0.2% Separated4.7% Widowed9.2% DivorcedFemales 22.4% Never married53.3% Now married1.6% Separated9.4% Widowed13.3% DivorcedWomen who gave birth in the past 12 months Now married:
100.0% (187)Unmarried:
0.0% (0)
Women who did not give birth in the past 12 months Now married:
44.0% (868)Unmarried:
56.0% (1,104)
Marital status - Hispanic or Latino population 15 years and over
Males 57.6% Never married42.4% Now married0.0% Separated0.0% Widowed0.0% DivorcedFemales 33.2% Never married51.2% Now married5.5% Separated4.2% Widowed6.0% DivorcedWomen who gave birth in the past 12 months Now married:
100.0% (16)Unmarried:
0.0% (0)
Women who did not give birth in the past 12 months Now married:
51.9% (150)Unmarried:
48.1% (139)
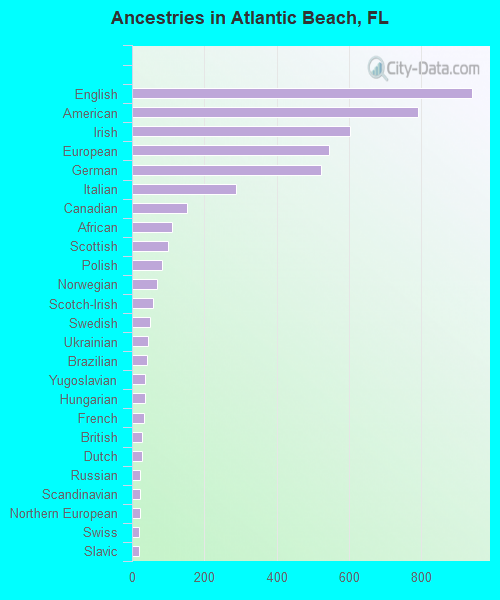
Ancestries in Atlantic Beach
941 14.6% English791 12.3% American602 9.3% Irish546 8.5% European523 8.1% German287 4.5% Italian151 2.3% Canadian111 1.7% African100 1.6% Scottish82 1.3% Polish68 1.1% Norwegian59 0.9% Scotch-Irish49 0.8% Swedish44 0.7% Ukrainian41 0.6% Brazilian37 0.6% Yugoslavian35 0.5% Hungarian33 0.5% French29 0.5% British29 0.5% Dutch23 0.4% Russian23 0.4% Scandinavian21 0.3% Northern European20 0.3% Swiss18 0.3% Slavic16 0.2% Belgian16 0.2% Croatian14 0.2% Portuguese14 0.2% Czech13 0.2% Greek13 0.2% Danish11 0.2% French Canadian10 0.2% Celtic9 0.1% Eastern European7 0.1% Serbian7 0.1% Czechoslovakian
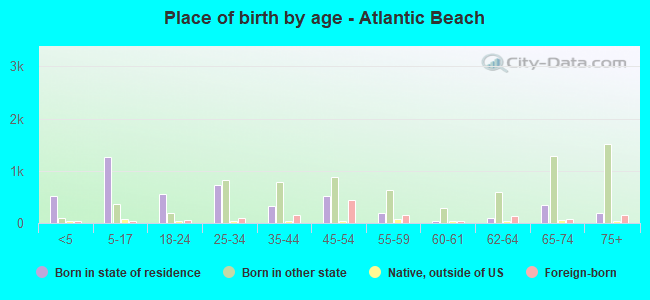
Children Nativity (place of birth) in Atlantic Beach
Children under 6 years - Living with two parents Both parents native 493 100.0% NativeBoth parents foreign-born 5 100.0% Foreign-bornOne native, one foreign-born parent 94 100.0% NativeChildren under 6 years - Living with one parent Native parent 157 100.0% NativeForeign-born parent 7 100.0% NativeChildren 6 to 17 years - Living with two parents Both parents native 993 98.5% Native15 1.5% Foreign-bornBoth parents foreign-born 11 100.0% Foreign-bornOne native, one foreign-born parent 108 100.0% NativeChildren 6 to 17 years - Living with one parent Native parent 349 100.0% NativeForeign-born parent 9 46.9% Native11 53.1% Foreign-born
Grandparents responsible for own grandchildren in Atlantic Beach
Grandparents (30 to 59 years) White / Caucasian 68 84.2% Responsible for grandchildren13 15.8% Not responsible for grandchildrenWhite alone, not Hispanic / Latino 69 83.9% Responsible for grandchildren13 16.1% Not responsible for grandchildrenGrandparents (60 years and over) White / Caucasian 10 17.3% Responsible for grandchildren46 82.7% Not responsible for grandchildrenWhite alone, not Hispanic / Latino 10 17.5% Responsible for grandchildren47 82.5% Not responsible for grandchildren