Races in Auburn Hills, Michigan (MI) Detailed Stats
Data:
Races - White alone (%)
Races - White alone (% change since 2000)
Races - Black alone (%)
Races - Black alone (% change since 2000)
Races - American Indian alone (%)
Races - American Indian alone (% change since 2000)
Races - Asian alone (%)
Races - Asian alone (% change since 2000)
Races - Hispanic (%)
Races - Hispanic (% change since 2000)
Races - Native Hawaiian and Other Pacific Islander alone (%)
Races - Native Hawaiian and Other Pacific Islander alone (% change since 2000)
Races - Two or more races(%)
Races - Two or more races(% change since 2000)
Races - Other race alone (%)
Races - Other race alone (% change since 2000)
Racial diversity
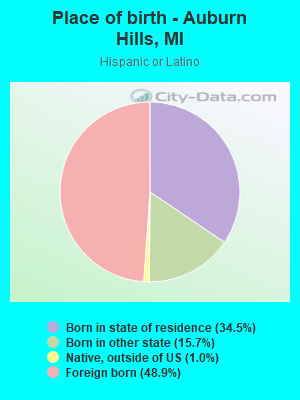
Place of birth - Born in state of residence (%)
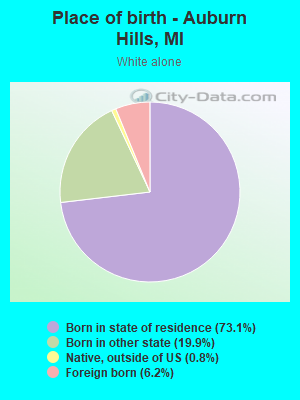
Place of birth - Born in state of residence (%) - White
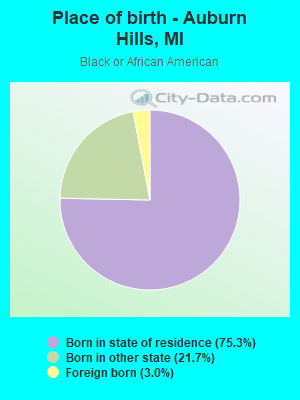
Place of birth - Born in state of residence (%) - Black or African American
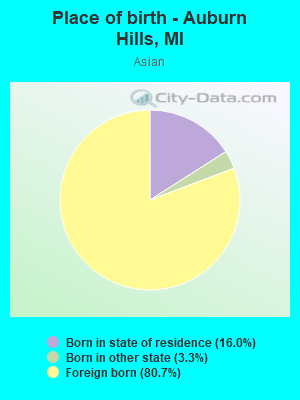
Place of birth - Born in state of residence (%) - Asian
Place of birth - Born in state of residence (%) - Hispanic or Latino
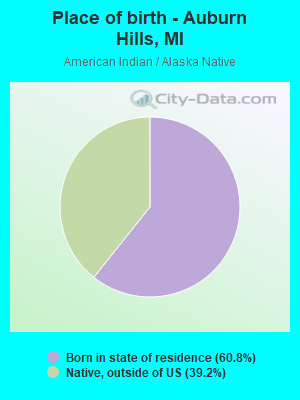
Place of birth - Born in state of residence (%) - American Indian and Alaska Native
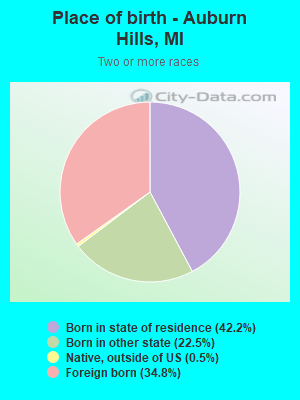
Place of birth - Born in state of residence (%) - Multirace
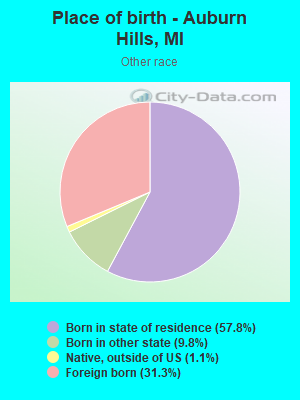
Place of birth - Born in state of residence (%) - Other Race
Place of birth - Born in other state (%)
Place of birth - Born in other state (%) - White
Place of birth - Born in other state (%) - Black or African American
Place of birth - Born in other state (%) - Asian
Place of birth - Born in other state (%) - Hispanic or Latino
Place of birth - Born in other state (%) - American Indian and Alaska Native
Place of birth - Born in other state (%) - Multirace
Place of birth - Born in other state (%) - Other Race
Place of birth - Native, outside of US (%)
Place of birth - Native, outside of US (%) - White
Place of birth - Native, outside of US (%) - Black or African American
Place of birth - Native, outside of US (%) - Asian
Place of birth - Native, outside of US (%) - Hispanic or Latino
Place of birth - Native, outside of US (%) - American Indian and Alaska Native
Place of birth - Native, outside of US (%) - Multirace
Place of birth - Native, outside of US (%) - Other Race
Place of birth - Foreign born (%)
Place of birth - Foreign born (%) - White
Place of birth - Foreign born (%) - Black or African American
Place of birth - Foreign born (%) - Asian
Place of birth - Foreign born (%) - Hispanic or Latino
Place of birth - Foreign born (%) - American Indian and Alaska Native
Place of birth - Foreign born (%) - Multirace
Place of birth - Foreign born (%) - Other Race
Residents speaking English at home (%)
Residents speaking English at home - Born in the United States (%)
Residents speaking English at home - Native, born elsewhere (%)
Residents speaking English at home - Foreign born (%)
Residents speaking Spanish at home (%)
Residents speaking Spanish at home - Born in the United States (%)
Residents speaking Spanish at home - Native, born elsewhere (%)
Residents speaking Spanish at home - Foreign born (%)
Residents speaking other language at home (%)
Residents speaking other language at home - Born in the United States (%)
Residents speaking other language at home - Native, born elsewhere (%)
Residents speaking other language at home - Foreign born (%)
Marital status - Never married (%)
Marital status - Now married (%)
Marital status - Separated (%)
Marital status - Widowed (%)
Marital status - Divorced (%)
Ancestries Reported - Arab (%)
Ancestries Reported - Czech (%)
Ancestries Reported - Danish (%)
Ancestries Reported - Dutch (%)
Ancestries Reported - English (%)
Ancestries Reported - French (%)
Ancestries Reported - French Canadian (%)
Ancestries Reported - German (%)
Ancestries Reported - Greek (%)
Ancestries Reported - Hungarian (%)
Ancestries Reported - Irish (%)
Ancestries Reported - Italian (%)
Ancestries Reported - Lithuanian (%)
Ancestries Reported - Norwegian (%)
Ancestries Reported - Polish (%)
Ancestries Reported - Portuguese (%)
Ancestries Reported - Russian (%)
Ancestries Reported - Scotch-Irish (%)
Ancestries Reported - Scottish (%)
Ancestries Reported - Slovak (%)
Ancestries Reported - Subsaharan African (%)
Ancestries Reported - Swedish (%)
Ancestries Reported - Swiss (%)
Ancestries Reported - Ukrainian (%)
Ancestries Reported - United States (%)
Ancestries Reported - Welsh (%)
Ancestries Reported - West Indian (%)
Ancestries Reported - Other (%)
Geographical mobility - Same house 1 year ago (%)
Geographical mobility - Same house 1 year ago (%) - White
Geographical mobility - Same house 1 year ago (%) - Black or African American
Geographical mobility - Same house 1 year ago (%) - Asian
Geographical mobility - Same house 1 year ago (%) - Hispanic or Latino
Geographical mobility - Same house 1 year ago (%) - American Indian and Alaska Native
Geographical mobility - Same house 1 year ago (%) - Multirace
Geographical mobility - Same house 1 year ago (%) - Other Race
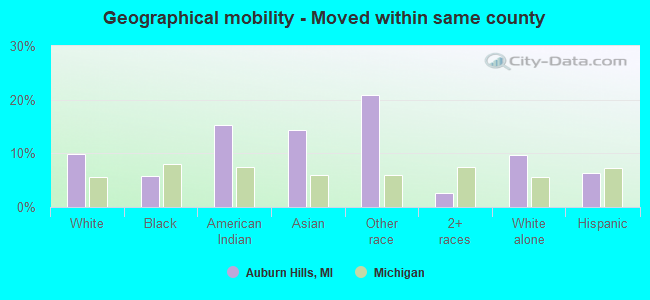
Geographical mobility - Moved within same county (%)
Geographical mobility - Moved within same county (%) - White
Geographical mobility - Moved within same county (%) - Black or African American
Geographical mobility - Moved within same county (%) - Asian
Geographical mobility - Moved within same county (%) - Hispanic or Latino
Geographical mobility - Moved within same county (%) - American Indian and Alaska Native
Geographical mobility - Moved within same county (%) - Multirace
Geographical mobility - Moved within same county (%) - Other Race
Geographical mobility - Moved from different county within same state (%)
Geographical mobility - Moved from different county within same state (%) - White
Geographical mobility - Moved from different county within same state (%) - Black or African American
Geographical mobility - Moved from different county within same state (%) - Asian
Geographical mobility - Moved from different county within same state (%) - Hispanic or Latino
Geographical mobility - Moved from different county within same state (%) - American Indian and Alaska Native
Geographical mobility - Moved from different county within same state (%) - Multirace
Geographical mobility - Moved from different county within same state (%) - Other Race
Geographical mobility - Moved from different state (%)
Geographical mobility - Moved from different state (%) - White
Geographical mobility - Moved from different state (%) - Black or African American
Geographical mobility - Moved from different state (%) - Asian
Geographical mobility - Moved from different state (%) - Hispanic or Latino
Geographical mobility - Moved from different state (%) - American Indian and Alaska Native
Geographical mobility - Moved from different state (%) - Multirace
Geographical mobility - Moved from different state (%) - Other Race
Geographical mobility - Moved from abroad (%)
Geographical mobility - Moved from abroad (%) - White
Geographical mobility - Moved from abroad (%) - Black or African American
Geographical mobility - Moved from abroad (%) - Asian
Geographical mobility - Moved from abroad (%) - Hispanic or Latino
Geographical mobility - Moved from abroad (%) - American Indian and Alaska Native
Geographical mobility - Moved from abroad (%) - Multirace
Geographical mobility - Moved from abroad (%) - Other Race
Place of birth for the foreign-born population - Ireland (%)
Place of birth for the foreign-born population - Denmark (%)
Place of birth for the foreign-born population - Norway (%)
Place of birth for the foreign-born population - Sweden (%)
Place of birth for the foreign-born population - United Kingdom (%)
Place of birth for the foreign-born population - England (%)
Place of birth for the foreign-born population - Scotland (%)
Place of birth for the foreign-born population - Other Northern Europe (%)
Place of birth for the foreign-born population - Austria (%)
Place of birth for the foreign-born population - Belgium (%)
Place of birth for the foreign-born population - France (%)
Place of birth for the foreign-born population - Germany (%)
Place of birth for the foreign-born population - Netherlands (%)
Place of birth for the foreign-born population - Switzerland (%)
Place of birth for the foreign-born population - Other Western Europe (%)
Place of birth for the foreign-born population - Greece (%)
Place of birth for the foreign-born population - Italy (%)
Place of birth for the foreign-born population - Portugal (%)
Place of birth for the foreign-born population - Spain (%)
Place of birth for the foreign-born population - Other Southern Europe (%)
Place of birth for the foreign-born population - Albania (%)
Place of birth for the foreign-born population - Belarus (%)
Place of birth for the foreign-born population - Bosnia and Herzegovina (%)
Place of birth for the foreign-born population - Bulgaria (%)
Place of birth for the foreign-born population - Croatia (%)
Place of birth for the foreign-born population - Czechoslovakia (%)
Place of birth for the foreign-born population - Hungary (%)
Place of birth for the foreign-born population - Latvia (%)
Place of birth for the foreign-born population - Lithuania (%)
Place of birth for the foreign-born population - North Macedonia (Macedonia) (%)
Place of birth for the foreign-born population - Moldova (%)
Place of birth for the foreign-born population - Poland (%)
Place of birth for the foreign-born population - Romania (%)
Place of birth for the foreign-born population - Russia (%)
Place of birth for the foreign-born population - Serbia (%)
Place of birth for the foreign-born population - Ukraine (%)
Place of birth for the foreign-born population - Other Eastern Europe (%)
Place of birth for the foreign-born population - China (%)
Place of birth for the foreign-born population - Hong Kong (%)
Place of birth for the foreign-born population - Taiwan (%)
Place of birth for the foreign-born population - Japan (%)
Place of birth for the foreign-born population - Korea (%)
Place of birth for the foreign-born population - Other Eastern Asia (%)
Place of birth for the foreign-born population - Afghanistan (%)
Place of birth for the foreign-born population - Bangladesh (%)
Place of birth for the foreign-born population - India (%)
Place of birth for the foreign-born population - Iran (%)
Place of birth for the foreign-born population - Kazakhstan (%)
Place of birth for the foreign-born population - Nepal (%)
Place of birth for the foreign-born population - Pakistan (%)
Place of birth for the foreign-born population - Sri Lanka (%)
Place of birth for the foreign-born population - Uzbekistan (%)
Place of birth for the foreign-born population - Other South Central Asia (%)
Place of birth for the foreign-born population - Burma (%)
Place of birth for the foreign-born population - Cambodia (%)
Place of birth for the foreign-born population - Indonesia (%)
Place of birth for the foreign-born population - Laos (%)
Place of birth for the foreign-born population - Malaysia (%)
Place of birth for the foreign-born population - Philippines (%)
Place of birth for the foreign-born population - Singapore (%)
Place of birth for the foreign-born population - Thailand (%)
Place of birth for the foreign-born population - Vietnam (%)
Place of birth for the foreign-born population - Other South Eastern Asia (%)
Place of birth for the foreign-born population - Armenia (%)
Place of birth for the foreign-born population - Iraq (%)
Place of birth for the foreign-born population - Israel (%)
Place of birth for the foreign-born population - Jordan (%)
Place of birth for the foreign-born population - Kuwait (%)
Place of birth for the foreign-born population - Lebanon (%)
Place of birth for the foreign-born population - Saudi Arabia (%)
Place of birth for the foreign-born population - Syria (%)
Place of birth for the foreign-born population - Turkey (%)
Place of birth for the foreign-born population - Yemen (%)
Place of birth for the foreign-born population - Other Western Asia (%)
Place of birth for the foreign-born population - Eritrea (%)
Place of birth for the foreign-born population - Ethiopia (%)
Place of birth for the foreign-born population - Kenya (%)
Place of birth for the foreign-born population - Somalia (%)
Place of birth for the foreign-born population - Uganda (%)
Place of birth for the foreign-born population - Zimbabwe (%)
Place of birth for the foreign-born population - Other Eastern Africa (%)
Place of birth for the foreign-born population - Cameroon (%)
Place of birth for the foreign-born population - Congo (%)
Place of birth for the foreign-born population - Democratic Republic of Congo (Zaire) (%)
Place of birth for the foreign-born population - Other Middle Africa (%)
Place of birth for the foreign-born population - Egypt (%)
Place of birth for the foreign-born population - Morocco (%)
Place of birth for the foreign-born population - Sudan (%)
Place of birth for the foreign-born population - Other Northern Africa (%)
Place of birth for the foreign-born population - South Africa (%)
Place of birth for the foreign-born population - Other Southern Africa (%)
Place of birth for the foreign-born population - Cabo Verde (%)
Place of birth for the foreign-born population - Ghana (%)
Place of birth for the foreign-born population - Liberia (%)
Place of birth for the foreign-born population - Nigeria (%)
Place of birth for the foreign-born population - Senegal (%)
Place of birth for the foreign-born population - Sierra Leone (%)
Place of birth for the foreign-born population - Other Western Africa (%)
Place of birth for the foreign-born population - Australia (%)
Place of birth for the foreign-born population - New Zealand (%)
Place of birth for the foreign-born population - Fiji (%)
Place of birth for the foreign-born population - Micronesia (%)
Place of birth for the foreign-born population - Bahamas (%)
Place of birth for the foreign-born population - Barbados (%)
Place of birth for the foreign-born population - Cuba (%)
Place of birth for the foreign-born population - Dominica (%)
Place of birth for the foreign-born population - Dominican Republic (%)
Place of birth for the foreign-born population - Grenada (%)
Place of birth for the foreign-born population - Haiti (%)
Place of birth for the foreign-born population - Jamaica (%)
Place of birth for the foreign-born population - St. Vincent and the Grenadines (%)
Place of birth for the foreign-born population - Trinidad and Tobago (%)
Place of birth for the foreign-born population - West Indies (%)
Place of birth for the foreign-born population - Other Caribbean (%)
Place of birth for the foreign-born population - Belize (%)
Place of birth for the foreign-born population - Costa Rica (%)
Place of birth for the foreign-born population - El Salvador (%)
Place of birth for the foreign-born population - Guatemala (%)
Place of birth for the foreign-born population - Honduras (%)
Place of birth for the foreign-born population - Mexico (%)
Place of birth for the foreign-born population - Nicaragua (%)
Place of birth for the foreign-born population - Panama (%)
Place of birth for the foreign-born population - Other Central America (%)
Place of birth for the foreign-born population - Argentina (%)
Place of birth for the foreign-born population - Bolivia (%)
Place of birth for the foreign-born population - Brazil (%)
Place of birth for the foreign-born population - Chile (%)
Place of birth for the foreign-born population - Colombia (%)
Place of birth for the foreign-born population - Ecuador (%)
Place of birth for the foreign-born population - Guyana (%)
Place of birth for the foreign-born population - Peru (%)
Place of birth for the foreign-born population - Uruguay (%)
Place of birth for the foreign-born population - Venezuela (%)
Place of birth for the foreign-born population - Other South America (%)
Place of birth for the foreign-born population - Canada (%)
Place of birth for the foreign-born population - Other Northern America (%)
Place of birth for the foreign-born population - Other (%)
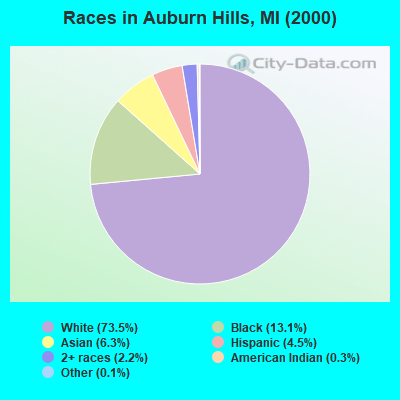
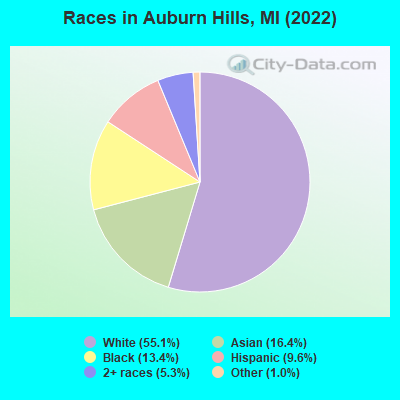
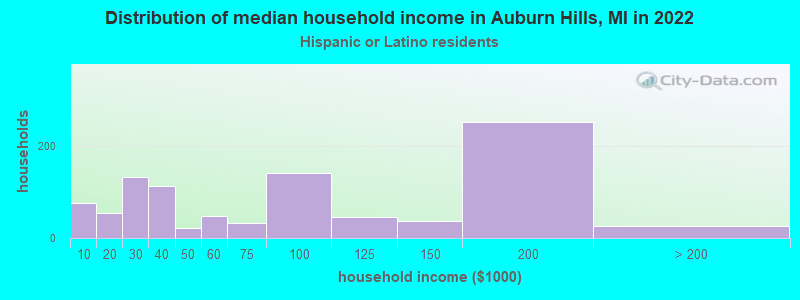
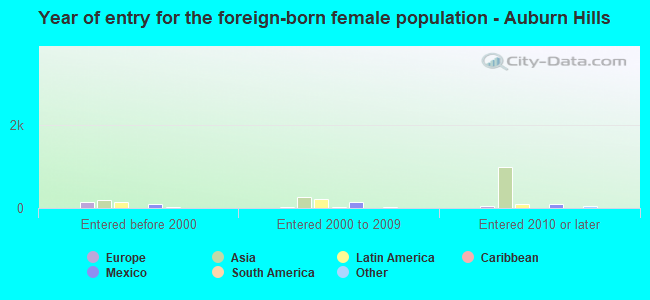
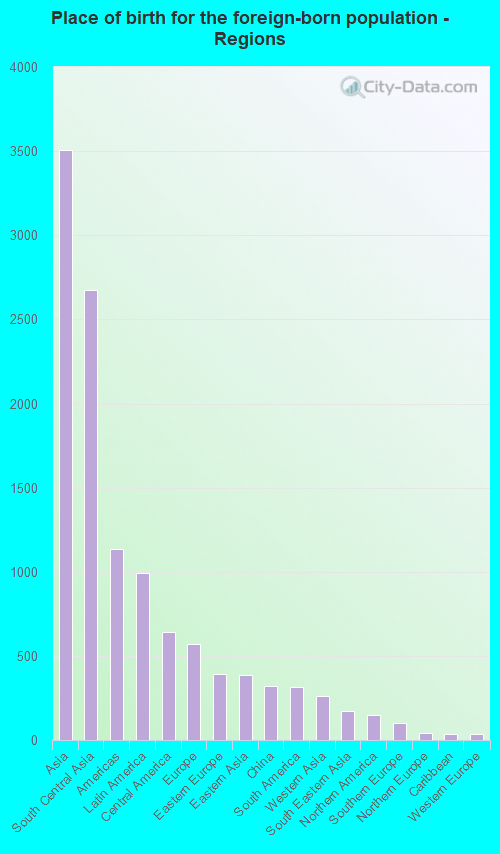
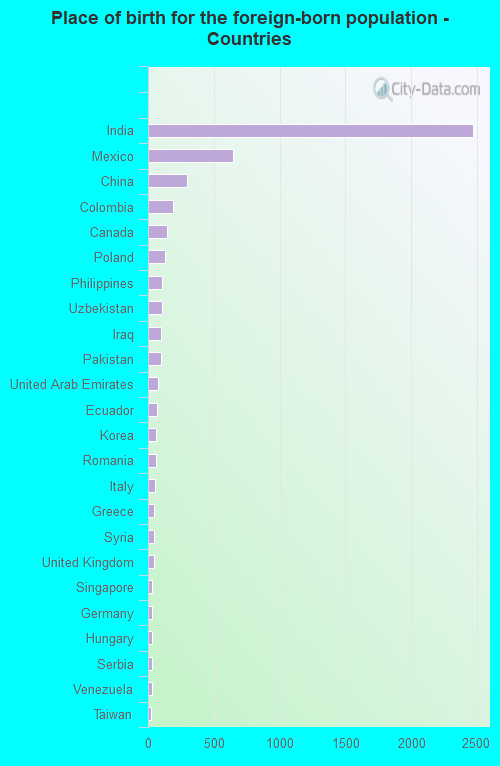
According to 2022 data, the most numerous races in Auburn Hills, MI are White alone (13,524 residents), Black alone (3,290 residents), and Hispanic (2,355 residents). 75.8% of Auburn Hills residents speak English at home. 21.3% of Auburn Hills, MI residents are foreign-born (14.3% born in Asia, 4.0% born in Latin America, 2.3% born in Europe), which is 71.8% greater than the foreign-born rate of 6.0% across the entire state of Michigan.
Race distribution in Auburn Hills
2000 2022
7,806,691 78.6% White alone 1,402,047 14.1% Black alone 323,877 3.3% Hispanic 175,311 1.8% Asian alone 163,487 1.6% Two or more races 53,421 0.5% American Indian alone 11,465 0.1% Other race alone 2,145 0.02% Native Hawaiian and Other
7,289,051 72.6% White alone 1,310,464 13.1% Black alone 572,405 5.7% Hispanic 450,031 4.5% Two or more races 335,732 3.3% Asian alone 45,217 0.5% Other race alone 29,011 0.3% American Indian alone 2,207 0.02% Native Hawaiian and Other
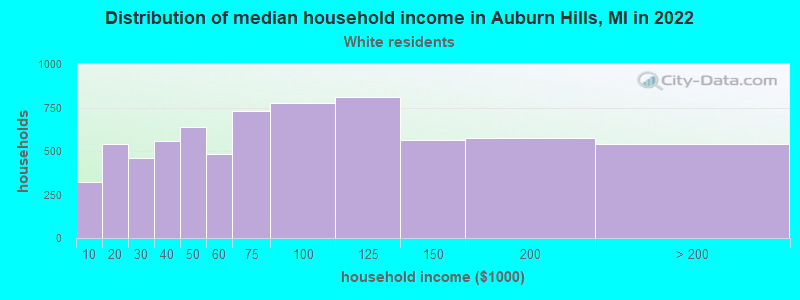
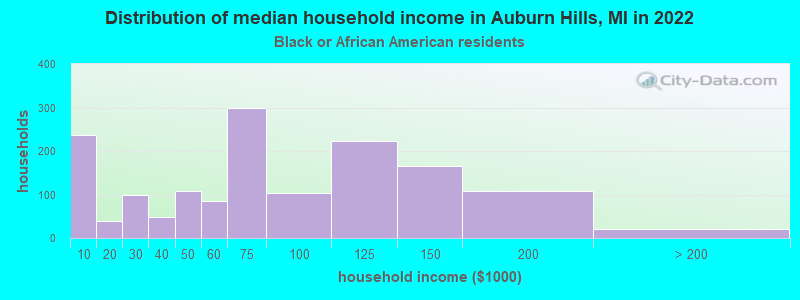
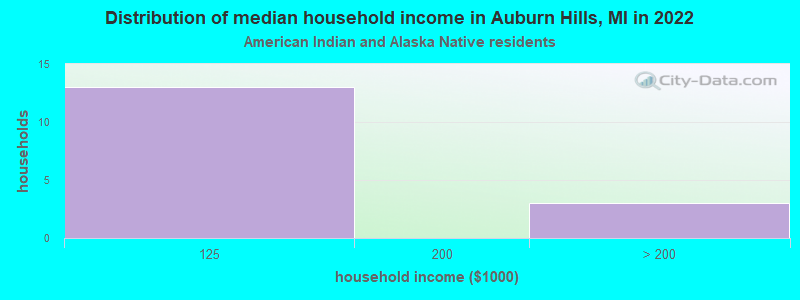
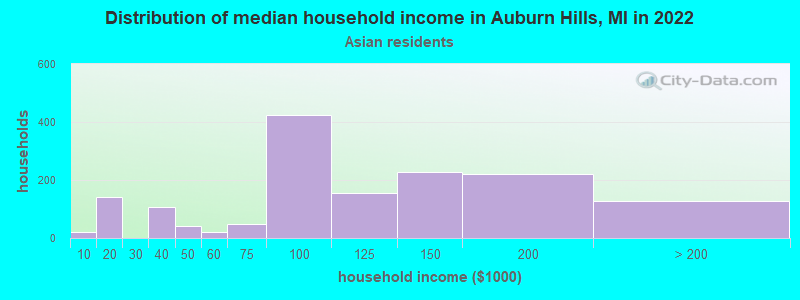
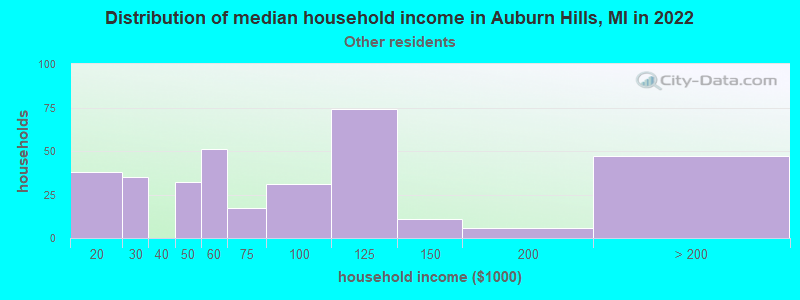
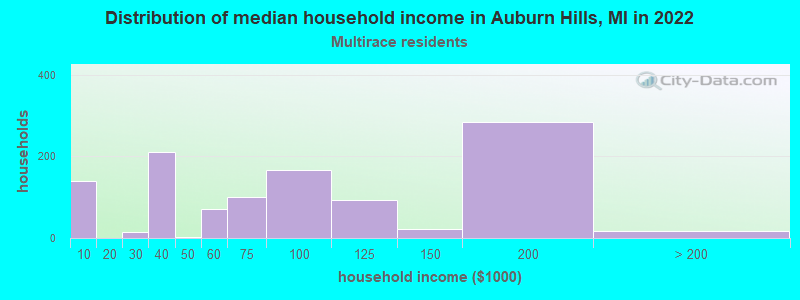
Income and house value in Auburn Hills Median household income in 2022 $69,205 White non-Hispanic householders$66,921 Black householders$167,261 American Indian and Alaska Native householders$104,186 Asian householders$99,979 Some other race householders$68,011 Two or more races householders$52,588 Hispanic or Latino race householdersMedian 2022 house value $257,212 White Non-Hispanic householders$295,670 Black or African American householders $266,731 Asian householders$249,216 Some other race householders$222,562 Two or more races householders$267,874 Hispanic or Latino householders
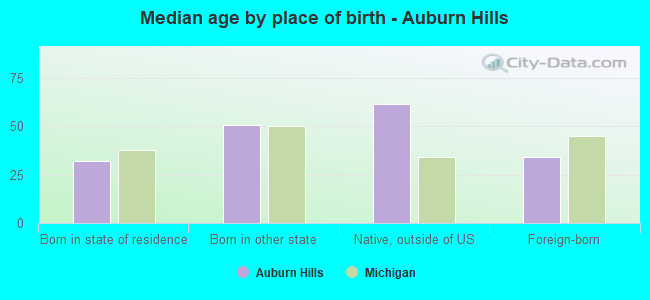
Median age by race in Auburn Hills
40.1 Median age for White residents38.1 42.4 42.9 Median age for Black or African American residents40.4 45.2 35.2 Median age for American Indian / Alaska Native residents41.4 35.1 31.3 Median age for Asian residents31.8 31.0 -670,531,400.3 Median age for Native Hawaiian / Pacific Islander residents-674,772,035.8 -699,588,476.7 23.3 Median age for Other race residents20.3 29.2 35.3 Median age for Two or more races residents37.7 30.5 40.8 Median age for White alone residents38.8 43.3 30.4 Median age for Hispanic or Latino residents32.9 27.5
Owner/renter occupied households by race in Auburn Hills
House owners and renters - White residents 4,282 62.0% Owner occupied2,619 38.0% Renter occupiedHouse owners and renters - Black or African American residents 468 33.4% Owner occupied933 66.6% Renter occupiedHouse owners and renters - American Indian / Alaska Native residents 2 9.8% Owner occupied15 90.2% Renter occupiedHouse owners and renters - Asian residents 284 17.5% Owner occupied1,338 82.5% Renter occupiedHouse owners and renters - Other race residents 91 23.9% Owner occupied291 76.1% Renter occupiedHouse owners and renters - Two or more races residents 452 39.9% Owner occupied680 60.1% Renter occupiedHouse owners and renters - White alone residents 4,272 62.8% Owner occupied2,533 37.2% Renter occupiedHouse owners and renters - Hispanic or Latino residents 332 32.8% Owner occupied679 67.2% Renter occupied
Language usage in Auburn Hills
English speakers - Total 75.8% of residents of Auburn Hills speak English at home.
8.1% of residents speak Spanish at home 1,261 66.6% Speak English very well633 33.4% Speak English less than very well16.7% of residents speak other language at home 2,864 72.8% Speak English very well1,070 27.2% Speak English less than very well
English speakers - Born in the United States 92.1% of residents of Auburn Hills speak English at home.
7.5% of residents speak Spanish at home 201 64.0% Speak English very well113 36.0% Speak English less than very well1.9% of residents speak other language at home 81 100.0% Speak English very well
English speakers - Native, born elsewhere 69.2% of residents of Auburn Hills speak English at home.
26.3% of residents speak Spanish at home 35 100.0% Speak English very well11.3% of residents speak other language at home 15 100.0% Speak English very well
English speakers - Foreign-born 12.0% of residents of Auburn Hills speak English at home.
24.7% of residents speak Spanish at home 749 59.3% Speak English very well514 40.7% Speak English less than very well67.1% of residents speak other language at home 2,445 71.3% Speak English very well986 28.7% Speak English less than very well
White (Caucasian) - Speak only English Native:
97.4% (12,296)Foreign-born:
33.1% (297)
White (Caucasian) - Speak another language Native:
2.7% (345)Foreign-born:
67.2% (604)
Black or African American - Speak only English Native:
99.0% (3,015)Foreign-born:
17.4% (17)
Black or African American - Speak another language Native:
1.0% (30)Foreign-born:
88.4% (88)
Asian - Speak only English Native:
60.1% (275)Foreign-born:
9.1% (287)
Asian - Speak another language Native:
40.3% (185)Foreign-born:
90.8% (2,863)
Other race - Speak only English Native:
33.3% (279)Foreign-born:
2.2% (7)
Other race - Speak another language Native:
71.8% (602)Foreign-born:
100.0% (344)
Two or more races - Speak only English Native:
84.9% (1,442)Foreign-born:
1.3% (13)
Two or more races - Speak another language Native:
15.2% (258)Foreign-born:
100.0% (977)
White alone - Speak only English Native:
97.8% (12,132)Foreign-born:
36.0% (300)
White alone - Speak another language Native:
2.2% (269)Foreign-born:
64.3% (537)
Hispanic or Latino - Speak only English Native:
40.5% (472)Foreign-born:
1.6% (20)
Hispanic or Latino - Speak another language Native:
62.0% (723)Foreign-born:
100.0% (1,198)
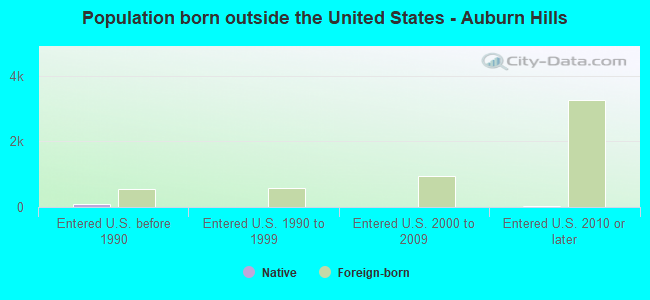
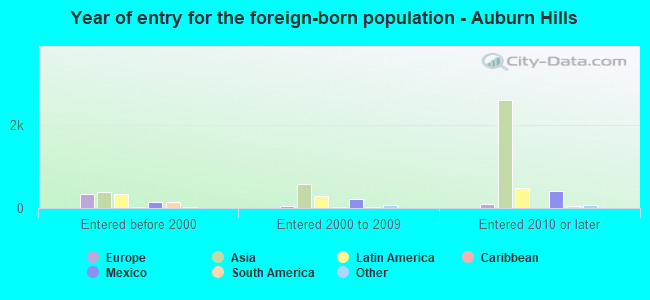
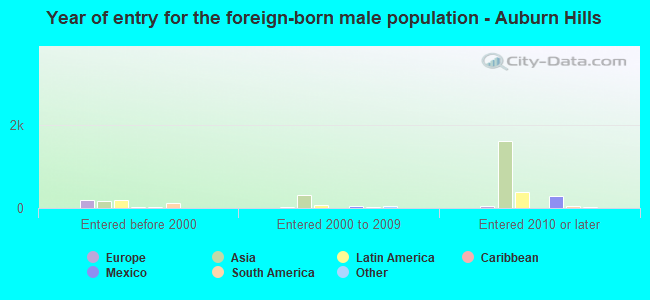
Foreign-born residents in Auburn Hills 5,226 residents are foreign born (14.3% Asia , 4.0% Latin America , 2.3% Europe ).
This city:
21.3%Michigan:
6.9%
Marital status for residents in Auburn Hills Marital status - White (Caucasian) population 15 years and over
Males 44.9% Never married39.7% Now married0.3% Separated4.0% Widowed11.1% DivorcedFemales 37.4% Never married34.9% Now married1.5% Separated8.7% Widowed17.5% DivorcedWomen who gave birth in the past 12 months Now married:
100.0% (41)Unmarried:
0.0% (0)
Women who did not give birth in the past 12 months Now married:
28.6% (988)Unmarried:
71.4% (2,462)
Marital status - Black or African American population 15 years and over
Males 52.9% Never married40.4% Now married0.0% Separated3.3% Widowed3.4% DivorcedFemales 46.2% Never married30.2% Now married5.7% Separated7.4% Widowed10.5% DivorcedWomen who gave birth in the past 12 months Now married:
34.6% (8)Unmarried:
65.4% (16)
Women who did not give birth in the past 12 months Now married:
26.1% (206)Unmarried:
73.9% (582)
Marital status - American Indian / Alaska Native population 15 years and over
Males 85.7% Never married14.3% Now married0.0% Separated0.0% Widowed0.0% DivorcedFemales 100.0% Never married0.0% Now married0.0% Separated0.0% Widowed0.0% DivorcedWomen who did not give birth in the past 12 months Now married:
0.0% (0)Unmarried:
100.0% (15)
Marital status - Asian population 15 years and over
Males 42.4% Never married55.5% Now married0.0% Separated1.2% Widowed0.9% DivorcedFemales 23.0% Never married62.4% Now married2.1% Separated8.3% Widowed4.2% DivorcedWomen who gave birth in the past 12 months Now married:
100.0% (104)Unmarried:
0.0% (0)
Women who did not give birth in the past 12 months Now married:
67.5% (665)Unmarried:
32.5% (321)
Marital status - Other race population 15 years and over
Males 37.4% Never married62.6% Now married0.0% Separated0.0% Widowed0.0% DivorcedFemales 43.2% Never married39.1% Now married2.7% Separated6.3% Widowed8.6% DivorcedWomen who gave birth in the past 12 months Now married:
100.0% (38)Unmarried:
0.0% (0)
Women who did not give birth in the past 12 months Now married:
37.4% (192)Unmarried:
62.6% (320)
Marital status - Two or more races population 15 years and over
Males 35.9% Never married35.1% Now married0.0% Separated18.6% Widowed10.5% DivorcedFemales 49.4% Never married42.1% Now married0.9% Separated0.0% Widowed7.6% DivorcedWomen who gave birth in the past 12 months Now married:
100.0% (33)Unmarried:
0.0% (0)
Women who did not give birth in the past 12 months Now married:
19.4% (148)Unmarried:
80.6% (613)
Marital status - White alone, not Hispanic / Latino population 15 years and over
Males 45.1% Never married39.2% Now married0.3% Separated4.1% Widowed11.3% DivorcedFemales 36.9% Never married35.0% Now married1.5% Separated8.9% Widowed17.7% DivorcedWomen who gave birth in the past 12 months Now married:
100.0% (32)Unmarried:
0.0% (0)
Women who did not give birth in the past 12 months Now married:
28.8% (973)Unmarried:
71.2% (2,405)
Marital status - Hispanic or Latino population 15 years and over
Males 34.1% Never married45.0% Now married0.0% Separated20.9% Widowed0.0% DivorcedFemales 44.4% Never married40.0% Now married2.0% Separated3.5% Widowed10.2% DivorcedWomen who gave birth in the past 12 months Now married:
100.0% (65)Unmarried:
0.0% (0)
Women who did not give birth in the past 12 months Now married:
35.5% (230)Unmarried:
64.5% (418)
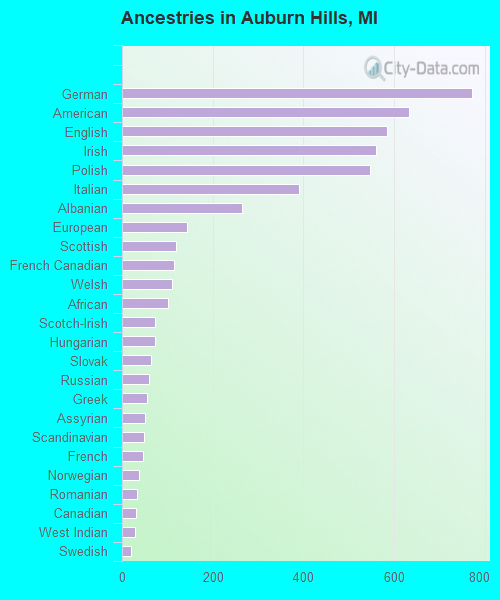
Ancestries in Auburn Hills
771 5.9% German632 4.8% American585 4.5% English560 4.3% Irish548 4.2% Polish391 3.0% Italian264 2.0% Albanian144 1.1% European120 0.9% Scottish115 0.9% French Canadian110 0.8% Welsh101 0.8% African72 0.5% Scotch-Irish72 0.5% Hungarian63 0.5% Slovak59 0.4% Russian56 0.4% Greek51 0.4% Assyrian49 0.4% Scandinavian47 0.4% French38 0.3% Norwegian33 0.3% Romanian31 0.2% Canadian28 0.2% West Indian20 0.2% Swedish19 0.1% Jamaican18 0.1% British16 0.1% Finnish16 0.1% Dutch14 0.1% Syrian12 0.09% Eastern European12 0.09% Palestinian11 0.08% Macedonian11 0.08% Yugoslavian10 0.08% Slovene10 0.08% Swiss10 0.08% Northern European9 0.07% Belgian9 0.07% Czech6 0.05% Ethiopian4 0.03% Lithuanian1 0.01% Brazilian
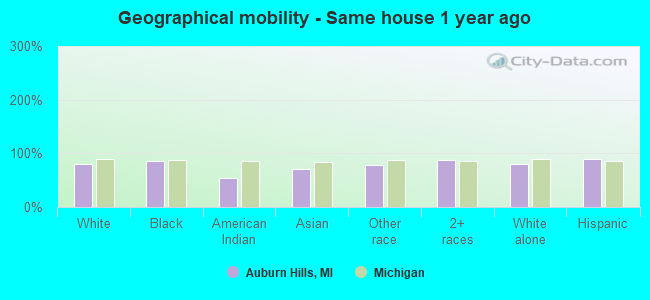
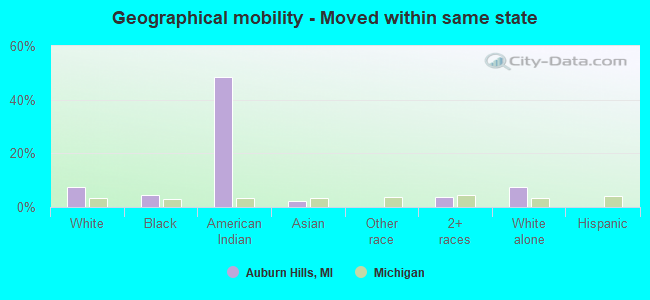
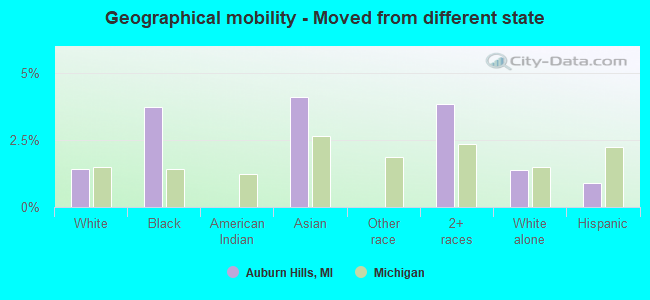
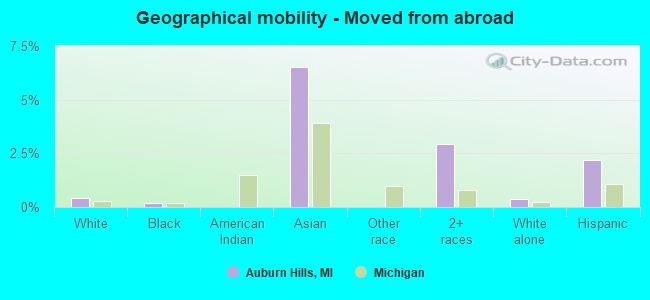
Geographical mobility in Auburn Hills Same house 1 year ago 11,152 81.0% White (Caucasian)2,833 85.6% Black or African American13 54.6% American Indian / Alaska Native2,694 70.0% Asian926 77.6% Other race2,413 88.4% Two or more races10,932 81.0% White alone, not Hispanic / Latino2,059 89.6% Hispanic or LatinoMoved within same county 1,349 9.8% White / Caucasian188 5.7% Black or African American4 15.3% American Indian / Alaska Native552 14.3% Asian249 20.9% Other race70 2.5% Two or more races1,311 9.7% White alone, not Hispanic / Latino146 6.3% Hispanic or LatinoMoved within same state 1,031 7.5% White / Caucasian148 4.5% Black or African American12 48.3% American Indian / Alaska Native85 2.2% Asian106 3.9% Two or more races1,019 7.5% White alone, not Hispanic / LatinoMoved from different state 193 1.4% White / Caucasian123 3.7% Black or African American158 4.1% Asian105 3.9% Two or more races187 1.4% White alone, not Hispanic / Latino20 0.9% Hispanic or LatinoMoved from abroad 58 0.4% White7 0.2% Black or African American251 6.5% Asian80 2.9% Two or more races52 0.4% White alone, not Hispanic / Latino50 2.2% Hispanic or Latino
Children Nativity (place of birth) in Auburn Hills
Children under 6 years - Living with two parents Both parents native 304 98.1% Native6 1.9% Foreign-bornBoth parents foreign-born 353 74.0% Native124 26.0% Foreign-bornOne native, one foreign-born parent 70 100.0% NativeChildren under 6 years - Living with one parent Native parent 312 100.0% NativeForeign-born parent 16 100.0% NativeChildren 6 to 17 years - Living with two parents Both parents native 836 100.0% NativeBoth parents foreign-born 232 66.8% Native115 33.2% Foreign-bornOne native, one foreign-born parent 166 100.0% NativeChildren 6 to 17 years - Living with one parent Native parent 749 100.0% NativeForeign-born parent 49 46.9% Native55 53.1% Foreign-born
Grandparents responsible for own grandchildren in Auburn Hills
Grandparents (30 to 59 years) White / Caucasian 34 100.0% Responsible for grandchildrenTwo or more races 6 100.0% Not responsible for grandchildrenWhite alone, not Hispanic / Latino 35 100.0% Responsible for grandchildrenGrandparents (60 years and over) White / Caucasian 7 38.6% Responsible for grandchildren11 61.4% Not responsible for grandchildrenWhite alone, not Hispanic / Latino 7 39.3% Responsible for grandchildren11 60.7% Not responsible for grandchildren