Races in Auburn, Washington (WA) Detailed Stats
Data:
Races - White alone (%)
Races - White alone (% change since 2000)
Races - Black alone (%)
Races - Black alone (% change since 2000)
Races - American Indian alone (%)
Races - American Indian alone (% change since 2000)
Races - Asian alone (%)
Races - Asian alone (% change since 2000)
Races - Hispanic (%)
Races - Hispanic (% change since 2000)
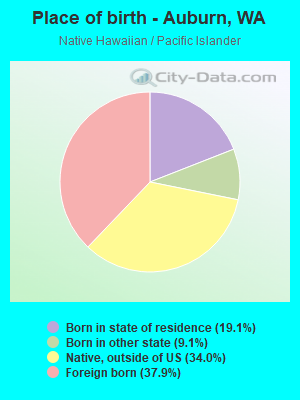
Races - Native Hawaiian and Other Pacific Islander alone (%)
Races - Native Hawaiian and Other Pacific Islander alone (% change since 2000)
Races - Two or more races(%)
Races - Two or more races(% change since 2000)
Races - Other race alone (%)
Races - Other race alone (% change since 2000)
Racial diversity
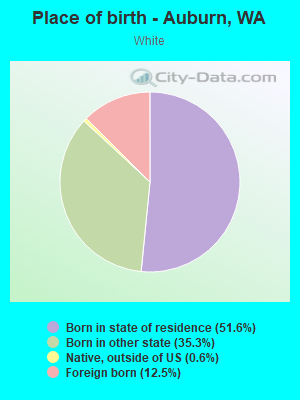
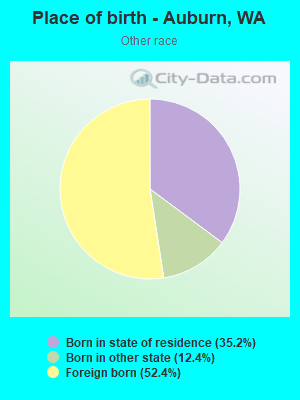
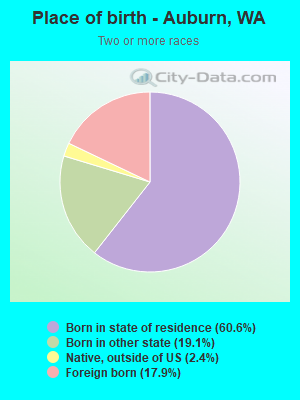
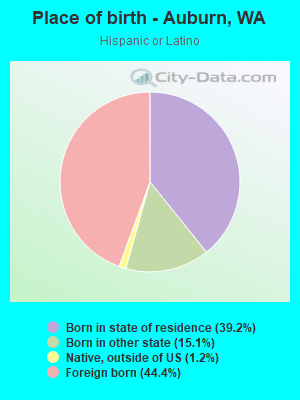
Place of birth - Born in state of residence (%)
Place of birth - Born in state of residence (%) - White
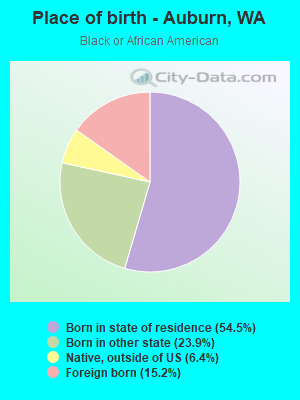
Place of birth - Born in state of residence (%) - Black or African American
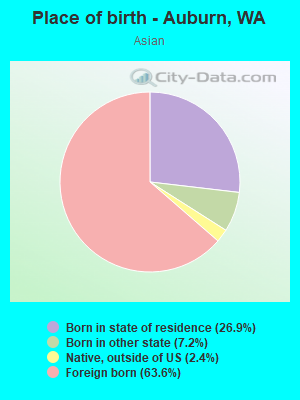
Place of birth - Born in state of residence (%) - Asian
Place of birth - Born in state of residence (%) - Hispanic or Latino
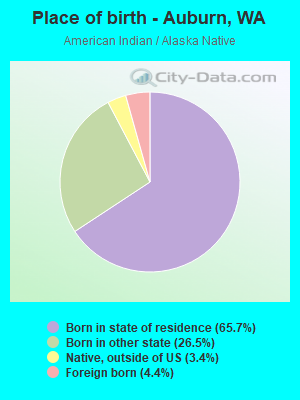
Place of birth - Born in state of residence (%) - American Indian and Alaska Native
Place of birth - Born in state of residence (%) - Multirace
Place of birth - Born in state of residence (%) - Other Race
Place of birth - Born in other state (%)
Place of birth - Born in other state (%) - White
Place of birth - Born in other state (%) - Black or African American
Place of birth - Born in other state (%) - Asian
Place of birth - Born in other state (%) - Hispanic or Latino
Place of birth - Born in other state (%) - American Indian and Alaska Native
Place of birth - Born in other state (%) - Multirace
Place of birth - Born in other state (%) - Other Race
Place of birth - Native, outside of US (%)
Place of birth - Native, outside of US (%) - White
Place of birth - Native, outside of US (%) - Black or African American
Place of birth - Native, outside of US (%) - Asian
Place of birth - Native, outside of US (%) - Hispanic or Latino
Place of birth - Native, outside of US (%) - American Indian and Alaska Native
Place of birth - Native, outside of US (%) - Multirace
Place of birth - Native, outside of US (%) - Other Race
Place of birth - Foreign born (%)
Place of birth - Foreign born (%) - White
Place of birth - Foreign born (%) - Black or African American
Place of birth - Foreign born (%) - Asian
Place of birth - Foreign born (%) - Hispanic or Latino
Place of birth - Foreign born (%) - American Indian and Alaska Native
Place of birth - Foreign born (%) - Multirace
Place of birth - Foreign born (%) - Other Race
Residents speaking English at home (%)
Residents speaking English at home - Born in the United States (%)
Residents speaking English at home - Native, born elsewhere (%)
Residents speaking English at home - Foreign born (%)
Residents speaking Spanish at home (%)
Residents speaking Spanish at home - Born in the United States (%)
Residents speaking Spanish at home - Native, born elsewhere (%)
Residents speaking Spanish at home - Foreign born (%)
Residents speaking other language at home (%)
Residents speaking other language at home - Born in the United States (%)
Residents speaking other language at home - Native, born elsewhere (%)
Residents speaking other language at home - Foreign born (%)
Marital status - Never married (%)
Marital status - Now married (%)
Marital status - Separated (%)
Marital status - Widowed (%)
Marital status - Divorced (%)
Ancestries Reported - Arab (%)
Ancestries Reported - Czech (%)
Ancestries Reported - Danish (%)
Ancestries Reported - Dutch (%)
Ancestries Reported - English (%)
Ancestries Reported - French (%)
Ancestries Reported - French Canadian (%)
Ancestries Reported - German (%)
Ancestries Reported - Greek (%)
Ancestries Reported - Hungarian (%)
Ancestries Reported - Irish (%)
Ancestries Reported - Italian (%)
Ancestries Reported - Lithuanian (%)
Ancestries Reported - Norwegian (%)
Ancestries Reported - Polish (%)
Ancestries Reported - Portuguese (%)
Ancestries Reported - Russian (%)
Ancestries Reported - Scotch-Irish (%)
Ancestries Reported - Scottish (%)
Ancestries Reported - Slovak (%)
Ancestries Reported - Subsaharan African (%)
Ancestries Reported - Swedish (%)
Ancestries Reported - Swiss (%)
Ancestries Reported - Ukrainian (%)
Ancestries Reported - United States (%)
Ancestries Reported - Welsh (%)
Ancestries Reported - West Indian (%)
Ancestries Reported - Other (%)
Geographical mobility - Same house 1 year ago (%)
Geographical mobility - Same house 1 year ago (%) - White
Geographical mobility - Same house 1 year ago (%) - Black or African American
Geographical mobility - Same house 1 year ago (%) - Asian
Geographical mobility - Same house 1 year ago (%) - Hispanic or Latino
Geographical mobility - Same house 1 year ago (%) - American Indian and Alaska Native
Geographical mobility - Same house 1 year ago (%) - Multirace
Geographical mobility - Same house 1 year ago (%) - Other Race
Geographical mobility - Moved within same county (%)
Geographical mobility - Moved within same county (%) - White
Geographical mobility - Moved within same county (%) - Black or African American
Geographical mobility - Moved within same county (%) - Asian
Geographical mobility - Moved within same county (%) - Hispanic or Latino
Geographical mobility - Moved within same county (%) - American Indian and Alaska Native
Geographical mobility - Moved within same county (%) - Multirace
Geographical mobility - Moved within same county (%) - Other Race
Geographical mobility - Moved from different county within same state (%)
Geographical mobility - Moved from different county within same state (%) - White
Geographical mobility - Moved from different county within same state (%) - Black or African American
Geographical mobility - Moved from different county within same state (%) - Asian
Geographical mobility - Moved from different county within same state (%) - Hispanic or Latino
Geographical mobility - Moved from different county within same state (%) - American Indian and Alaska Native
Geographical mobility - Moved from different county within same state (%) - Multirace
Geographical mobility - Moved from different county within same state (%) - Other Race
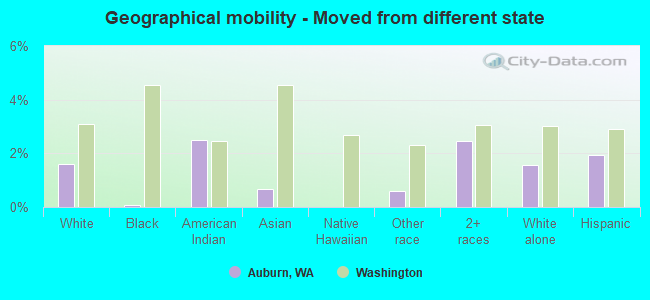
Geographical mobility - Moved from different state (%)
Geographical mobility - Moved from different state (%) - White
Geographical mobility - Moved from different state (%) - Black or African American
Geographical mobility - Moved from different state (%) - Asian
Geographical mobility - Moved from different state (%) - Hispanic or Latino
Geographical mobility - Moved from different state (%) - American Indian and Alaska Native
Geographical mobility - Moved from different state (%) - Multirace
Geographical mobility - Moved from different state (%) - Other Race
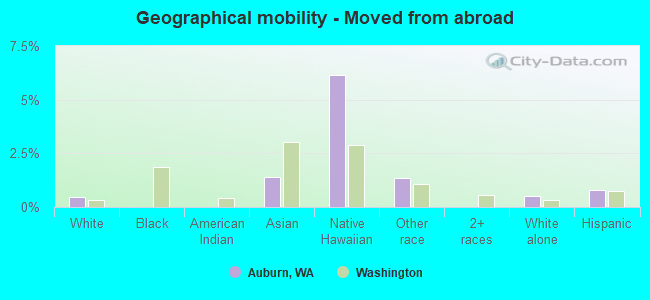
Geographical mobility - Moved from abroad (%)
Geographical mobility - Moved from abroad (%) - White
Geographical mobility - Moved from abroad (%) - Black or African American
Geographical mobility - Moved from abroad (%) - Asian
Geographical mobility - Moved from abroad (%) - Hispanic or Latino
Geographical mobility - Moved from abroad (%) - American Indian and Alaska Native
Geographical mobility - Moved from abroad (%) - Multirace
Geographical mobility - Moved from abroad (%) - Other Race
Place of birth for the foreign-born population - Ireland (%)
Place of birth for the foreign-born population - Denmark (%)
Place of birth for the foreign-born population - Norway (%)
Place of birth for the foreign-born population - Sweden (%)
Place of birth for the foreign-born population - United Kingdom (%)
Place of birth for the foreign-born population - England (%)
Place of birth for the foreign-born population - Scotland (%)
Place of birth for the foreign-born population - Other Northern Europe (%)
Place of birth for the foreign-born population - Austria (%)
Place of birth for the foreign-born population - Belgium (%)
Place of birth for the foreign-born population - France (%)
Place of birth for the foreign-born population - Germany (%)
Place of birth for the foreign-born population - Netherlands (%)
Place of birth for the foreign-born population - Switzerland (%)
Place of birth for the foreign-born population - Other Western Europe (%)
Place of birth for the foreign-born population - Greece (%)
Place of birth for the foreign-born population - Italy (%)
Place of birth for the foreign-born population - Portugal (%)
Place of birth for the foreign-born population - Spain (%)
Place of birth for the foreign-born population - Other Southern Europe (%)
Place of birth for the foreign-born population - Albania (%)
Place of birth for the foreign-born population - Belarus (%)
Place of birth for the foreign-born population - Bosnia and Herzegovina (%)
Place of birth for the foreign-born population - Bulgaria (%)
Place of birth for the foreign-born population - Croatia (%)
Place of birth for the foreign-born population - Czechoslovakia (%)
Place of birth for the foreign-born population - Hungary (%)
Place of birth for the foreign-born population - Latvia (%)
Place of birth for the foreign-born population - Lithuania (%)
Place of birth for the foreign-born population - North Macedonia (Macedonia) (%)
Place of birth for the foreign-born population - Moldova (%)
Place of birth for the foreign-born population - Poland (%)
Place of birth for the foreign-born population - Romania (%)
Place of birth for the foreign-born population - Russia (%)
Place of birth for the foreign-born population - Serbia (%)
Place of birth for the foreign-born population - Ukraine (%)
Place of birth for the foreign-born population - Other Eastern Europe (%)
Place of birth for the foreign-born population - China (%)
Place of birth for the foreign-born population - Hong Kong (%)
Place of birth for the foreign-born population - Taiwan (%)
Place of birth for the foreign-born population - Japan (%)
Place of birth for the foreign-born population - Korea (%)
Place of birth for the foreign-born population - Other Eastern Asia (%)
Place of birth for the foreign-born population - Afghanistan (%)
Place of birth for the foreign-born population - Bangladesh (%)
Place of birth for the foreign-born population - India (%)
Place of birth for the foreign-born population - Iran (%)
Place of birth for the foreign-born population - Kazakhstan (%)
Place of birth for the foreign-born population - Nepal (%)
Place of birth for the foreign-born population - Pakistan (%)
Place of birth for the foreign-born population - Sri Lanka (%)
Place of birth for the foreign-born population - Uzbekistan (%)
Place of birth for the foreign-born population - Other South Central Asia (%)
Place of birth for the foreign-born population - Burma (%)
Place of birth for the foreign-born population - Cambodia (%)
Place of birth for the foreign-born population - Indonesia (%)
Place of birth for the foreign-born population - Laos (%)
Place of birth for the foreign-born population - Malaysia (%)
Place of birth for the foreign-born population - Philippines (%)
Place of birth for the foreign-born population - Singapore (%)
Place of birth for the foreign-born population - Thailand (%)
Place of birth for the foreign-born population - Vietnam (%)
Place of birth for the foreign-born population - Other South Eastern Asia (%)
Place of birth for the foreign-born population - Armenia (%)
Place of birth for the foreign-born population - Iraq (%)
Place of birth for the foreign-born population - Israel (%)
Place of birth for the foreign-born population - Jordan (%)
Place of birth for the foreign-born population - Kuwait (%)
Place of birth for the foreign-born population - Lebanon (%)
Place of birth for the foreign-born population - Saudi Arabia (%)
Place of birth for the foreign-born population - Syria (%)
Place of birth for the foreign-born population - Turkey (%)
Place of birth for the foreign-born population - Yemen (%)
Place of birth for the foreign-born population - Other Western Asia (%)
Place of birth for the foreign-born population - Eritrea (%)
Place of birth for the foreign-born population - Ethiopia (%)
Place of birth for the foreign-born population - Kenya (%)
Place of birth for the foreign-born population - Somalia (%)
Place of birth for the foreign-born population - Uganda (%)
Place of birth for the foreign-born population - Zimbabwe (%)
Place of birth for the foreign-born population - Other Eastern Africa (%)
Place of birth for the foreign-born population - Cameroon (%)
Place of birth for the foreign-born population - Congo (%)
Place of birth for the foreign-born population - Democratic Republic of Congo (Zaire) (%)
Place of birth for the foreign-born population - Other Middle Africa (%)
Place of birth for the foreign-born population - Egypt (%)
Place of birth for the foreign-born population - Morocco (%)
Place of birth for the foreign-born population - Sudan (%)
Place of birth for the foreign-born population - Other Northern Africa (%)
Place of birth for the foreign-born population - South Africa (%)
Place of birth for the foreign-born population - Other Southern Africa (%)
Place of birth for the foreign-born population - Cabo Verde (%)
Place of birth for the foreign-born population - Ghana (%)
Place of birth for the foreign-born population - Liberia (%)
Place of birth for the foreign-born population - Nigeria (%)
Place of birth for the foreign-born population - Senegal (%)
Place of birth for the foreign-born population - Sierra Leone (%)
Place of birth for the foreign-born population - Other Western Africa (%)
Place of birth for the foreign-born population - Australia (%)
Place of birth for the foreign-born population - New Zealand (%)
Place of birth for the foreign-born population - Fiji (%)
Place of birth for the foreign-born population - Micronesia (%)
Place of birth for the foreign-born population - Bahamas (%)
Place of birth for the foreign-born population - Barbados (%)
Place of birth for the foreign-born population - Cuba (%)
Place of birth for the foreign-born population - Dominica (%)
Place of birth for the foreign-born population - Dominican Republic (%)
Place of birth for the foreign-born population - Grenada (%)
Place of birth for the foreign-born population - Haiti (%)
Place of birth for the foreign-born population - Jamaica (%)
Place of birth for the foreign-born population - St. Vincent and the Grenadines (%)
Place of birth for the foreign-born population - Trinidad and Tobago (%)
Place of birth for the foreign-born population - West Indies (%)
Place of birth for the foreign-born population - Other Caribbean (%)
Place of birth for the foreign-born population - Belize (%)
Place of birth for the foreign-born population - Costa Rica (%)
Place of birth for the foreign-born population - El Salvador (%)
Place of birth for the foreign-born population - Guatemala (%)
Place of birth for the foreign-born population - Honduras (%)
Place of birth for the foreign-born population - Mexico (%)
Place of birth for the foreign-born population - Nicaragua (%)
Place of birth for the foreign-born population - Panama (%)
Place of birth for the foreign-born population - Other Central America (%)
Place of birth for the foreign-born population - Argentina (%)
Place of birth for the foreign-born population - Bolivia (%)
Place of birth for the foreign-born population - Brazil (%)
Place of birth for the foreign-born population - Chile (%)
Place of birth for the foreign-born population - Colombia (%)
Place of birth for the foreign-born population - Ecuador (%)
Place of birth for the foreign-born population - Guyana (%)
Place of birth for the foreign-born population - Peru (%)
Place of birth for the foreign-born population - Uruguay (%)
Place of birth for the foreign-born population - Venezuela (%)
Place of birth for the foreign-born population - Other South America (%)
Place of birth for the foreign-born population - Canada (%)
Place of birth for the foreign-born population - Other Northern America (%)
Place of birth for the foreign-born population - Other (%)
Latest news about races in Auburn, WA collected exclusively by city-data.com from local newspapers, TV, and radio stations
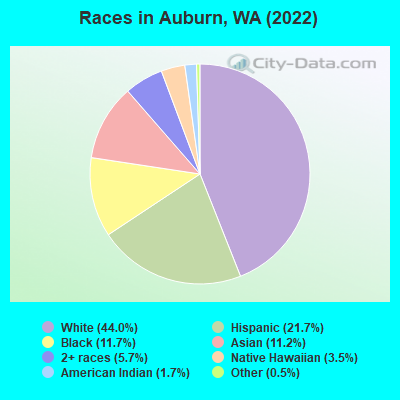
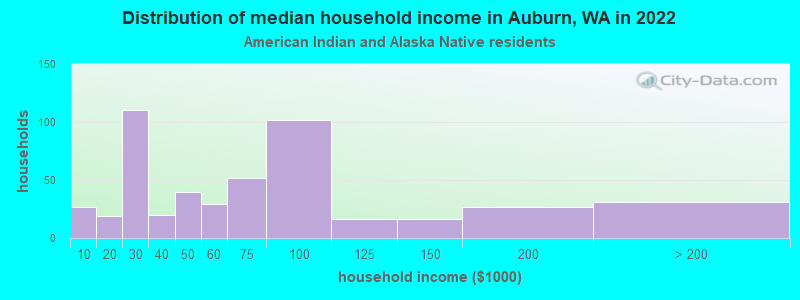
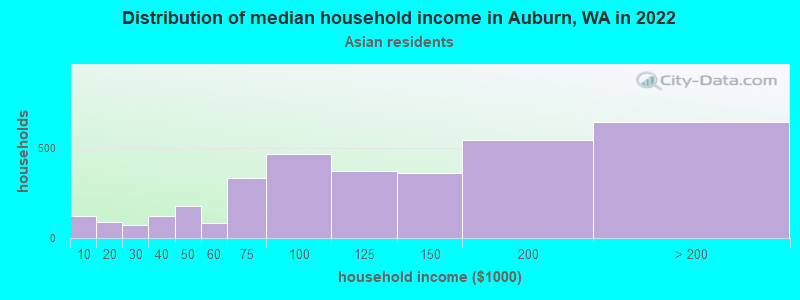
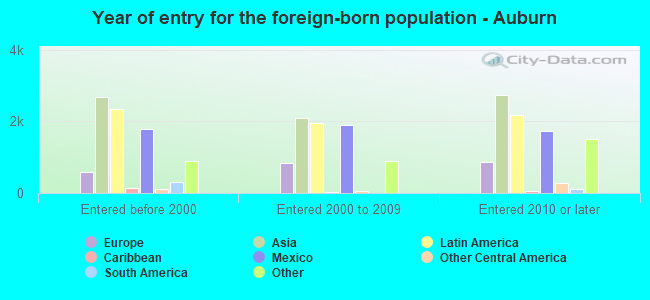
According to 2022 data, the most numerous races in Auburn, WA are White alone (36,938 residents), Hispanic (18,262 residents), and Asian alone (9,366 residents). 61.6% of Auburn residents speak English at home. 22.9% of Auburn, WA residents are foreign-born (8.3% born in Asia, 7.4% born in Latin America, 2.7% born in Europe), which is 34.6% greater than the foreign-born rate of 15.0% across the entire state of Washington.
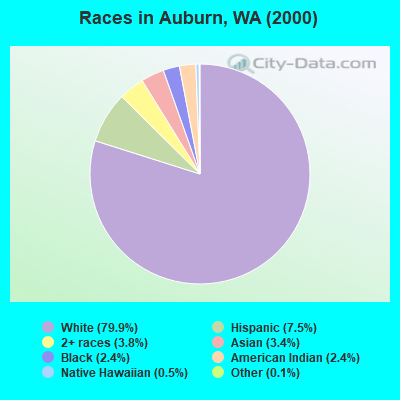
Race distribution in Auburn
2000 2022
32,220 79.9% White alone 3,019 7.5% Hispanic 1,528 3.8% Two or more races 1,389 3.4% Asian alone 956 2.4% Black alone 953 2.4% American Indian alone 197 0.5% Native Hawaiian and Other 52 0.1% Other race alone
36,938 44.0% White alone 18,262 21.7% Hispanic 9,858 11.7% Black alone 9,366 11.2% Asian alone 4,765 5.7% Two or more races 2,900 3.5% Native Hawaiian and Other 1,426 1.7% American Indian alone 461 0.5% Other race alone
2000 2022
4,652,490 78.9% White alone 441,509 7.5% Hispanic 319,401 5.4% Asian alone 184,631 3.1% Black alone 175,926 3.0% Two or more races 85,396 1.4% American Indian alone 22,779 0.4% Native Hawaiian and Other 11,989 0.2% Other race alone
4,941,456 63.5% White alone 1,093,313 14.0% Hispanic 755,832 9.7% Asian alone 523,448 6.7% Two or more races 299,537 3.8% Black alone 69,024 0.9% American Indian alone 52,231 0.7% Native Hawaiian and Other 50,945 0.7% Other race alone
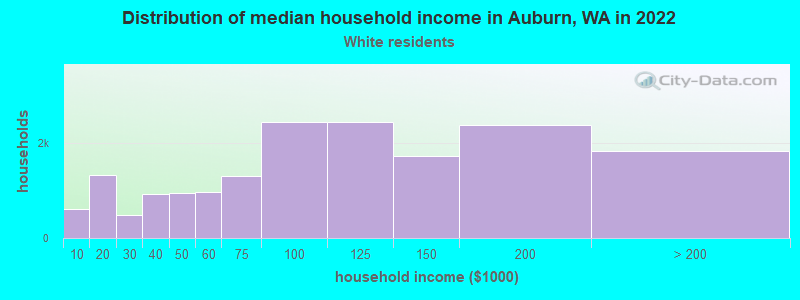
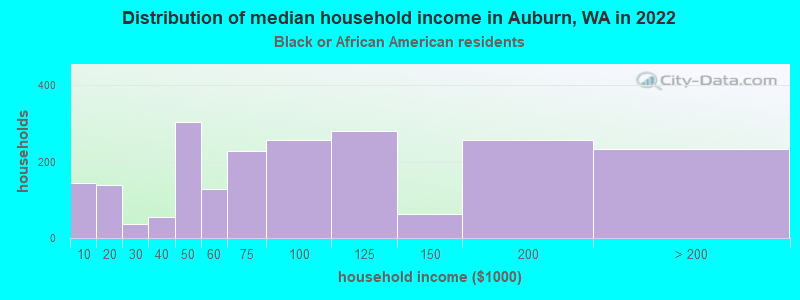
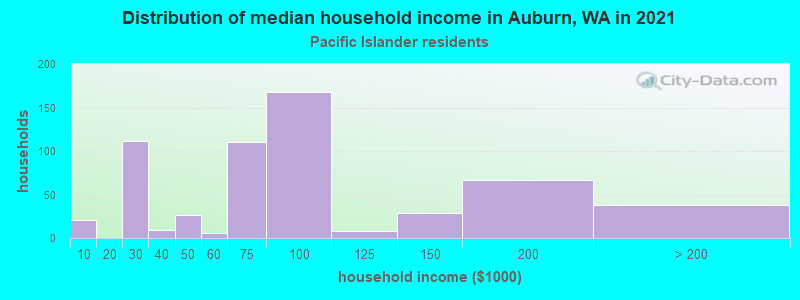
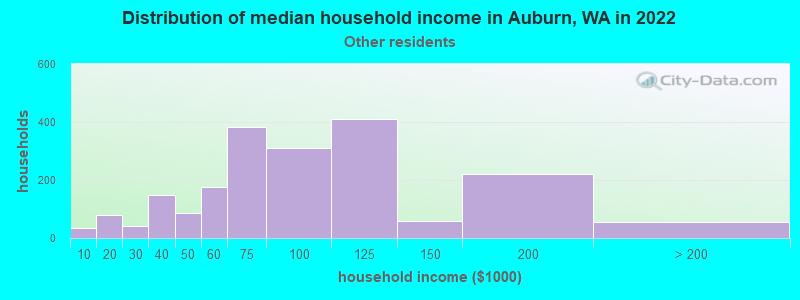
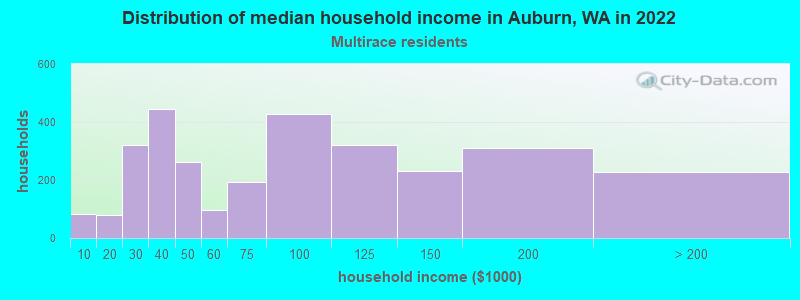
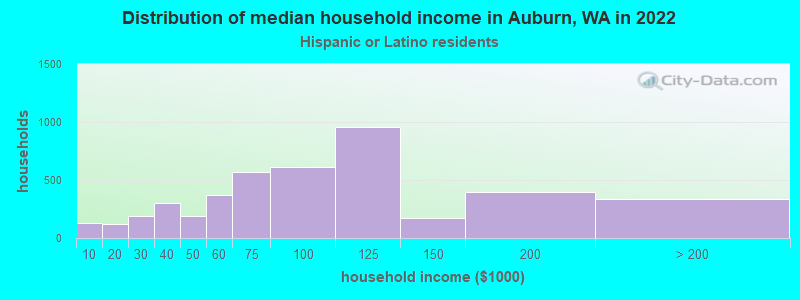
Income and house value in Auburn Median household income in 2022 $95,125 White non-Hispanic householders$60,901 Black householders$83,274 American Indian and Alaska Native householders$123,428 Asian householders$94,493 Native Hawaiian and other Pacific Islander householders$93,533 Some other race householders$74,979 Two or more races householders$86,635 Hispanic or Latino race householdersMedian 2022 house value $609,206 White Non-Hispanic householders$690,326 Black or African American householders$604,788 American Indian or Alaska Native householders $686,712 Asian householdersover $1,000,000 Native Hawaiian and other Pacific Islander householders$527,282 Some other race householders$726,469 Two or more races householders$571,055 Hispanic or Latino householders
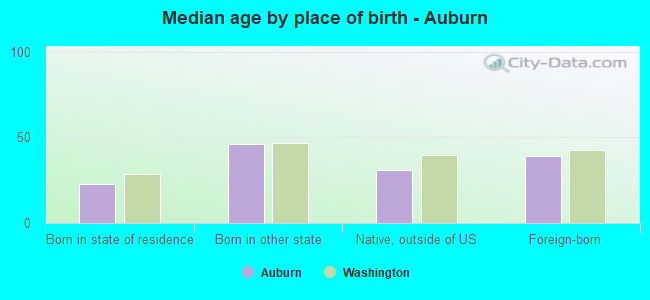
Median age by race in Auburn
42.5 Median age for White residents41.3 45.8 35.3 Median age for Black or African American residents32.6 35.9 27.3 Median age for American Indian / Alaska Native residents28.7 26.7 34.2 Median age for Asian residents33.4 35.5 27.9 Median age for Native Hawaiian / Pacific Islander residents15.6 32.6 20.9 Median age for Other race residents20.0 21.3 13.7 Median age for Two or more races residents32.3 11.3 43.8 Median age for White alone residents42.3 46.9 21.8 Median age for Hispanic or Latino residents24.8 19.8
Owner/renter occupied households by race in Auburn
House owners and renters - White residents 11,468 65.7% Owner occupied5,976 34.3% Renter occupiedHouse owners and renters - Black or African American residents 360 10.0% Owner occupied3,223 90.0% Renter occupiedHouse owners and renters - American Indian / Alaska Native residents 150 30.1% Owner occupied349 69.9% Renter occupiedHouse owners and renters - Asian residents 2,366 75.7% Owner occupied759 24.3% Renter occupiedHouse owners and renters - Native Hawaiian / Pacific Islander residents 201 31.3% Owner occupied442 68.7% Renter occupiedHouse owners and renters - Other race residents 1,375 52.7% Owner occupied1,236 47.3% Renter occupiedHouse owners and renters - Two or more races residents 1,055 72.7% Owner occupied396 27.3% Renter occupiedHouse owners and renters - White alone residents 11,136 66.7% Owner occupied5,562 33.3% Renter occupiedHouse owners and renters - Hispanic or Latino residents 2,246 52.9% Owner occupied2,003 47.1% Renter occupied
Language usage in Auburn
English speakers - Total 61.6% of residents of Auburn speak English at home.
17.7% of residents speak Spanish at home 7,540 54.6% Speak English very well6,278 45.4% Speak English less than very well20.7% of residents speak other language at home 8,379 51.6% Speak English very well7,846 48.4% Speak English less than very well
English speakers - Born in the United States 87.1% of residents of Auburn speak English at home.
10.3% of residents speak Spanish at home 1,283 61.1% Speak English very well817 38.9% Speak English less than very well2.6% of residents speak other language at home 408 78.0% Speak English very well115 22.0% Speak English less than very well
English speakers - Native, born elsewhere 41.2% of residents of Auburn speak English at home.
4.1% of residents speak Spanish at home 129 100.0% Speak English less than very well54.7% of residents speak other language at home 1,394 80.4% Speak English very well340 19.6% Speak English less than very well
English speakers - Foreign-born 8.2% of residents of Auburn speak English at home.
35.7% of residents speak Spanish at home 2,298 32.0% Speak English very well4,879 68.0% Speak English less than very well56.1% of residents speak other language at home 4,433 39.3% Speak English very well6,859 60.7% Speak English less than very well
White (Caucasian) - Speak only English Native:
92.4% (30,089)Foreign-born:
6.0% (297)
White (Caucasian) - Speak another language Native:
7.6% (2,480)Foreign-born:
94.0% (4,638)
Black or African American - Speak only English Native:
89.0% (3,790)Foreign-born:
23.5% (411)
Black or African American - Speak another language Native:
11.1% (472)Foreign-born:
77.8% (1,359)
American Indian / Alaska Native - Speak only English Native:
88.5% (1,370)Foreign-born:
25.9% (20)
American Indian / Alaska Native - Speak another language Native:
8.7% (135)Foreign-born:
65.7% (50)
Asian - Speak only English Native:
66.3% (2,038)Foreign-born:
15.7% (933)
Asian - Speak another language Native:
33.7% (1,038)Foreign-born:
84.3% (5,026)
Native Hawaiian / Pacific Islander - Speak only English Native:
49.5% (591)Foreign-born:
17.4% (169)
Native Hawaiian / Pacific Islander - Speak another language Native:
57.0% (680)Foreign-born:
81.4% (789)
Other race - Speak only English Native:
10.7% (572)Foreign-born:
4.2% (247)
Other race - Speak another language Native:
89.3% (4,789)Foreign-born:
95.8% (5,587)
Two or more races - Speak only English Native:
84.4% (7,398)Foreign-born:
5.6% (87)
Two or more races - Speak another language Native:
15.4% (1,348)Foreign-born:
94.7% (1,475)
White alone - Speak only English Native:
94.2% (28,990)Foreign-born:
6.7% (297)
White alone - Speak another language Native:
5.8% (1,778)Foreign-born:
93.3% (4,108)
Hispanic or Latino - Speak only English Native:
25.9% (2,280)Foreign-born:
2.3% (170)
Hispanic or Latino - Speak another language Native:
74.1% (6,526)Foreign-born:
97.7% (7,381)
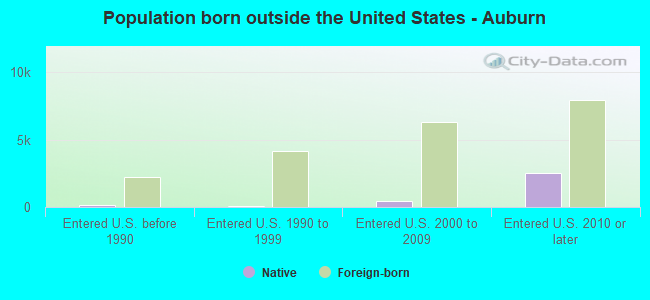
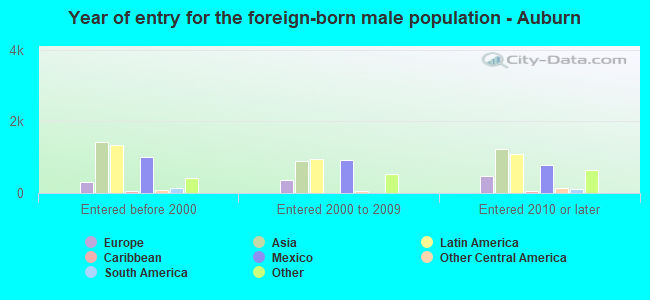
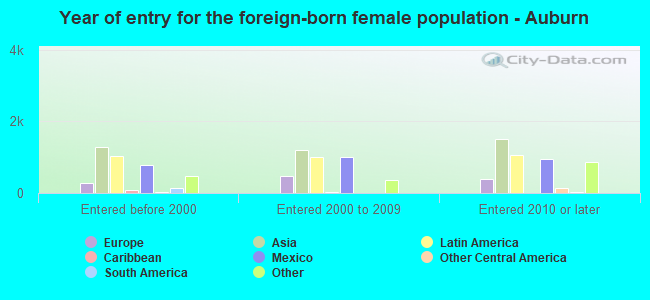
Foreign-born residents in Auburn 19,756 residents are foreign born (8.3% Asia , 7.4% Latin America , 2.7% Europe ).
This city:
22.9%Washington:
14.9%
Marital status for residents in Auburn Marital status - White (Caucasian) population 15 years and over
Males 33.3% Never married51.2% Now married0.7% Separated3.2% Widowed11.5% DivorcedFemales 33.4% Never married43.5% Now married1.8% Separated7.3% Widowed14.0% DivorcedWomen who gave birth in the past 12 months Now married:
90.2% (394)Unmarried:
9.8% (43)
Women who did not give birth in the past 12 months Now married:
39.2% (3,861)Unmarried:
60.8% (5,976)
Marital status - Black or African American population 15 years and over
Males 37.3% Never married43.7% Now married1.7% Separated0.2% Widowed17.1% DivorcedFemales 41.4% Never married41.2% Now married4.1% Separated3.6% Widowed9.7% DivorcedWomen who gave birth in the past 12 months Now married:
12.9% (15)Unmarried:
87.1% (103)
Women who did not give birth in the past 12 months Now married:
44.8% (701)Unmarried:
55.2% (863)
Marital status - American Indian / Alaska Native population 15 years and over
Males 49.5% Never married30.5% Now married0.0% Separated13.6% Widowed6.4% DivorcedFemales 42.9% Never married37.3% Now married2.9% Separated5.7% Widowed11.1% DivorcedWomen who gave birth in the past 12 months Now married:
50.5% (59)Unmarried:
49.5% (57)
Women who did not give birth in the past 12 months Now married:
42.8% (156)Unmarried:
57.2% (208)
Marital status - Asian population 15 years and over
Males 40.0% Never married51.4% Now married2.9% Separated1.7% Widowed4.0% DivorcedFemales 22.0% Never married59.5% Now married2.8% Separated7.8% Widowed7.9% DivorcedWomen who gave birth in the past 12 months Now married:
100.0% (113)Unmarried:
0.0% (0)
Women who did not give birth in the past 12 months Now married:
61.9% (1,716)Unmarried:
38.1% (1,055)
Marital status - Native Hawaiian / Pacific Islander population 15 years and over
Males 33.7% Never married48.7% Now married0.0% Separated0.0% Widowed17.7% DivorcedFemales 50.1% Never married34.3% Now married0.8% Separated14.3% Widowed0.5% DivorcedWomen who gave birth in the past 12 months Now married:
79.5% (105)Unmarried:
20.5% (27)
Women who did not give birth in the past 12 months Now married:
27.4% (190)Unmarried:
72.6% (503)
Marital status - Other race population 15 years and over
Males 66.5% Never married31.8% Now married0.0% Separated0.2% Widowed1.6% DivorcedFemales 51.6% Never married21.4% Now married9.1% Separated3.1% Widowed14.9% DivorcedWomen who gave birth in the past 12 months Now married:
61.3% (84)Unmarried:
38.7% (53)
Women who did not give birth in the past 12 months Now married:
44.2% (1,095)Unmarried:
55.8% (1,380)
Marital status - Two or more races population 15 years and over
Males 25.3% Never married69.5% Now married0.0% Separated0.5% Widowed4.7% DivorcedFemales 15.6% Never married66.7% Now married0.0% Separated2.1% Widowed15.5% DivorcedWomen who gave birth in the past 12 months Now married:
96.5% (249)Unmarried:
3.5% (9)
Women who did not give birth in the past 12 months Now married:
44.9% (1,188)Unmarried:
55.1% (1,459)
Marital status - White alone, not Hispanic / Latino population 15 years and over
Males 33.4% Never married50.0% Now married0.8% Separated3.5% Widowed12.4% DivorcedFemales 31.5% Never married44.2% Now married1.9% Separated7.7% Widowed14.7% DivorcedWomen who gave birth in the past 12 months Now married:
90.2% (394)Unmarried:
9.8% (43)
Women who did not give birth in the past 12 months Now married:
41.7% (3,814)Unmarried:
58.3% (5,343)
Marital status - Hispanic or Latino population 15 years and over
Males 51.6% Never married46.5% Now married0.0% Separated0.1% Widowed1.7% DivorcedFemales 49.9% Never married30.4% Now married7.0% Separated2.4% Widowed10.4% DivorcedWomen who gave birth in the past 12 months Now married:
82.9% (258)Unmarried:
17.1% (53)
Women who did not give birth in the past 12 months Now married:
47.8% (1,915)Unmarried:
52.2% (2,092)
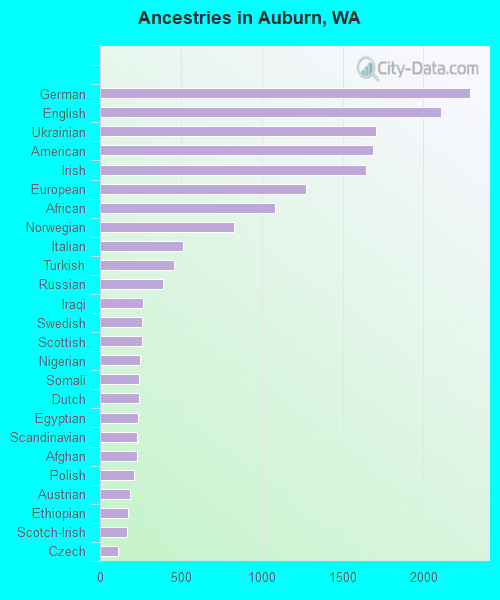
Ancestries in Auburn
2,291 5.0% German2,107 4.6% English1,709 3.8% Ukrainian1,687 3.7% American1,645 3.6% Irish1,276 2.8% European1,083 2.4% African829 1.8% Norwegian511 1.1% Italian458 1.0% Turkish389 0.9% Russian265 0.6% Iraqi257 0.6% Swedish257 0.6% Scottish249 0.5% Nigerian244 0.5% Somali239 0.5% Dutch235 0.5% Egyptian230 0.5% Scandinavian226 0.5% Afghan213 0.5% Polish185 0.4% Austrian171 0.4% Ethiopian166 0.4% Scotch-Irish109 0.2% Czech92 0.2% Jamaican85 0.2% French Canadian84 0.2% British84 0.2% French77 0.2% Canadian76 0.2% Greek73 0.2% Syrian72 0.2% Swiss62 0.1% Kenyan59 0.1% Romanian55 0.1% Cajun51 0.1% Northern European44 0.10% Finnish36 0.08% Czechoslovakian35 0.08% Sierra Leonean33 0.07% Danish32 0.07% Moroccan31 0.07% British West Indian27 0.06% Yugoslavian26 0.06% Belgian25 0.05% Ghanaian24 0.05% Portuguese21 0.05% Eastern European20 0.04% Icelander20 0.04% Bahamian19 0.04% Brazilian18 0.04% Hungarian16 0.04% Welsh14 0.03% Armenian11 0.02% West Indian10 0.02% New Zealander8 0.02% Lithuanian7 0.02% Pennsylvania German7 0.02% Lebanese6 0.01% Estonian4 0.01% Bulgarian3 0.01% Croatian3 0.01% Cape Verdean
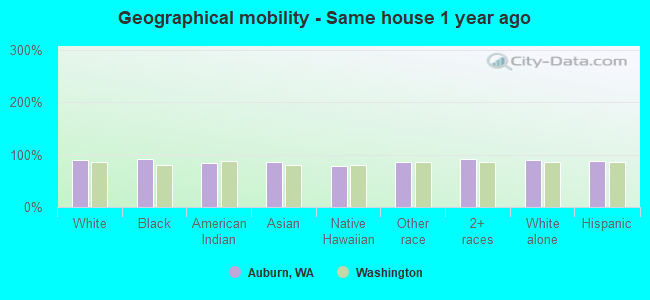
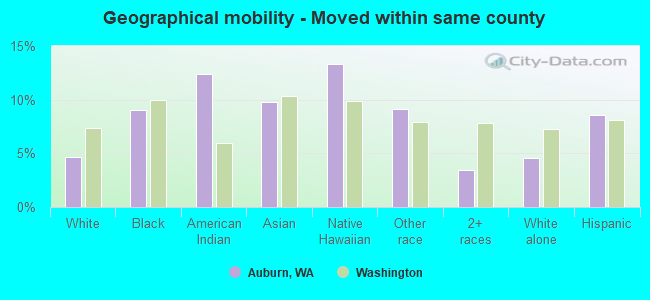
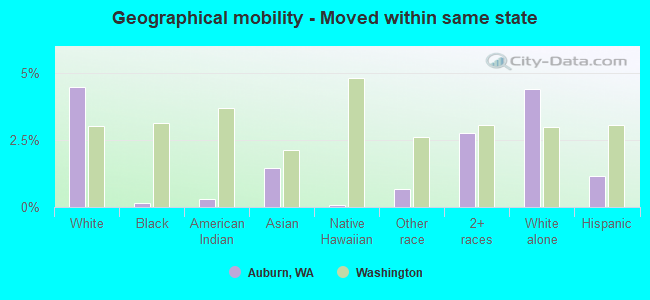
Geographical mobility in Auburn Same house 1 year ago 34,555 88.8% White (Caucasian)8,899 90.7% Black or African American1,477 84.6% American Indian / Alaska Native8,601 85.7% Asian1,771 79.1% Native Hawaiian / Pacific Islander7,989 86.2% Other race7,651 91.3% Two or more races32,386 88.9% White alone, not Hispanic / Latino14,546 87.6% Hispanic or LatinoMoved within same county 1,803 4.6% White / Caucasian889 9.1% Black or African American217 12.4% American Indian / Alaska Native981 9.8% Asian298 13.3% Native Hawaiian / Pacific Islander848 9.2% Other race289 3.4% Two or more races1,665 4.6% White alone, not Hispanic / Latino1,417 8.5% Hispanic or LatinoMoved within same state 1,733 4.5% White / Caucasian15 0.2% Black or African American5 0.3% American Indian / Alaska Native145 1.4% Asian1 0.1% Native Hawaiian / Pacific Islander62 0.7% Other race232 2.8% Two or more races1,604 4.4% White alone, not Hispanic / Latino189 1.1% Hispanic or LatinoMoved from different state 622 1.6% White / Caucasian8 0.1% Black or African American43 2.5% American Indian / Alaska Native67 0.7% Asian56 0.6% Other race206 2.5% Two or more races575 1.6% White alone, not Hispanic / Latino324 2.0% Hispanic or LatinoMoved from abroad 185 0.5% White139 1.4% Asian138 6.2% Native Hawaiian / Pacific Islander127 1.4% Other race185 0.5% White alone, not Hispanic / Latino134 0.8% Hispanic or Latino
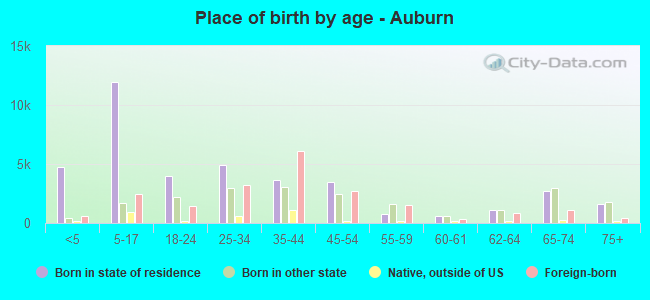
Children Nativity (place of birth) in Auburn
Children under 6 years - Living with two parents Both parents native 1,679 100.0% NativeBoth parents foreign-born 854 100.0% NativeOne native, one foreign-born parent 573 100.0% NativeChildren under 6 years - Living with one parent Native parent 2,203 100.0% NativeForeign-born parent 517 47.6% Native570 52.4% Foreign-bornChildren 6 to 17 years - Living with two parents Both parents native 3,459 100.0% NativeBoth parents foreign-born 3,071 69.6% Native1,342 30.4% Foreign-bornOne native, one foreign-born parent 963 100.0% NativeChildren 6 to 17 years - Living with one parent Native parent 3,164 100.0% NativeForeign-born parent 2,518 61.5% Native1,579 38.5% Foreign-born
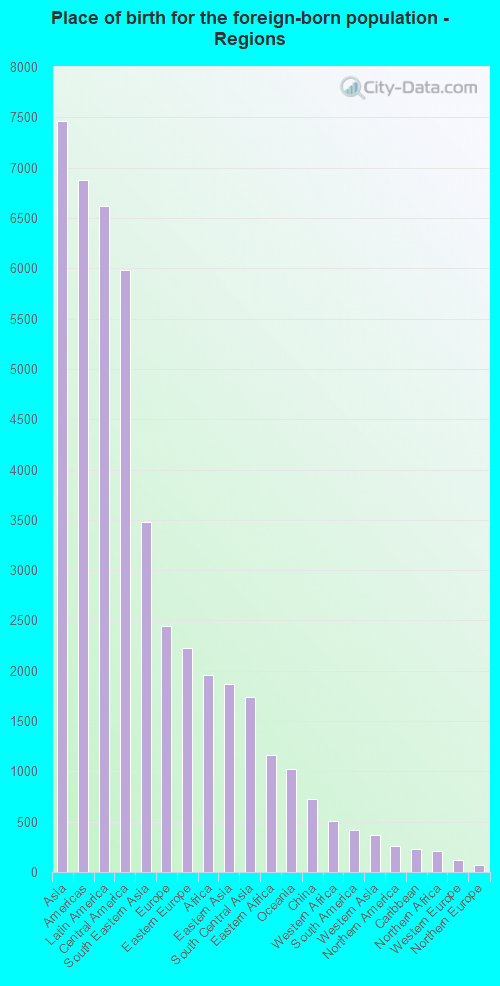
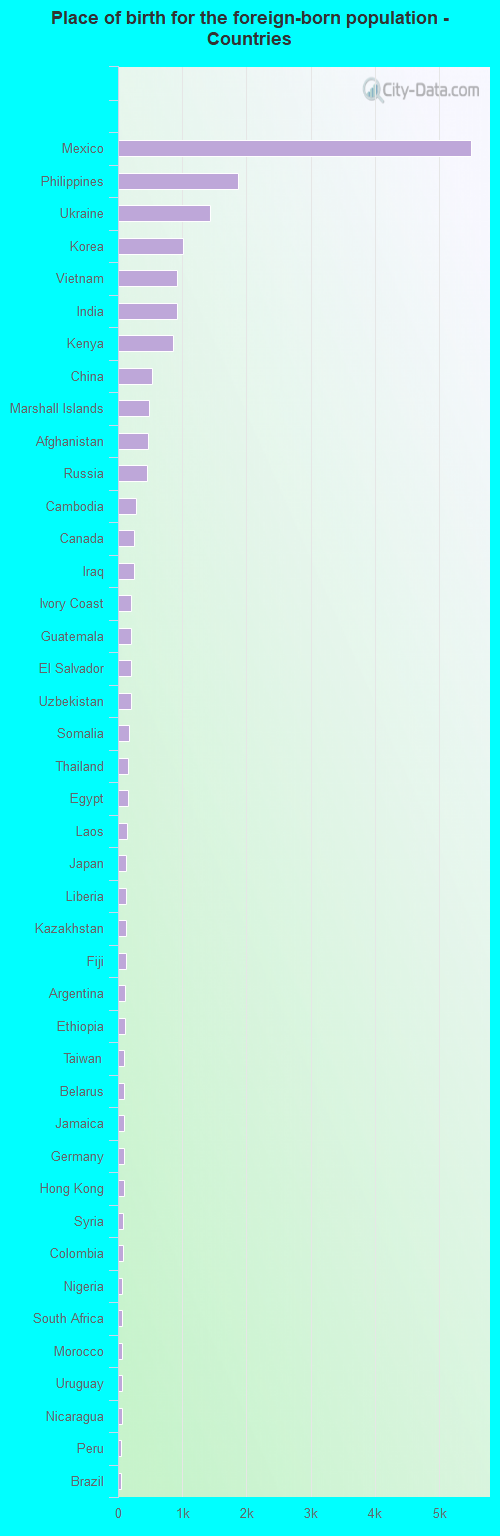
Place of birth for residents in Auburn 7,463 Asia6,875 Americas6,620 Latin America5,979 Central America3,482 South Eastern Asia2,442 Europe2,225 Eastern Europe1,955 Africa1,866 Eastern Asia1,744 South Central Asia1,165 Eastern Africa1,020 Oceania723 China504 Western Africa414 South America370 Western Asia254 Northern America226 Caribbean210 Northern Africa121 Western Europe73 Northern Europe66 Southern Africa44 Australia and New Zealand Subregion22 Southern Europe5,500 Mexico1,869 Philippines1,437 Ukraine1,014 Korea918 Vietnam913 India862 Kenya531 China485 Marshall Islands462 Afghanistan456 Russia279 Cambodia254 Canada248 Iraq210 Ivory Coast207 Guatemala203 El Salvador201 Uzbekistan173 Somalia160 Thailand152 Egypt133 Laos127 Japan122 Liberia121 Kazakhstan119 Fiji105 Argentina104 Ethiopia101 Taiwan101 Belarus98 Jamaica95 Germany90 Hong Kong81 Syria80 Colombia70 Nigeria66 South Africa58 Morocco56 Uruguay55 Nicaragua53 Peru50 Brazil48 Czechoslovakia48 Malaysia44 New Zealand39 Cuba37 Poland36 Sierra Leone33 Burma (Myanmar)31 Romania31 Bolivia29 Indonesia28 Turkey25 Tanzania25 Chile24 United Kingdom22 Ireland22 West Indies20 Bahamas18 Netherlands17 England17 Grenada15 Greece13 Ghana12 Honduras11 Lebanon10 Ecuador9 Singapore9 Moldova9 Bulgaria7 Austria6 Italy4 Hungary
Grandparents responsible for own grandchildren in Auburn
Grandparents (30 to 59 years) White / Caucasian 147 29.4% Responsible for grandchildren353 70.6% Not responsible for grandchildrenBlack or African American 51 100.0% Responsible for grandchildrenAmerican Indian / Alaska Native 6 73.1% Responsible for grandchildren2 26.9% Not responsible for grandchildrenAsian 8 6.2% Responsible for grandchildren113 93.8% Not responsible for grandchildrenNative Hawaiian / Pacific Islander 40 40.1% Responsible for grandchildren60 59.9% Not responsible for grandchildrenOther race 32 26.3% Responsible for grandchildren88 73.7% Not responsible for grandchildrenTwo or more races 92 71.3% Responsible for grandchildren37 28.7% Not responsible for grandchildrenWhite alone, not Hispanic / Latino 106 21.7% Responsible for grandchildren381 78.3% Not responsible for grandchildrenHispanic or Latino 100 44.4% Responsible for grandchildren125 55.6% Not responsible for grandchildrenGrandparents (60 years and over) White / Caucasian 208 37.3% Responsible for grandchildren349 62.7% Not responsible for grandchildrenBlack or African American 1 1.5% Responsible for grandchildren58 98.5% Not responsible for grandchildrenAmerican Indian / Alaska Native 12 100.0% Responsible for grandchildrenAsian 131 41.1% Responsible for grandchildren187 58.9% Not responsible for grandchildrenNative Hawaiian / Pacific Islander 16 9.3% Responsible for grandchildren153 90.7% Not responsible for grandchildrenOther race 33 100.0% Not responsible for grandchildrenWhite alone, not Hispanic / Latino 176 33.1% Responsible for grandchildren356 66.9% Not responsible for grandchildrenHispanic or Latino 33 45.4% Responsible for grandchildren39 54.6% Not responsible for grandchildren