Races in Augusta, Georgia (GA) Detailed Stats
Ancestries, Foreign-born residents, place of birth
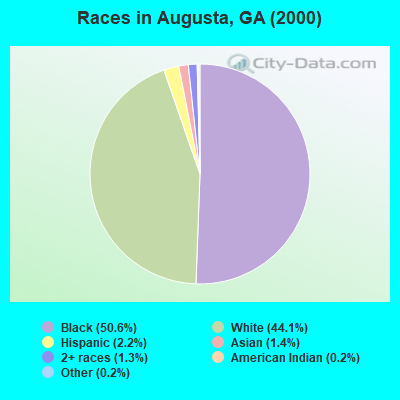
Race distribution in Augusta

- 69,83350.6%Black alone
- 60,88944.1%White alone
- 3,0102.2%Hispanic
- 1,9051.4%Asian alone
- 1,7681.3%Two or more races
- 2080.2%Other race alone
- 2970.2%American Indian alone
- 900.07%Native Hawaiian and Other
Pacific Islander alone
2000
2022
-
- 5,128,66162.6%White alone
- 2,331,46528.5%Black alone
- 435,2275.3%Hispanic
- 171,5132.1%Asian alone
- 87,3641.1%Two or more races
- 17,6700.2%American Indian alone
- 11,2750.1%Other race alone
- 3,2780.04%Native Hawaiian and Other
Pacific Islander alone

-
- 5,415,65749.6%White alone
- 3,349,24030.7%Black alone
- 1,132,60410.4%Hispanic
- 479,1564.4%Asian alone
- 462,9234.2%Two or more races
- 54,4160.5%Other race alone
- 11,9230.1%American Indian alone
- 6,9570.06%Native Hawaiian and Other
Pacific Islander alone

Income and house value in Augusta
- Median household income in 2022
- $63,773White non-Hispanic householders
- $37,044Black householders
- $43,350American Indian and Alaska Native householders
- $55,772Asian householders
- $39,816Some other race householders
- $40,668Two or more races householders
- $50,323Hispanic or Latino race householders
- Median 2022 house value
- $162,067White Non-Hispanic householders
- $118,823Black or African American householders
- $119,021American Indian or Alaska Native householders
- $167,225Asian householders
- $181,111Native Hawaiian and other Pacific Islander householders
- $180,714Some other race householders
- $158,695Two or more races householders
- $148,777Hispanic or Latino householders
Household income for White non-Hispanic householders

Household income for Black householders

Household income for American Indian and Alaska Native householders

Household income for Asian householders

Household income for Native Hawaiian and other Pacific Islander householders

Household income for Two or more races householders

Household income for Hispanic or Latino race householders

Zip code: 30904