Races in Aurora, Illinois (IL) Detailed Stats
Data:
Races - White alone (%)
Races - White alone (% change since 2000)
Races - Black alone (%)
Races - Black alone (% change since 2000)
Races - American Indian alone (%)
Races - American Indian alone (% change since 2000)
Races - Asian alone (%)
Races - Asian alone (% change since 2000)
Races - Hispanic (%)
Races - Hispanic (% change since 2000)
Races - Native Hawaiian and Other Pacific Islander alone (%)
Races - Native Hawaiian and Other Pacific Islander alone (% change since 2000)
Races - Two or more races(%)
Races - Two or more races(% change since 2000)
Races - Other race alone (%)
Races - Other race alone (% change since 2000)
Racial diversity
Place of birth - Born in state of residence (%)
Place of birth - Born in state of residence (%) - White
Place of birth - Born in state of residence (%) - Black or African American
Place of birth - Born in state of residence (%) - Asian
Place of birth - Born in state of residence (%) - Hispanic or Latino
Place of birth - Born in state of residence (%) - American Indian and Alaska Native
Place of birth - Born in state of residence (%) - Multirace
Place of birth - Born in state of residence (%) - Other Race
Place of birth - Born in other state (%)
Place of birth - Born in other state (%) - White
Place of birth - Born in other state (%) - Black or African American
Place of birth - Born in other state (%) - Asian
Place of birth - Born in other state (%) - Hispanic or Latino
Place of birth - Born in other state (%) - American Indian and Alaska Native
Place of birth - Born in other state (%) - Multirace
Place of birth - Born in other state (%) - Other Race
Place of birth - Native, outside of US (%)
Place of birth - Native, outside of US (%) - White
Place of birth - Native, outside of US (%) - Black or African American
Place of birth - Native, outside of US (%) - Asian
Place of birth - Native, outside of US (%) - Hispanic or Latino
Place of birth - Native, outside of US (%) - American Indian and Alaska Native
Place of birth - Native, outside of US (%) - Multirace
Place of birth - Native, outside of US (%) - Other Race
Place of birth - Foreign born (%)
Place of birth - Foreign born (%) - White
Place of birth - Foreign born (%) - Black or African American
Place of birth - Foreign born (%) - Asian
Place of birth - Foreign born (%) - Hispanic or Latino
Place of birth - Foreign born (%) - American Indian and Alaska Native
Place of birth - Foreign born (%) - Multirace
Place of birth - Foreign born (%) - Other Race
Residents speaking English at home (%)
Residents speaking English at home - Born in the United States (%)
Residents speaking English at home - Native, born elsewhere (%)
Residents speaking English at home - Foreign born (%)
Residents speaking Spanish at home (%)
Residents speaking Spanish at home - Born in the United States (%)
Residents speaking Spanish at home - Native, born elsewhere (%)
Residents speaking Spanish at home - Foreign born (%)
Residents speaking other language at home (%)
Residents speaking other language at home - Born in the United States (%)
Residents speaking other language at home - Native, born elsewhere (%)
Residents speaking other language at home - Foreign born (%)
Marital status - Never married (%)
Marital status - Now married (%)
Marital status - Separated (%)
Marital status - Widowed (%)
Marital status - Divorced (%)
Ancestries Reported - Arab (%)
Ancestries Reported - Czech (%)
Ancestries Reported - Danish (%)
Ancestries Reported - Dutch (%)
Ancestries Reported - English (%)
Ancestries Reported - French (%)
Ancestries Reported - French Canadian (%)
Ancestries Reported - German (%)
Ancestries Reported - Greek (%)
Ancestries Reported - Hungarian (%)
Ancestries Reported - Irish (%)
Ancestries Reported - Italian (%)
Ancestries Reported - Lithuanian (%)
Ancestries Reported - Norwegian (%)
Ancestries Reported - Polish (%)
Ancestries Reported - Portuguese (%)
Ancestries Reported - Russian (%)
Ancestries Reported - Scotch-Irish (%)
Ancestries Reported - Scottish (%)
Ancestries Reported - Slovak (%)
Ancestries Reported - Subsaharan African (%)
Ancestries Reported - Swedish (%)
Ancestries Reported - Swiss (%)
Ancestries Reported - Ukrainian (%)
Ancestries Reported - United States (%)
Ancestries Reported - Welsh (%)
Ancestries Reported - West Indian (%)
Ancestries Reported - Other (%)
Geographical mobility - Same house 1 year ago (%)
Geographical mobility - Same house 1 year ago (%) - White
Geographical mobility - Same house 1 year ago (%) - Black or African American
Geographical mobility - Same house 1 year ago (%) - Asian
Geographical mobility - Same house 1 year ago (%) - Hispanic or Latino
Geographical mobility - Same house 1 year ago (%) - American Indian and Alaska Native
Geographical mobility - Same house 1 year ago (%) - Multirace
Geographical mobility - Same house 1 year ago (%) - Other Race
Geographical mobility - Moved within same county (%)
Geographical mobility - Moved within same county (%) - White
Geographical mobility - Moved within same county (%) - Black or African American
Geographical mobility - Moved within same county (%) - Asian
Geographical mobility - Moved within same county (%) - Hispanic or Latino
Geographical mobility - Moved within same county (%) - American Indian and Alaska Native
Geographical mobility - Moved within same county (%) - Multirace
Geographical mobility - Moved within same county (%) - Other Race
Geographical mobility - Moved from different county within same state (%)
Geographical mobility - Moved from different county within same state (%) - White
Geographical mobility - Moved from different county within same state (%) - Black or African American
Geographical mobility - Moved from different county within same state (%) - Asian
Geographical mobility - Moved from different county within same state (%) - Hispanic or Latino
Geographical mobility - Moved from different county within same state (%) - American Indian and Alaska Native
Geographical mobility - Moved from different county within same state (%) - Multirace
Geographical mobility - Moved from different county within same state (%) - Other Race
Geographical mobility - Moved from different state (%)
Geographical mobility - Moved from different state (%) - White
Geographical mobility - Moved from different state (%) - Black or African American
Geographical mobility - Moved from different state (%) - Asian
Geographical mobility - Moved from different state (%) - Hispanic or Latino
Geographical mobility - Moved from different state (%) - American Indian and Alaska Native
Geographical mobility - Moved from different state (%) - Multirace
Geographical mobility - Moved from different state (%) - Other Race
Geographical mobility - Moved from abroad (%)
Geographical mobility - Moved from abroad (%) - White
Geographical mobility - Moved from abroad (%) - Black or African American
Geographical mobility - Moved from abroad (%) - Asian
Geographical mobility - Moved from abroad (%) - Hispanic or Latino
Geographical mobility - Moved from abroad (%) - American Indian and Alaska Native
Geographical mobility - Moved from abroad (%) - Multirace
Geographical mobility - Moved from abroad (%) - Other Race
Place of birth for the foreign-born population - Ireland (%)
Place of birth for the foreign-born population - Denmark (%)
Place of birth for the foreign-born population - Norway (%)
Place of birth for the foreign-born population - Sweden (%)
Place of birth for the foreign-born population - United Kingdom (%)
Place of birth for the foreign-born population - England (%)
Place of birth for the foreign-born population - Scotland (%)
Place of birth for the foreign-born population - Other Northern Europe (%)
Place of birth for the foreign-born population - Austria (%)
Place of birth for the foreign-born population - Belgium (%)
Place of birth for the foreign-born population - France (%)
Place of birth for the foreign-born population - Germany (%)
Place of birth for the foreign-born population - Netherlands (%)
Place of birth for the foreign-born population - Switzerland (%)
Place of birth for the foreign-born population - Other Western Europe (%)
Place of birth for the foreign-born population - Greece (%)
Place of birth for the foreign-born population - Italy (%)
Place of birth for the foreign-born population - Portugal (%)
Place of birth for the foreign-born population - Spain (%)
Place of birth for the foreign-born population - Other Southern Europe (%)
Place of birth for the foreign-born population - Albania (%)
Place of birth for the foreign-born population - Belarus (%)
Place of birth for the foreign-born population - Bosnia and Herzegovina (%)
Place of birth for the foreign-born population - Bulgaria (%)
Place of birth for the foreign-born population - Croatia (%)
Place of birth for the foreign-born population - Czechoslovakia (%)
Place of birth for the foreign-born population - Hungary (%)
Place of birth for the foreign-born population - Latvia (%)
Place of birth for the foreign-born population - Lithuania (%)
Place of birth for the foreign-born population - North Macedonia (Macedonia) (%)
Place of birth for the foreign-born population - Moldova (%)
Place of birth for the foreign-born population - Poland (%)
Place of birth for the foreign-born population - Romania (%)
Place of birth for the foreign-born population - Russia (%)
Place of birth for the foreign-born population - Serbia (%)
Place of birth for the foreign-born population - Ukraine (%)
Place of birth for the foreign-born population - Other Eastern Europe (%)
Place of birth for the foreign-born population - China (%)
Place of birth for the foreign-born population - Hong Kong (%)
Place of birth for the foreign-born population - Taiwan (%)
Place of birth for the foreign-born population - Japan (%)
Place of birth for the foreign-born population - Korea (%)
Place of birth for the foreign-born population - Other Eastern Asia (%)
Place of birth for the foreign-born population - Afghanistan (%)
Place of birth for the foreign-born population - Bangladesh (%)
Place of birth for the foreign-born population - India (%)
Place of birth for the foreign-born population - Iran (%)
Place of birth for the foreign-born population - Kazakhstan (%)
Place of birth for the foreign-born population - Nepal (%)
Place of birth for the foreign-born population - Pakistan (%)
Place of birth for the foreign-born population - Sri Lanka (%)
Place of birth for the foreign-born population - Uzbekistan (%)
Place of birth for the foreign-born population - Other South Central Asia (%)
Place of birth for the foreign-born population - Burma (%)
Place of birth for the foreign-born population - Cambodia (%)
Place of birth for the foreign-born population - Indonesia (%)
Place of birth for the foreign-born population - Laos (%)
Place of birth for the foreign-born population - Malaysia (%)
Place of birth for the foreign-born population - Philippines (%)
Place of birth for the foreign-born population - Singapore (%)
Place of birth for the foreign-born population - Thailand (%)
Place of birth for the foreign-born population - Vietnam (%)
Place of birth for the foreign-born population - Other South Eastern Asia (%)
Place of birth for the foreign-born population - Armenia (%)
Place of birth for the foreign-born population - Iraq (%)
Place of birth for the foreign-born population - Israel (%)
Place of birth for the foreign-born population - Jordan (%)
Place of birth for the foreign-born population - Kuwait (%)
Place of birth for the foreign-born population - Lebanon (%)
Place of birth for the foreign-born population - Saudi Arabia (%)
Place of birth for the foreign-born population - Syria (%)
Place of birth for the foreign-born population - Turkey (%)
Place of birth for the foreign-born population - Yemen (%)
Place of birth for the foreign-born population - Other Western Asia (%)
Place of birth for the foreign-born population - Eritrea (%)
Place of birth for the foreign-born population - Ethiopia (%)
Place of birth for the foreign-born population - Kenya (%)
Place of birth for the foreign-born population - Somalia (%)
Place of birth for the foreign-born population - Uganda (%)
Place of birth for the foreign-born population - Zimbabwe (%)
Place of birth for the foreign-born population - Other Eastern Africa (%)
Place of birth for the foreign-born population - Cameroon (%)
Place of birth for the foreign-born population - Congo (%)
Place of birth for the foreign-born population - Democratic Republic of Congo (Zaire) (%)
Place of birth for the foreign-born population - Other Middle Africa (%)
Place of birth for the foreign-born population - Egypt (%)
Place of birth for the foreign-born population - Morocco (%)
Place of birth for the foreign-born population - Sudan (%)
Place of birth for the foreign-born population - Other Northern Africa (%)
Place of birth for the foreign-born population - South Africa (%)
Place of birth for the foreign-born population - Other Southern Africa (%)
Place of birth for the foreign-born population - Cabo Verde (%)
Place of birth for the foreign-born population - Ghana (%)
Place of birth for the foreign-born population - Liberia (%)
Place of birth for the foreign-born population - Nigeria (%)
Place of birth for the foreign-born population - Senegal (%)
Place of birth for the foreign-born population - Sierra Leone (%)
Place of birth for the foreign-born population - Other Western Africa (%)
Place of birth for the foreign-born population - Australia (%)
Place of birth for the foreign-born population - New Zealand (%)
Place of birth for the foreign-born population - Fiji (%)
Place of birth for the foreign-born population - Micronesia (%)
Place of birth for the foreign-born population - Bahamas (%)
Place of birth for the foreign-born population - Barbados (%)
Place of birth for the foreign-born population - Cuba (%)
Place of birth for the foreign-born population - Dominica (%)
Place of birth for the foreign-born population - Dominican Republic (%)
Place of birth for the foreign-born population - Grenada (%)
Place of birth for the foreign-born population - Haiti (%)
Place of birth for the foreign-born population - Jamaica (%)
Place of birth for the foreign-born population - St. Vincent and the Grenadines (%)
Place of birth for the foreign-born population - Trinidad and Tobago (%)
Place of birth for the foreign-born population - West Indies (%)
Place of birth for the foreign-born population - Other Caribbean (%)
Place of birth for the foreign-born population - Belize (%)
Place of birth for the foreign-born population - Costa Rica (%)
Place of birth for the foreign-born population - El Salvador (%)
Place of birth for the foreign-born population - Guatemala (%)
Place of birth for the foreign-born population - Honduras (%)
Place of birth for the foreign-born population - Mexico (%)
Place of birth for the foreign-born population - Nicaragua (%)
Place of birth for the foreign-born population - Panama (%)
Place of birth for the foreign-born population - Other Central America (%)
Place of birth for the foreign-born population - Argentina (%)
Place of birth for the foreign-born population - Bolivia (%)
Place of birth for the foreign-born population - Brazil (%)
Place of birth for the foreign-born population - Chile (%)
Place of birth for the foreign-born population - Colombia (%)
Place of birth for the foreign-born population - Ecuador (%)
Place of birth for the foreign-born population - Guyana (%)
Place of birth for the foreign-born population - Peru (%)
Place of birth for the foreign-born population - Uruguay (%)
Place of birth for the foreign-born population - Venezuela (%)
Place of birth for the foreign-born population - Other South America (%)
Place of birth for the foreign-born population - Canada (%)
Place of birth for the foreign-born population - Other Northern America (%)
Place of birth for the foreign-born population - Other (%)
Latest news about races in Aurora, IL collected exclusively by city-data.com from local newspapers, TV, and radio stations
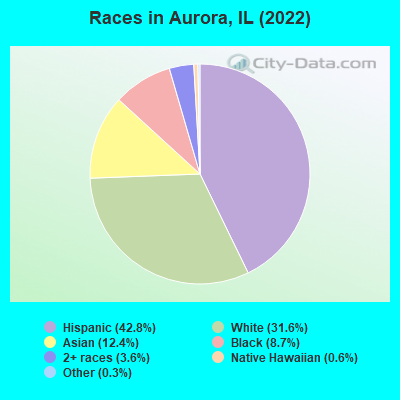
According to 2022 data, the most numerous races in Aurora, IL are White alone (57,531 residents), Hispanic (78,111 residents), and Black alone (15,794 residents). 51.3% of Aurora residents speak English at home. 25.8% of Aurora, IL residents are foreign-born (15.6% born in Latin America, 7.6% born in Asia), which is 45.8% greater than the foreign-born rate of 14.0% across the entire state of Illinois.
Race distribution in Aurora
2000 2022
74,457 52.1% White alone 46,557 32.6% Hispanic 15,389 10.8% Black alone 4,313 3.0% Asian alone 1,907 1.3% Two or more races 153 0.1% Other race alone 186 0.1% American Indian alone 28 0.02% Native Hawaiian and Other
78,111 42.8% Hispanic 57,531 31.6% White alone 22,622 12.4% Asian alone 15,794 8.7% Black alone 6,537 3.6% Two or more races 1,133 0.6% Native Hawaiian and Other 573 0.3% Other race alone 35 0.02% American Indian alone
2000 2022
8,424,140 67.8% White alone 1,856,152 14.9% Black alone 1,530,262 12.3% Hispanic 419,916 3.4% Asian alone 153,996 1.2% Two or more races 13,479 0.1% Other race alone 18,232 0.1% American Indian alone 3,116 0.03% Native Hawaiian and Other
7,356,301 58.5% White alone 2,299,726 18.3% Hispanic 1,660,423 13.2% Black alone 747,296 5.9% Asian alone 458,599 3.6% Two or more races 45,386 0.4% Other race alone 10,405 0.08% American Indian alone 3,896 0.03% Native Hawaiian and Other
Income and house value in Aurora Median household income in 2022 $88,875 White non-Hispanic householders$59,027 Black householders$64,949 American Indian and Alaska Native householders$150,047 Asian householders$73,412 Some other race householders$76,186 Two or more races householders$74,480 Hispanic or Latino race householdersMedian 2022 house value $293,931 White Non-Hispanic householders$238,049 Black or African American householders$180,756 American Indian or Alaska Native householders $405,693 Asian householders$178,133 Native Hawaiian and other Pacific Islander householders$198,509 Some other race householders$220,095 Two or more races householders$200,526 Hispanic or Latino householders
Median age by race in Aurora
42.2 Median age for White residents41.2 43.1 34.5 Median age for Black or African American residents30.6 38.7 23.0 Median age for American Indian / Alaska Native residents37.5 22.0 37.0 Median age for Asian residents37.4 36.8 21.2 Median age for Native Hawaiian / Pacific Islander residents14.1 22.0 31.4 Median age for Other race residents35.3 26.8 28.7 Median age for Two or more races residents26.5 29.9 43.7 Median age for White alone residents42.6 46.4 29.1 Median age for Hispanic or Latino residents29.3 28.8
Owner/renter occupied households by race in Aurora
House owners and renters - White residents 20,990 74.3% Owner occupied7,244 25.7% Renter occupiedHouse owners and renters - Black or African American residents 3,283 51.8% Owner occupied3,059 48.2% Renter occupiedHouse owners and renters - American Indian / Alaska Native residents 510 73.8% Owner occupied181 26.2% Renter occupiedHouse owners and renters - Asian residents 6,316 83.2% Owner occupied1,279 16.8% Renter occupiedHouse owners and renters - Native Hawaiian / Pacific Islander residents 24 100.0% Owner occupiedHouse owners and renters - Other race residents 5,847 65.6% Owner occupied3,061 34.4% Renter occupiedHouse owners and renters - Two or more races residents 6,575 56.8% Owner occupied5,006 43.2% Renter occupiedHouse owners and renters - White alone residents 19,821 75.3% Owner occupied6,514 24.7% Renter occupiedHouse owners and renters - Hispanic or Latino residents 13,483 62.9% Owner occupied7,965 37.1% Renter occupied
Language usage in Aurora
English speakers - Total 51.3% of residents of Aurora speak English at home.
34.3% of residents speak Spanish at home 37,043 62.7% Speak English very well22,055 37.3% Speak English less than very well14.4% of residents speak other language at home 20,037 80.5% Speak English very well4,845 19.5% Speak English less than very well
English speakers - Born in the United States 81.9% of residents of Aurora speak English at home.
12.7% of residents speak Spanish at home 2,833 95.1% Speak English very well146 4.9% Speak English less than very well5.4% of residents speak other language at home 1,096 86.4% Speak English very well172 13.6% Speak English less than very well
English speakers - Native, born elsewhere 42.2% of residents of Aurora speak English at home.
45.3% of residents speak Spanish at home 1,290 64.9% Speak English very well699 35.1% Speak English less than very well12.6% of residents speak other language at home 552 100.0% Speak English very well
English speakers - Foreign-born 9.3% of residents of Aurora speak English at home.
53.2% of residents speak Spanish at home 9,397 34.0% Speak English very well18,230 66.0% Speak English less than very well37.5% of residents speak other language at home 15,043 77.3% Speak English very well4,423 22.7% Speak English less than very well
White (Caucasian) - Speak only English Native:
88.7% (52,744)Foreign-born:
13.7% (724)
White (Caucasian) - Speak another language Native:
11.3% (6,729)Foreign-born:
86.3% (4,575)
Black or African American - Speak only English Native:
98.0% (15,182)Foreign-born:
53.2% (292)
Black or African American - Speak another language Native:
2.0% (315)Foreign-born:
49.3% (271)
American Indian / Alaska Native - Speak only English Native:
17.7% (341)Foreign-born:
6.1% (51)
American Indian / Alaska Native - Speak another language Native:
82.3% (1,592)Foreign-born:
92.6% (766)
Asian - Speak only English Native:
50.9% (2,706)Foreign-born:
11.8% (1,935)
Asian - Speak another language Native:
49.1% (2,608)Foreign-born:
88.2% (14,466)
Native Hawaiian / Pacific Islander - Speak another language Native:
31.2% (41)Foreign-born:
100.0% (161)
Other race - Speak only English Native:
28.8% (4,425)Foreign-born:
9.5% (1,351)
Other race - Speak another language Native:
71.2% (10,956)Foreign-born:
90.5% (12,907)
Two or more races - Speak only English Native:
39.8% (9,554)Foreign-born:
4.1% (558)
Two or more races - Speak another language Native:
60.2% (14,479)Foreign-born:
95.9% (13,141)
White alone - Speak only English Native:
97.1% (50,653)Foreign-born:
19.4% (724)
White alone - Speak another language Native:
2.9% (1,487)Foreign-born:
80.6% (3,001)
Hispanic or Latino - Speak only English Native:
28.6% (12,489)Foreign-born:
6.2% (1,825)
Hispanic or Latino - Speak another language Native:
71.4% (31,232)Foreign-born:
93.8% (27,818)
Foreign-born residents in Aurora 46,538 residents are foreign born (15.6% Latin America , 7.6% Asia ).
This city:
25.8%Illinois:
14.1%
Marital status for residents in Aurora Marital status - White (Caucasian) population 15 years and over
Males 40.7% Never married48.0% Now married1.4% Separated1.2% Widowed8.8% DivorcedFemales 31.6% Never married43.3% Now married2.7% Separated9.4% Widowed13.0% DivorcedWomen who gave birth in the past 12 months Now married:
100.0% (291)Unmarried:
0.0% (0)
Women who did not give birth in the past 12 months Now married:
38.2% (5,902)Unmarried:
61.8% (9,548)
Marital status - Black or African American population 15 years and over
Males 59.9% Never married27.0% Now married1.2% Separated0.0% Widowed11.9% DivorcedFemales 48.4% Never married19.2% Now married4.1% Separated1.8% Widowed26.5% DivorcedWomen who gave birth in the past 12 months Now married:
23.9% (37)Unmarried:
76.1% (118)
Women who did not give birth in the past 12 months Now married:
27.6% (1,072)Unmarried:
72.4% (2,814)
Marital status - American Indian / Alaska Native population 15 years and over
Males 36.0% Never married57.9% Now married0.0% Separated0.0% Widowed6.1% DivorcedFemales 48.5% Never married33.4% Now married3.7% Separated5.5% Widowed8.9% DivorcedWomen who gave birth in the past 12 months Now married:
20.0% (18)Unmarried:
80.0% (73)
Women who did not give birth in the past 12 months Now married:
29.2% (333)Unmarried:
70.8% (809)
Marital status - Asian population 15 years and over
Males 19.5% Never married77.7% Now married0.0% Separated0.0% Widowed2.8% DivorcedFemales 23.8% Never married68.5% Now married0.0% Separated6.6% Widowed1.1% DivorcedWomen who gave birth in the past 12 months Now married:
100.0% (483)Unmarried:
0.0% (0)
Women who did not give birth in the past 12 months Now married:
64.0% (3,711)Unmarried:
36.0% (2,089)
Marital status - Native Hawaiian / Pacific Islander population 15 years and over
Males 0.0% Never married88.5% Now married0.0% Separated11.5% Widowed0.0% DivorcedFemales 58.3% Never married22.6% Now married9.5% Separated9.5% Widowed0.0% DivorcedWomen who did not give birth in the past 12 months Now married:
27.9% (29)Unmarried:
72.1% (74)
Marital status - Other race population 15 years and over
Males 38.4% Never married52.6% Now married0.4% Separated2.4% Widowed6.2% DivorcedFemales 47.6% Never married39.2% Now married4.8% Separated5.4% Widowed3.1% DivorcedWomen who gave birth in the past 12 months Now married:
28.3% (39)Unmarried:
71.7% (99)
Women who did not give birth in the past 12 months Now married:
37.4% (3,710)Unmarried:
62.6% (6,223)
Marital status - Two or more races population 15 years and over
Males 50.2% Never married42.8% Now married2.6% Separated0.8% Widowed3.6% DivorcedFemales 42.0% Never married41.1% Now married2.4% Separated4.1% Widowed10.4% DivorcedWomen who gave birth in the past 12 months Now married:
46.9% (129)Unmarried:
53.1% (146)
Women who did not give birth in the past 12 months Now married:
40.5% (4,536)Unmarried:
59.5% (6,659)
Marital status - White alone, not Hispanic / Latino population 15 years and over
Males 37.5% Never married51.6% Now married0.9% Separated1.4% Widowed8.7% DivorcedFemales 26.1% Never married46.7% Now married2.6% Separated10.3% Widowed14.3% DivorcedWomen who gave birth in the past 12 months Now married:
100.0% (206)Unmarried:
0.0% (0)
Women who did not give birth in the past 12 months Now married:
43.8% (5,311)Unmarried:
56.2% (6,805)
Marital status - Hispanic or Latino population 15 years and over
Males 46.2% Never married45.4% Now married1.5% Separated1.4% Widowed5.5% DivorcedFemales 46.1% Never married38.3% Now married3.4% Separated5.1% Widowed7.0% DivorcedWomen who gave birth in the past 12 months Now married:
45.0% (238)Unmarried:
55.0% (291)
Women who did not give birth in the past 12 months Now married:
36.2% (8,503)Unmarried:
63.8% (15,018)
Ancestries in Aurora
5,086 5.3% German2,306 2.4% Italian2,247 2.3% Irish2,078 2.1% American2,077 2.1% Polish1,740 1.8% English1,495 1.5% European722 0.7% Romanian702 0.7% Syrian664 0.7% Nigerian558 0.6% African498 0.5% Norwegian454 0.5% Russian393 0.4% Swedish321 0.3% Albanian286 0.3% Bulgarian273 0.3% Ukrainian227 0.2% Greek225 0.2% Scottish202 0.2% Eastern European179 0.2% Jamaican170 0.2% Czech159 0.2% Scotch-Irish144 0.1% Luxembourger133 0.1% Lithuanian133 0.1% French133 0.1% Scandinavian132 0.1% French Canadian126 0.1% Iraqi107 0.1% Croatian102 0.1% Welsh92 0.10% Iranian87 0.09% Dutch77 0.08% Lebanese65 0.07% Hungarian58 0.06% Palestinian53 0.05% Serbian50 0.05% Icelander49 0.05% Afghan49 0.05% Slovak48 0.05% Belgian48 0.05% Northern European46 0.05% Danish44 0.05% British37 0.04% Ethiopian37 0.04% Czechoslovakian37 0.04% Ugandan35 0.04% Cape Verdean30 0.03% Macedonian29 0.03% Slavic28 0.03% Trinidadian and Tobagonian27 0.03% Jordanian27 0.03% Finnish26 0.03% Slovene25 0.03% Canadian23 0.02% Egyptian23 0.02% Turkish20 0.02% Cypriot18 0.02% Yugoslavian16 0.02% Austrian15 0.02% Moroccan13 0.01% Belizean12 0.01% Guyanese10 0.01% Brazilian9 0.01% Estonian8 0.01% Swiss
Geographical mobility in Aurora Same house 1 year ago 61,176 92.3% White (Caucasian)14,898 92.9% Black or African American2,958 98.0% American Indian / Alaska Native18,612 82.0% Asian226 99.6% Native Hawaiian / Pacific Islander28,708 94.5% Other race37,061 88.0% Two or more races52,876 92.4% White alone, not Hispanic / Latino70,299 90.6% Hispanic or LatinoMoved within same county 1,123 1.7% White / Caucasian566 3.5% Black or African American10 0.3% American Indian / Alaska Native929 4.1% Asian814 2.7% Other race3,665 8.7% Two or more races919 1.6% White alone, not Hispanic / Latino4,486 5.8% Hispanic or LatinoMoved within same state 2,747 4.1% White / Caucasian534 3.3% Black or African American34 1.1% American Indian / Alaska Native1,842 8.1% Asian3 1.5% Native Hawaiian / Pacific Islander509 1.7% Other race1,005 2.4% Two or more races2,551 4.5% White alone, not Hispanic / Latino1,724 2.2% Hispanic or LatinoMoved from different state 454 0.7% White / Caucasian31 0.2% Black or African American12 0.4% American Indian / Alaska Native301 1.3% Asian271 0.9% Other race31 0.1% Two or more races386 0.7% White alone, not Hispanic / Latino370 0.5% Hispanic or LatinoMoved from abroad 796 1.2% White1,003 4.4% Asian61 0.2% Other race339 0.8% Two or more races524 0.9% White alone, not Hispanic / Latino672 0.9% Hispanic or Latino
Children Nativity (place of birth) in Aurora
Children under 6 years - Living with two parents Both parents native 3,405 100.0% NativeBoth parents foreign-born 2,498 98.4% Native40 1.6% Foreign-bornOne native, one foreign-born parent 1,193 100.0% NativeChildren under 6 years - Living with one parent Native parent 3,659 100.0% NativeForeign-born parent 448 100.0% NativeChildren 6 to 17 years - Living with two parents Both parents native 6,571 100.0% NativeBoth parents foreign-born 7,466 75.3% Native2,455 24.7% Foreign-bornOne native, one foreign-born parent 2,744 100.0% NativeChildren 6 to 17 years - Living with one parent Native parent 8,676 100.0% NativeForeign-born parent 2,742 55.2% Native2,222 44.8% Foreign-born
Place of birth for residents in Aurora 28,688 Americas28,421 Latin America26,550 Central America13,841 Asia9,028 South Central Asia2,900 Europe2,805 South Eastern Asia2,186 Eastern Europe1,481 Eastern Asia1,259 China1,109 South America973 Africa761 Caribbean600 Western Africa526 Western Asia337 Northern Europe267 Northern America266 Western Europe173 Eastern Africa133 Oceania123 Middle Africa110 Southern Europe66 Northern Africa10 Southern Africa9 Australia and New Zealand Subregion25,729 Mexico7,407 India1,595 Philippines1,111 China746 Pakistan487 Nigeria479 Russia439 Vietnam421 Cuba416 Poland397 Moldova335 El Salvador321 Colombia267 Canada245 Germany228 United Arab Emirates224 Guatemala223 Uzbekistan219 Albania214 Laos212 Nepal201 Bulgaria170 Argentina168 Burma (Myanmar)155 Ecuador155 Korea152 United Kingdom135 Jamaica135 Bangladesh132 Dominican Republic132 Thailand128 Malaysia124 Honduras123 Afghanistan121 Nicaragua113 Venezuela112 Democratic Republic of Congo (Zaire)103 Liberia98 Lithuania96 Bhutan94 Scotland94 Hong Kong93 Brazil93 Iraq83 Ukraine79 Bolivia73 Guyana69 Indonesia68 North Macedonia (Macedonia)66 Trinidad and Tobago60 Peru57 Singapore54 Taiwan51 Iran50 Syria50 Czechoslovakia48 Serbia47 Greece42 Kuwait42 Chile41 Hungary40 Tanzania38 Uganda38 Egypt36 England33 Romania32 Italy32 Sri Lanka31 Spain28 Kenya27 Jordan27 Sweden25 Saudi Arabia21 France19 Lebanon19 Japan18 Ethiopia17 Eritrea15 Denmark13 Belarus12 Ireland11 Belize11 Azerbaijan10 Togo9 Morocco9 Australia8 Croatia7 Turkey7 Bosnia and Herzegovina6 Haiti5 Costa Rica
Grandparents responsible for own grandchildren in Aurora
Grandparents (30 to 59 years) White / Caucasian 218 29.6% Responsible for grandchildren520 70.4% Not responsible for grandchildrenBlack or African American 38 22.8% Responsible for grandchildren129 77.2% Not responsible for grandchildrenAmerican Indian / Alaska Native 20 28.7% Responsible for grandchildren49 71.3% Not responsible for grandchildrenAsian 146 100.0% Not responsible for grandchildrenOther race 262 47.9% Responsible for grandchildren285 52.1% Not responsible for grandchildrenTwo or more races 57 6.3% Responsible for grandchildren838 93.7% Not responsible for grandchildrenWhite alone, not Hispanic / Latino 15 6.9% Responsible for grandchildren206 93.1% Not responsible for grandchildrenHispanic or Latino 175 12.0% Responsible for grandchildren1,287 88.0% Not responsible for grandchildrenGrandparents (60 years and over) White / Caucasian 146 20.0% Responsible for grandchildren583 80.0% Not responsible for grandchildrenBlack or African American 46 47.6% Responsible for grandchildren51 52.4% Not responsible for grandchildrenAmerican Indian / Alaska Native 27 100.0% Not responsible for grandchildrenAsian 64 9.3% Responsible for grandchildren624 90.7% Not responsible for grandchildrenOther race 37 28.2% Responsible for grandchildren94 71.8% Not responsible for grandchildrenTwo or more races 363 33.6% Responsible for grandchildren717 66.4% Not responsible for grandchildrenWhite alone, not Hispanic / Latino 88 17.0% Responsible for grandchildren426 83.0% Not responsible for grandchildrenHispanic or Latino 172 14.6% Responsible for grandchildren1,008 85.4% Not responsible for grandchildren
Zip codes: 60502 , 60503 , 60504 , 60505 , 60506 , 60510 , 60519 , 60538 , 60542 , 60543 , 60554 , 60563 , 60564 , 60585 .