Races in Austell, Georgia (GA) Detailed Stats
Data:
Races - White alone (%)
Races - White alone (% change since 2000)
Races - Black alone (%)
Races - Black alone (% change since 2000)
Races - American Indian alone (%)
Races - American Indian alone (% change since 2000)
Races - Asian alone (%)
Races - Asian alone (% change since 2000)
Races - Hispanic (%)
Races - Hispanic (% change since 2000)
Races - Native Hawaiian and Other Pacific Islander alone (%)
Races - Native Hawaiian and Other Pacific Islander alone (% change since 2000)
Races - Two or more races(%)
Races - Two or more races(% change since 2000)
Races - Other race alone (%)
Races - Other race alone (% change since 2000)
Racial diversity
Place of birth - Born in state of residence (%)
Place of birth - Born in state of residence (%) - White
Place of birth - Born in state of residence (%) - Black or African American
Place of birth - Born in state of residence (%) - Asian
Place of birth - Born in state of residence (%) - Hispanic or Latino
Place of birth - Born in state of residence (%) - American Indian and Alaska Native
Place of birth - Born in state of residence (%) - Multirace
Place of birth - Born in state of residence (%) - Other Race
Place of birth - Born in other state (%)
Place of birth - Born in other state (%) - White
Place of birth - Born in other state (%) - Black or African American
Place of birth - Born in other state (%) - Asian
Place of birth - Born in other state (%) - Hispanic or Latino
Place of birth - Born in other state (%) - American Indian and Alaska Native
Place of birth - Born in other state (%) - Multirace
Place of birth - Born in other state (%) - Other Race
Place of birth - Native, outside of US (%)
Place of birth - Native, outside of US (%) - White
Place of birth - Native, outside of US (%) - Black or African American
Place of birth - Native, outside of US (%) - Asian
Place of birth - Native, outside of US (%) - Hispanic or Latino
Place of birth - Native, outside of US (%) - American Indian and Alaska Native
Place of birth - Native, outside of US (%) - Multirace
Place of birth - Native, outside of US (%) - Other Race
Place of birth - Foreign born (%)
Place of birth - Foreign born (%) - White
Place of birth - Foreign born (%) - Black or African American
Place of birth - Foreign born (%) - Asian
Place of birth - Foreign born (%) - Hispanic or Latino
Place of birth - Foreign born (%) - American Indian and Alaska Native
Place of birth - Foreign born (%) - Multirace
Place of birth - Foreign born (%) - Other Race
Residents speaking English at home (%)
Residents speaking English at home - Born in the United States (%)
Residents speaking English at home - Native, born elsewhere (%)
Residents speaking English at home - Foreign born (%)
Residents speaking Spanish at home (%)
Residents speaking Spanish at home - Born in the United States (%)
Residents speaking Spanish at home - Native, born elsewhere (%)
Residents speaking Spanish at home - Foreign born (%)
Residents speaking other language at home (%)
Residents speaking other language at home - Born in the United States (%)
Residents speaking other language at home - Native, born elsewhere (%)
Residents speaking other language at home - Foreign born (%)
Marital status - Never married (%)
Marital status - Now married (%)
Marital status - Separated (%)
Marital status - Widowed (%)
Marital status - Divorced (%)
Ancestries Reported - Arab (%)
Ancestries Reported - Czech (%)
Ancestries Reported - Danish (%)
Ancestries Reported - Dutch (%)
Ancestries Reported - English (%)
Ancestries Reported - French (%)
Ancestries Reported - French Canadian (%)
Ancestries Reported - German (%)
Ancestries Reported - Greek (%)
Ancestries Reported - Hungarian (%)
Ancestries Reported - Irish (%)
Ancestries Reported - Italian (%)
Ancestries Reported - Lithuanian (%)
Ancestries Reported - Norwegian (%)
Ancestries Reported - Polish (%)
Ancestries Reported - Portuguese (%)
Ancestries Reported - Russian (%)
Ancestries Reported - Scotch-Irish (%)
Ancestries Reported - Scottish (%)
Ancestries Reported - Slovak (%)
Ancestries Reported - Subsaharan African (%)
Ancestries Reported - Swedish (%)
Ancestries Reported - Swiss (%)
Ancestries Reported - Ukrainian (%)
Ancestries Reported - United States (%)
Ancestries Reported - Welsh (%)
Ancestries Reported - West Indian (%)
Ancestries Reported - Other (%)
Geographical mobility - Same house 1 year ago (%)
Geographical mobility - Same house 1 year ago (%) - White
Geographical mobility - Same house 1 year ago (%) - Black or African American
Geographical mobility - Same house 1 year ago (%) - Asian
Geographical mobility - Same house 1 year ago (%) - Hispanic or Latino
Geographical mobility - Same house 1 year ago (%) - American Indian and Alaska Native
Geographical mobility - Same house 1 year ago (%) - Multirace
Geographical mobility - Same house 1 year ago (%) - Other Race
Geographical mobility - Moved within same county (%)
Geographical mobility - Moved within same county (%) - White
Geographical mobility - Moved within same county (%) - Black or African American
Geographical mobility - Moved within same county (%) - Asian
Geographical mobility - Moved within same county (%) - Hispanic or Latino
Geographical mobility - Moved within same county (%) - American Indian and Alaska Native
Geographical mobility - Moved within same county (%) - Multirace
Geographical mobility - Moved within same county (%) - Other Race
Geographical mobility - Moved from different county within same state (%)
Geographical mobility - Moved from different county within same state (%) - White
Geographical mobility - Moved from different county within same state (%) - Black or African American
Geographical mobility - Moved from different county within same state (%) - Asian
Geographical mobility - Moved from different county within same state (%) - Hispanic or Latino
Geographical mobility - Moved from different county within same state (%) - American Indian and Alaska Native
Geographical mobility - Moved from different county within same state (%) - Multirace
Geographical mobility - Moved from different county within same state (%) - Other Race
Geographical mobility - Moved from different state (%)
Geographical mobility - Moved from different state (%) - White
Geographical mobility - Moved from different state (%) - Black or African American
Geographical mobility - Moved from different state (%) - Asian
Geographical mobility - Moved from different state (%) - Hispanic or Latino
Geographical mobility - Moved from different state (%) - American Indian and Alaska Native
Geographical mobility - Moved from different state (%) - Multirace
Geographical mobility - Moved from different state (%) - Other Race
Geographical mobility - Moved from abroad (%)
Geographical mobility - Moved from abroad (%) - White
Geographical mobility - Moved from abroad (%) - Black or African American
Geographical mobility - Moved from abroad (%) - Asian
Geographical mobility - Moved from abroad (%) - Hispanic or Latino
Geographical mobility - Moved from abroad (%) - American Indian and Alaska Native
Geographical mobility - Moved from abroad (%) - Multirace
Geographical mobility - Moved from abroad (%) - Other Race
Place of birth for the foreign-born population - Ireland (%)
Place of birth for the foreign-born population - Denmark (%)
Place of birth for the foreign-born population - Norway (%)
Place of birth for the foreign-born population - Sweden (%)
Place of birth for the foreign-born population - United Kingdom (%)
Place of birth for the foreign-born population - England (%)
Place of birth for the foreign-born population - Scotland (%)
Place of birth for the foreign-born population - Other Northern Europe (%)
Place of birth for the foreign-born population - Austria (%)
Place of birth for the foreign-born population - Belgium (%)
Place of birth for the foreign-born population - France (%)
Place of birth for the foreign-born population - Germany (%)
Place of birth for the foreign-born population - Netherlands (%)
Place of birth for the foreign-born population - Switzerland (%)
Place of birth for the foreign-born population - Other Western Europe (%)
Place of birth for the foreign-born population - Greece (%)
Place of birth for the foreign-born population - Italy (%)
Place of birth for the foreign-born population - Portugal (%)
Place of birth for the foreign-born population - Spain (%)
Place of birth for the foreign-born population - Other Southern Europe (%)
Place of birth for the foreign-born population - Albania (%)
Place of birth for the foreign-born population - Belarus (%)
Place of birth for the foreign-born population - Bosnia and Herzegovina (%)
Place of birth for the foreign-born population - Bulgaria (%)
Place of birth for the foreign-born population - Croatia (%)
Place of birth for the foreign-born population - Czechoslovakia (%)
Place of birth for the foreign-born population - Hungary (%)
Place of birth for the foreign-born population - Latvia (%)
Place of birth for the foreign-born population - Lithuania (%)
Place of birth for the foreign-born population - North Macedonia (Macedonia) (%)
Place of birth for the foreign-born population - Moldova (%)
Place of birth for the foreign-born population - Poland (%)
Place of birth for the foreign-born population - Romania (%)
Place of birth for the foreign-born population - Russia (%)
Place of birth for the foreign-born population - Serbia (%)
Place of birth for the foreign-born population - Ukraine (%)
Place of birth for the foreign-born population - Other Eastern Europe (%)
Place of birth for the foreign-born population - China (%)
Place of birth for the foreign-born population - Hong Kong (%)
Place of birth for the foreign-born population - Taiwan (%)
Place of birth for the foreign-born population - Japan (%)
Place of birth for the foreign-born population - Korea (%)
Place of birth for the foreign-born population - Other Eastern Asia (%)
Place of birth for the foreign-born population - Afghanistan (%)
Place of birth for the foreign-born population - Bangladesh (%)
Place of birth for the foreign-born population - India (%)
Place of birth for the foreign-born population - Iran (%)
Place of birth for the foreign-born population - Kazakhstan (%)
Place of birth for the foreign-born population - Nepal (%)
Place of birth for the foreign-born population - Pakistan (%)
Place of birth for the foreign-born population - Sri Lanka (%)
Place of birth for the foreign-born population - Uzbekistan (%)
Place of birth for the foreign-born population - Other South Central Asia (%)
Place of birth for the foreign-born population - Burma (%)
Place of birth for the foreign-born population - Cambodia (%)
Place of birth for the foreign-born population - Indonesia (%)
Place of birth for the foreign-born population - Laos (%)
Place of birth for the foreign-born population - Malaysia (%)
Place of birth for the foreign-born population - Philippines (%)
Place of birth for the foreign-born population - Singapore (%)
Place of birth for the foreign-born population - Thailand (%)
Place of birth for the foreign-born population - Vietnam (%)
Place of birth for the foreign-born population - Other South Eastern Asia (%)
Place of birth for the foreign-born population - Armenia (%)
Place of birth for the foreign-born population - Iraq (%)
Place of birth for the foreign-born population - Israel (%)
Place of birth for the foreign-born population - Jordan (%)
Place of birth for the foreign-born population - Kuwait (%)
Place of birth for the foreign-born population - Lebanon (%)
Place of birth for the foreign-born population - Saudi Arabia (%)
Place of birth for the foreign-born population - Syria (%)
Place of birth for the foreign-born population - Turkey (%)
Place of birth for the foreign-born population - Yemen (%)
Place of birth for the foreign-born population - Other Western Asia (%)
Place of birth for the foreign-born population - Eritrea (%)
Place of birth for the foreign-born population - Ethiopia (%)
Place of birth for the foreign-born population - Kenya (%)
Place of birth for the foreign-born population - Somalia (%)
Place of birth for the foreign-born population - Uganda (%)
Place of birth for the foreign-born population - Zimbabwe (%)
Place of birth for the foreign-born population - Other Eastern Africa (%)
Place of birth for the foreign-born population - Cameroon (%)
Place of birth for the foreign-born population - Congo (%)
Place of birth for the foreign-born population - Democratic Republic of Congo (Zaire) (%)
Place of birth for the foreign-born population - Other Middle Africa (%)
Place of birth for the foreign-born population - Egypt (%)
Place of birth for the foreign-born population - Morocco (%)
Place of birth for the foreign-born population - Sudan (%)
Place of birth for the foreign-born population - Other Northern Africa (%)
Place of birth for the foreign-born population - South Africa (%)
Place of birth for the foreign-born population - Other Southern Africa (%)
Place of birth for the foreign-born population - Cabo Verde (%)
Place of birth for the foreign-born population - Ghana (%)
Place of birth for the foreign-born population - Liberia (%)
Place of birth for the foreign-born population - Nigeria (%)
Place of birth for the foreign-born population - Senegal (%)
Place of birth for the foreign-born population - Sierra Leone (%)
Place of birth for the foreign-born population - Other Western Africa (%)
Place of birth for the foreign-born population - Australia (%)
Place of birth for the foreign-born population - New Zealand (%)
Place of birth for the foreign-born population - Fiji (%)
Place of birth for the foreign-born population - Micronesia (%)
Place of birth for the foreign-born population - Bahamas (%)
Place of birth for the foreign-born population - Barbados (%)
Place of birth for the foreign-born population - Cuba (%)
Place of birth for the foreign-born population - Dominica (%)
Place of birth for the foreign-born population - Dominican Republic (%)
Place of birth for the foreign-born population - Grenada (%)
Place of birth for the foreign-born population - Haiti (%)
Place of birth for the foreign-born population - Jamaica (%)
Place of birth for the foreign-born population - St. Vincent and the Grenadines (%)
Place of birth for the foreign-born population - Trinidad and Tobago (%)
Place of birth for the foreign-born population - West Indies (%)
Place of birth for the foreign-born population - Other Caribbean (%)
Place of birth for the foreign-born population - Belize (%)
Place of birth for the foreign-born population - Costa Rica (%)
Place of birth for the foreign-born population - El Salvador (%)
Place of birth for the foreign-born population - Guatemala (%)
Place of birth for the foreign-born population - Honduras (%)
Place of birth for the foreign-born population - Mexico (%)
Place of birth for the foreign-born population - Nicaragua (%)
Place of birth for the foreign-born population - Panama (%)
Place of birth for the foreign-born population - Other Central America (%)
Place of birth for the foreign-born population - Argentina (%)
Place of birth for the foreign-born population - Bolivia (%)
Place of birth for the foreign-born population - Brazil (%)
Place of birth for the foreign-born population - Chile (%)
Place of birth for the foreign-born population - Colombia (%)
Place of birth for the foreign-born population - Ecuador (%)
Place of birth for the foreign-born population - Guyana (%)
Place of birth for the foreign-born population - Peru (%)
Place of birth for the foreign-born population - Uruguay (%)
Place of birth for the foreign-born population - Venezuela (%)
Place of birth for the foreign-born population - Other South America (%)
Place of birth for the foreign-born population - Canada (%)
Place of birth for the foreign-born population - Other Northern America (%)
Place of birth for the foreign-born population - Other (%)
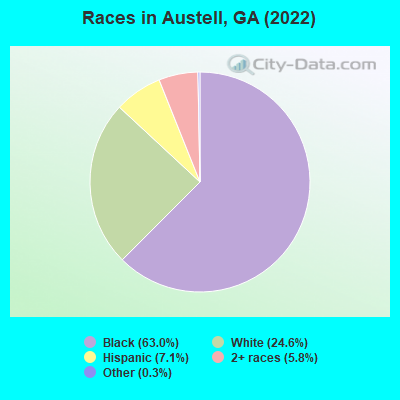
According to 2022 data, the most numerous races in Austell, GA are White alone (2,008 residents), Black alone (5,148 residents), and Hispanic (584 residents). 88.0% of Austell residents speak English at home. 8.3% of Austell, GA residents are foreign-born (3.9% born in Africa, 2.7% born in Latin America, 0.9% born in Asia), which is 20.7% less than the foreign-born rate of 10.0% across the entire state of Georgia.
Race distribution in Austell
2000 2022
5,128,661 62.6% White alone 2,331,465 28.5% Black alone 435,227 5.3% Hispanic 171,513 2.1% Asian alone 87,364 1.1% Two or more races 17,670 0.2% American Indian alone 11,275 0.1% Other race alone 3,278 0.04% Native Hawaiian and Other
5,415,657 49.6% White alone 3,349,240 30.7% Black alone 1,132,604 10.4% Hispanic 479,156 4.4% Asian alone 462,923 4.2% Two or more races 54,416 0.5% Other race alone 11,923 0.1% American Indian alone 6,957 0.06% Native Hawaiian and Other
Income and house value in Austell Median household income in 2022 $66,557 White non-Hispanic householders$53,232 Black householders$100,186 Some other race householders$83,004 Two or more races householders$113,847 Hispanic or Latino race householdersMedian 2022 house value $223,363 White Non-Hispanic householders$318,885 Black or African American householders$324,656 Some other race householders$324,656 Hispanic or Latino householders
Median age by race in Austell
43.0 Median age for White residents36.8 45.8 33.7 Median age for Black or African American residents28.8 35.1 -621,333,332.7 Median age for American Indian / Alaska Native residents-622,065,727.1 -675,716,439.7 -690,541,780.8 Median age for Asian residents-701,851,851.1 -681,278,538.1 -657,243,815.6 Median age for Native Hawaiian / Pacific Islander residents-693,227,090.9 -776,776,776.0 36.2 Median age for Other race residents47.4 14.5 18.3 Median age for Two or more races residents18.7 26.2 42.8 Median age for White alone residents36.7 46.8 25.0 Median age for Hispanic or Latino residents24.7 25.1
Owner/renter occupied households by race in Austell
House owners and renters - White residents 617 74.6% Owner occupied210 25.4% Renter occupiedHouse owners and renters - Black or African American residents 970 50.9% Owner occupied937 49.1% Renter occupiedHouse owners and renters - Other race residents 69 100.0% Owner occupiedHouse owners and renters - Two or more races residents 108 81.4% Owner occupied25 18.6% Renter occupiedHouse owners and renters - White alone residents 628 80.4% Owner occupied153 19.6% Renter occupiedHouse owners and renters - Hispanic or Latino residents 68 52.1% Owner occupied62 47.9% Renter occupied
Language usage in Austell
English speakers - Total 88.0% of residents of Austell speak English at home.
7.1% of residents speak Spanish at home 281 50.3% Speak English very well278 49.7% Speak English less than very well4.3% of residents speak other language at home 322 96.1% Speak English very well13 3.9% Speak English less than very well
English speakers - Born in the United States 93.4% of residents of Austell speak English at home.
4.8% of residents speak Spanish at home 141 100.0% Speak English very well1.3% of residents speak other language at home 38 100.0% Speak English very well
English speakers - Native, born elsewhere 13.5% of residents of Austell speak English at home.
83.3% of residents speak Spanish at home 44 55.0% Speak English very well36 45.0% Speak English less than very well7.3% of residents speak other language at home 7 100.0% Speak English less than very well
English speakers - Foreign-born 39.8% of residents of Austell speak English at home.
23.8% of residents speak Spanish at home 13 7.9% Speak English very well152 92.1% Speak English less than very well38.1% of residents speak other language at home 264 100.0% Speak English very well
White (Caucasian) - Speak another language Native:
7.3% (148)Foreign-born:
90.4% (135)
Black or African American - Speak only English Native:
99.8% (4,276)Foreign-born:
57.6% (274)
Black or African American - Speak another language Native:
0.5% (20)Foreign-born:
36.7% (175)
Other race - Speak only English Native:
23.4% (44)Foreign-born:
4.6% (3)
Other race - Speak another language Native:
76.0% (144)Foreign-born:
95.0% (63)
White alone - Speak another language Native:
3.0% (57)Foreign-born:
93.5% (91)
Hispanic or Latino - Speak only English Native:
7.9% (33)Foreign-born:
2.4% (4)
Hispanic or Latino - Speak another language Native:
92.0% (384)Foreign-born:
97.6% (170)
Foreign-born residents in Austell 677 residents are foreign born (3.9% Africa , 2.7% Latin America , 0.9% Asia ).
This city:
8.3%Georgia:
10.4%
Marital status for residents in Austell Marital status - White (Caucasian) population 15 years and over
Males 33.0% Never married47.0% Now married1.5% Separated2.4% Widowed16.0% DivorcedFemales 23.3% Never married56.2% Now married1.9% Separated9.3% Widowed9.2% DivorcedWomen who did not give birth in the past 12 months Now married:
55.4% (263)Unmarried:
44.6% (211)
Marital status - Black or African American population 15 years and over
Males 40.8% Never married48.3% Now married2.7% Separated0.0% Widowed8.2% DivorcedFemales 58.1% Never married27.9% Now married4.0% Separated3.5% Widowed6.4% DivorcedWomen who gave birth in the past 12 months Now married:
0.0% (0)Unmarried:
100.0% (20)
Women who did not give birth in the past 12 months Now married:
27.0% (578)Unmarried:
73.0% (1,567)
Marital status - Other race population 15 years and over
Males 43.7% Never married5.6% Now married16.9% Separated0.0% Widowed33.8% DivorcedFemales 64.0% Never married0.0% Now married0.0% Separated8.0% Widowed28.0% DivorcedWomen who did not give birth in the past 12 months Now married:
0.0% (0)Unmarried:
100.0% (49)
Marital status - Two or more races population 15 years and over
Males 69.3% Never married30.7% Now married0.0% Separated0.0% Widowed0.0% DivorcedFemales 31.8% Never married68.2% Now married0.0% Separated0.0% Widowed0.0% DivorcedWomen who did not give birth in the past 12 months Now married:
58.5% (55)Unmarried:
41.5% (39)
Marital status - White alone, not Hispanic / Latino population 15 years and over
Males 31.8% Never married44.6% Now married1.8% Separated2.9% Widowed19.0% DivorcedFemales 26.4% Never married51.0% Now married2.1% Separated10.6% Widowed9.9% DivorcedWomen who did not give birth in the past 12 months Now married:
43.5% (171)Unmarried:
56.5% (222)
Marital status - Hispanic or Latino population 15 years and over
Males 54.7% Never married32.2% Now married7.0% Separated0.0% Widowed6.1% DivorcedFemales 19.8% Never married66.0% Now married0.0% Separated2.5% Widowed11.7% DivorcedWomen who did not give birth in the past 12 months Now married:
68.2% (111)Unmarried:
31.8% (52)
Ancestries in Austell
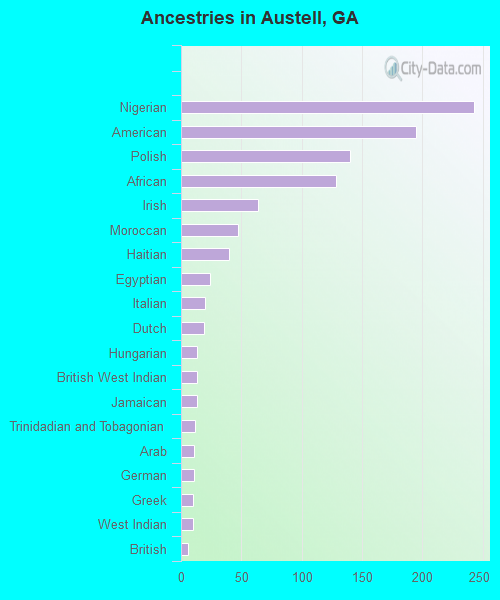
243 5.5% Nigerian195 4.4% American140 3.2% Polish128 2.9% African64 1.4% Irish47 1.1% Moroccan40 0.9% Haitian24 0.5% Egyptian20 0.5% Italian19 0.4% Dutch13 0.3% Hungarian13 0.3% British West Indian13 0.3% Jamaican12 0.3% Trinidadian and Tobagonian11 0.2% Arab11 0.2% German10 0.2% Greek10 0.2% West Indian6 0.1% British
Children Nativity (place of birth) in Austell
Children under 6 years - Living with two parents Both parents native 187 100.0% NativeOne native, one foreign-born parent 17 100.0% NativeChildren under 6 years - Living with one parent Native parent 298 100.0% NativeChildren 6 to 17 years - Living with two parents Both parents native 317 100.0% NativeBoth parents foreign-born 42 100.0% NativeOne native, one foreign-born parent 170 100.0% NativeChildren 6 to 17 years - Living with one parent Native parent 775 100.0% NativeForeign-born parent 116 61.1% Native74 38.9% Foreign-born
Grandparents responsible for own grandchildren in Austell
Grandparents (30 to 59 years) White / Caucasian 35 20.0% Responsible for grandchildren141 80.0% Not responsible for grandchildrenBlack or African American 181 100.0% Not responsible for grandchildrenTwo or more races 27 100.0% Not responsible for grandchildrenWhite alone, not Hispanic / Latino 24 12.5% Responsible for grandchildren166 87.5% Not responsible for grandchildren
Grandparents (60 years and over)