Races in Austin, Nevada (NV) Detailed Stats
Ancestries, Foreign-born residents, place of birth

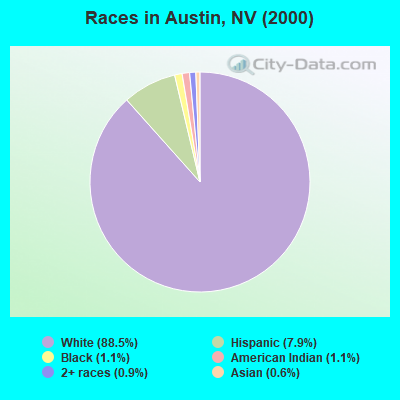
Data:
Race distribution in Austin

- 41488.5%White alone
- 377.9%Hispanic
- 51.1%Black alone
- 51.1%American Indian alone
- 40.9%Two or more races
- 30.6%Asian alone
2000
2022
-
- 1,303,00165.2%White alone
- 393,97019.7%Hispanic
- 131,5096.6%Black alone
- 88,5934.4%Asian alone
- 49,2312.5%Two or more races
- 21,3971.1%American Indian alone
- 7,7690.4%Native Hawaiian and Other
Pacific Islander alone
- 2,7870.1%Other race alone
-
- 1,410,14544.4%White alone
- 961,35730.3%Hispanic
- 286,4719.0%Black alone
- 281,1498.8%Asian alone
- 182,1515.7%Two or more races
- 20,1020.6%Native Hawaiian and Other
Pacific Islander alone
- 18,7810.6%Other race alone
- 17,6160.6%American Indian alone
Income and house value in Austin
- Median household income in 2022
- $61,856White non-Hispanic householders
- $52,284Some other race householders
- $63,917Hispanic or Latino race householders
- Median 2022 house value
- $269,681White Non-Hispanic householders