Races in Avon Lake, Ohio (OH) Detailed Stats
Ancestries, Foreign-born residents, place of birth
Settings
X


Recent posts about races in Avon Lake, Ohio on our local forum with over 2,400,000 registered users:

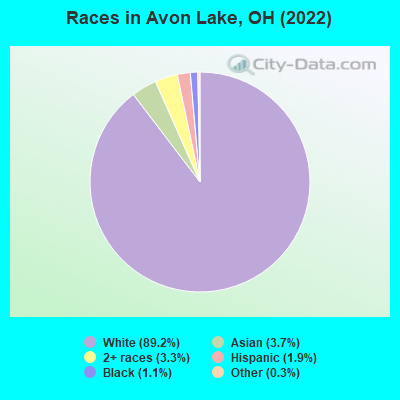
According to 2022 data, the most numerous races in Avon Lake, OH are White alone (22,736 residents), Black alone (291 residents), and Two or more races (850 residents). 92.9% of Avon Lake residents speak English at home. 4.0% of Avon Lake, OH residents are foreign-born (2.5% born in Asia, 0.7% born in Europe), which is about the same as the foreign-born rate of 4.0% across the entire state of Ohio.
Race distribution in Avon Lake
2000
2022

- 17,48496.4%White alone
- 2261.2%Hispanic
- 1741.0%Asian alone
- 1320.7%Two or more races
- 820.5%Black alone
- 280.2%American Indian alone
- 140.08%Other race alone
- 50.03%Native Hawaiian and Other
Pacific Islander alone

-
- 22,73689.2%White alone
- 9343.7%Asian alone
- 8503.3%Two or more races
- 4811.9%Hispanic
- 2911.1%Black alone
- 830.3%Other race alone
- 40.02%American Indian alone
2000
2022
-
- 9,538,11184.0%White alone
- 1,290,66211.4%Black alone
- 217,1231.9%Hispanic
- 137,7701.2%Two or more races
- 131,6701.2%Asian alone
- 21,9850.2%American Indian alone
- 13,4830.1%Other race alone
- 2,3360.02%Native Hawaiian and Other
Pacific Islander alone

-
- 8,948,79376.1%White alone
- 1,401,40311.9%Black alone
- 529,2914.5%Two or more races
- 517,2324.4%Hispanic
- 293,3872.5%Asian alone
- 52,8050.4%Other race alone
- 9,7850.08%American Indian alone
- 3,3620.03%Native Hawaiian and Other
Pacific Islander alone

Income and house value in Avon Lake
- Median household income in 2022
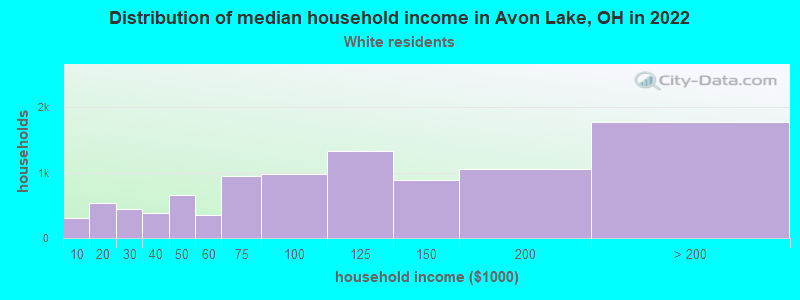
- $102,912White non-Hispanic householders
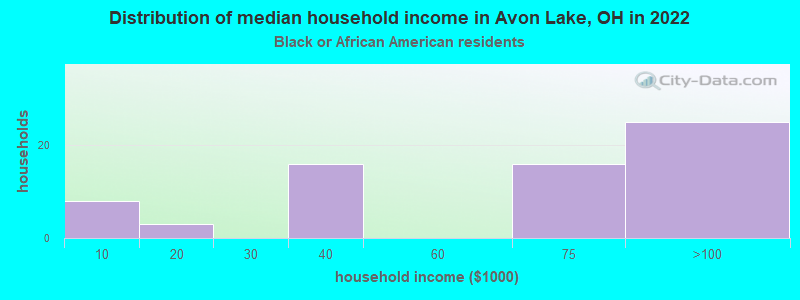
- $65,660Black householders
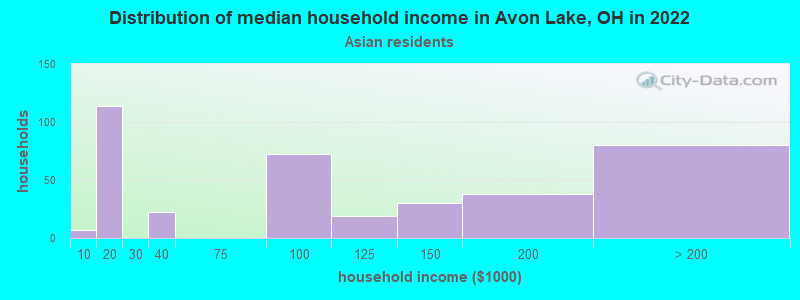
- $143,954Asian householders
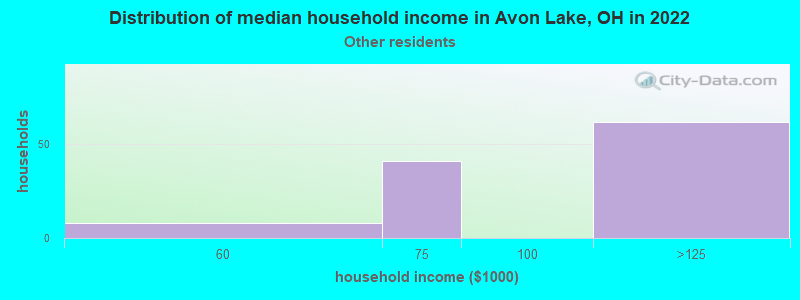
- $59,432Some other race householders
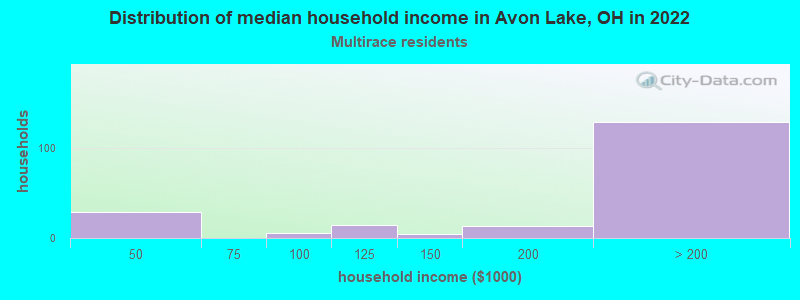
- over $200,000Two or more races householders
- Median 2022 house value
- $351,638White Non-Hispanic householders
- $126,969Black or African American householders
- $436,679Asian householders
- $370,821Some other race householders
- $426,395Two or more races householders
- $333,838Hispanic or Latino householders
Household income for White non-Hispanic householders
Household income for Black householders
Household income for Asian householders
Household income for Some other race householders
Household income for Two or more races householders
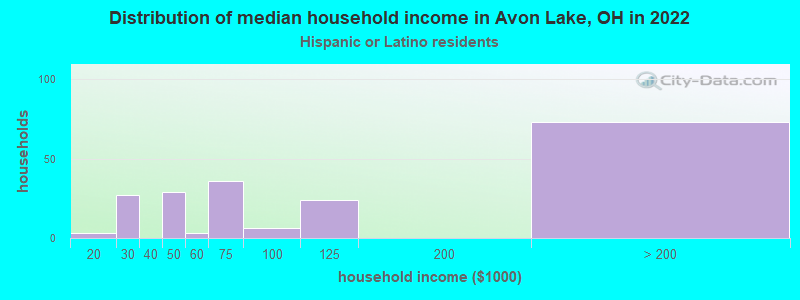
Household income for Hispanic or Latino race householders
Median age by race in Avon Lake
- 47.9Median age for White residents
- 47.2Males
- 49.0Females
- 27.8Median age for Black or African American residents
- 18.7Males
- 39.3Females
- -730,225,988.0Median age for American Indian / Alaska Native residents
- -735,686,273.8Males
- -708,672,086.0Females
- 48.8Median age for Asian residents
- 45.1Males
- 46.9Females
- -666,666,666.0Median age for Native Hawaiian / Pacific Islander residents
- -666,666,666.0Males
- -666,666,666.0Females
- 47.1Median age for Other race residents
- 46.5Males
- 47.5Females
- 16.8Median age for Two or more races residents
- 14.3Males
- 29.2Females
- 47.2Median age for White alone residents
- 46.7Males
- 48.3Females
- 40.8Median age for Hispanic or Latino residents
- 39.9Males
- 44.0Females
Owner/renter occupied households by race in Avon Lake
- House owners and renters - White residents
- 8,32785.7%Owner occupied
- 1,38914.3%Renter occupied
- House owners and renters - Black or African American residents
- 2533.7%Owner occupied
- 4866.3%Renter occupied
- House owners and renters - Asian residents
- 23460.7%Owner occupied
- 15239.3%Renter occupied
- House owners and renters - Other race residents
- 49100.0%Owner occupied
- House owners and renters - Two or more races residents
- 19285.8%Owner occupied
- 3214.2%Renter occupied
- House owners and renters - White alone residents
- 8,40785.2%Owner occupied
- 1,45914.8%Renter occupied
- House owners and renters - Hispanic or Latino residents
- 15385.2%Owner occupied
- 2714.8%Renter occupied
Language usage in Avon Lake
- English speakers - Total
- 92.9% of residents of Avon Lake speak English at home.
- 1.5% of residents speak Spanish at home
- 26971.5%Speak English very well
- 10728.5%Speak English less than very well
- 5.0% of residents speak other language at home
- 1,07488.0%Speak English very well
- 14612.0%Speak English less than very well
- English speakers - Born in the United States
- 94.0% of residents of Avon Lake speak English at home.
- 3.1% of residents speak Spanish at home
- 16599.4%Speak English very well
- 10.6%Speak English less than very well
- 2.0% of residents speak other language at home
- 105100.0%Speak English very well
- English speakers - Native, born elsewhere
- 96.3% of residents of Avon Lake speak English at home.
- English speakers - Foreign-born
- 7.0% of residents of Avon Lake speak English at home.
- 6.4% of residents speak Spanish at home
- 58100.0%Speak English less than very well
- 84.8% of residents speak other language at home
- 64683.9%Speak English very well
- 12416.1%Speak English less than very well
White (Caucasian) - Speak only English
| Native: | 99.0% (20,901) |
| Foreign-born: | 45.6% (108) |
White (Caucasian) - Speak another language
| Native: | 1.3% (273) |
| Foreign-born: | 99.2% (235) |
Asian - Speak only English
| Native: | 47.7% (170) |
| Foreign-born: | 5.3% (30) |
Asian - Speak another language
| Native: | 51.6% (185) |
| Foreign-born: | 96.4% (540) |
Other race - Speak another language
| Native: | 41.2% (62) |
| Foreign-born: | 100.0% (51) |
White alone - Speak only English
| Native: | 98.6% (21,147) |
| Foreign-born: | 44.4% (111) |
White alone - Speak another language
| Native: | 1.2% (258) |
| Foreign-born: | 100.0% (250) |
Hispanic or Latino - Speak another language
| Native: | 45.4% (177) |
| Foreign-born: | 100.0% (99) |
Foreign-born residents in Avon Lake
1,007 residents are foreign born (2.5% Asia, 0.7% Europe).
| This city: | 4.0% |
| Ohio: | 4.9% |


Marital status for residents in Avon Lake
Marital status - White (Caucasian) population 15 years and over
- Males
- 23.7%Never married
- 64.6%Now married
- 0.7%Separated
- 3.1%Widowed
- 7.9%Divorced
- Females
- 18.9%Never married
- 56.4%Now married
- 0.3%Separated
- 8.2%Widowed
- 16.2%Divorced
Women who gave birth in the past 12 months
| Now married: | 49.3% (211) |
| Unmarried: | 50.7% (217) |
Women who did not give birth in the past 12 months
| Now married: | 53.0% (2,114) |
| Unmarried: | 47.0% (1,873) |
Marital status - Black or African American population 15 years and over
- Males
- 81.7%Never married
- 7.7%Now married
- 0.0%Separated
- 10.6%Widowed
- 0.0%Divorced
- Females
- 67.8%Never married
- 10.5%Now married
- 0.0%Separated
- 12.9%Widowed
- 8.8%Divorced
Women who did not give birth in the past 12 months
| Now married: | 9.9% (8) |
| Unmarried: | 90.1% (76) |
Marital status - Asian population 15 years and over
- Males
- 8.0%Never married
- 89.8%Now married
- 0.0%Separated
- 0.0%Widowed
- 2.2%Divorced
- Females
- 2.7%Never married
- 97.3%Now married
- 0.0%Separated
- 0.0%Widowed
- 0.0%Divorced
Women who gave birth in the past 12 months
| Now married: | 0.0% (0) |
| Unmarried: | 100.0% (9) |
Women who did not give birth in the past 12 months
| Now married: | 100.0% (185) |
| Unmarried: | 0.0% (0) |
Marital status - Other race population 15 years and over
- Males
- 0.0%Never married
- 100.0%Now married
- 0.0%Separated
- 0.0%Widowed
- 0.0%Divorced
- Females
- 0.0%Never married
- 83.8%Now married
- 0.0%Separated
- 0.0%Widowed
- 16.2%Divorced
Women who did not give birth in the past 12 months
| Now married: | 80.7% (61) |
| Unmarried: | 19.3% (15) |
Marital status - Two or more races population 15 years and over
- Males
- 30.2%Never married
- 49.7%Now married
- 0.0%Separated
- 0.0%Widowed
- 20.1%Divorced
- Females
- 29.0%Never married
- 69.6%Now married
- 0.0%Separated
- 0.0%Widowed
- 1.4%Divorced
Women who did not give birth in the past 12 months
| Now married: | 66.4% (294) |
| Unmarried: | 33.6% (149) |
Marital status - White alone, not Hispanic / Latino population 15 years and over
- Males
- 23.6%Never married
- 64.7%Now married
- 0.7%Separated
- 3.1%Widowed
- 7.9%Divorced
- Females
- 18.8%Never married
- 56.5%Now married
- 0.3%Separated
- 8.2%Widowed
- 16.2%Divorced
Women who gave birth in the past 12 months
| Now married: | 50.6% (220) |
| Unmarried: | 49.4% (215) |
Women who did not give birth in the past 12 months
| Now married: | 53.1% (2,191) |
| Unmarried: | 46.9% (1,937) |
Marital status - Hispanic or Latino population 15 years and over
- Males
- 13.6%Never married
- 86.4%Now married
- 0.0%Separated
- 0.0%Widowed
- 0.0%Divorced
- Females
- 22.9%Never married
- 65.7%Now married
- 0.0%Separated
- 0.0%Widowed
- 11.4%Divorced
Women who gave birth in the past 12 months
| Now married: | 0.0% (0) |
| Unmarried: | 100.0% (11) |
Women who did not give birth in the past 12 months
| Now married: | 70.0% (115) |
| Unmarried: | 30.0% (49) |
Ancestries in Avon Lake

- 2,38322.4%German
- 1,23811.6%Irish
- 1,13810.7%English
- 7326.9%American
- 6866.4%Polish
- 5295.0%Italian
- 5124.8%Eastern European
- 2932.8%Hungarian
- 2252.1%European
- 2082.0%Scottish
- 1581.5%Slovene
- 1041.0%Slovak
- 820.8%Ukrainian
- 780.7%Norwegian
- 650.6%Northern European
- 630.6%Greek
- 630.6%Arab
- 560.5%Swedish
- 400.4%French
- 390.4%British
- 370.3%Egyptian
- 330.3%Welsh
- 280.3%French Canadian
- 260.2%Finnish
- 260.2%Scotch-Irish
- 240.2%Iranian
- 210.2%Czechoslovakian
- 200.2%Russian
- 180.2%Croatian
- 170.2%Turkish
- 140.1%Palestinian
- 140.1%Austrian
- 130.1%Swiss
- 120.1%Czech
- 90.08%Dutch
- 90.08%Danish
- 40.04%Syrian
- 30.03%Estonian

Geographical mobility in Avon Lake

- Same house 1 year ago
- 20,99994.4%White (Caucasian)
- 20168.1%Black or African American
- 5100.0%American Indian / Alaska Native
- 836100.0%Asian
- 26198.6%Other race
- 1,20999.9%Two or more races
- 21,46794.8%White alone, not Hispanic / Latino
- 41386.9%Hispanic or Latino

-
- Moved within same county
- 3281.5%White / Caucasian
- 60.5%Two or more races
- 3301.5%White alone, not Hispanic / Latino
- 5712.0%Hispanic or Latino

-
- Moved within same state
- 7303.3%White / Caucasian
- 10836.5%Black or African American
- 20.3%Asian
- 6322.8%White alone, not Hispanic / Latino

-
- Moved from different state
- 4011.8%White / Caucasian
- 124.2%Black or African American
- 4201.9%White alone, not Hispanic / Latino

-
- Moved from abroad
- 370.2%White
- 370.2%White alone, not Hispanic / Latino

Children Nativity (place of birth) in Avon Lake
Place of birth for residents in Avon Lake
![Place of birth for the foreign-born population - Regions]()
- 642Asia
- 264South Central Asia
- 212Eastern Asia
- 192China
- 185Europe
- 127Americas
- 100Western Asia
- 74Western Europe
- 74Latin America
- 74South America
- 68Eastern Europe
- 65South Eastern Asia
- 53Northern America
- 34Northern Europe
- 32Africa
- 32Northern Africa
- 18Oceania
- 18Australia and New Zealand Subregion
- 7Southern Europe

![Place of birth for the foreign-born population - Countries]()
- 264India
- 192China
- 74Venezuela
- 53Canada
- 49Philippines
- 47Germany
- 37Romania
- 33Lebanon
- 32Syria
- 32Egypt
- 20Korea
- 19Ukraine
- 18Australia
- 16Denmark
- 16France
- 16Vietnam
- 13Turkey
- 12Ireland
- 11Netherlands
- 11Hungary
- 7Italy
- 6United Kingdom

Zip codes: 44012.