Races in Back Mountain, Pennsylvania (PA) Detailed Stats
Ancestries, Foreign-born residents, place of birth

Recent posts about races in Back Mountain, Pennsylvania on our local forum with over 2,400,000 registered users:
 | Kirby Park walking track... open, public? (7 replies) |
| Jewish population in Wilkes Barre/Dallas area (16 replies) |
| What would improve Wilkes-Barre and the greater Wyoming Valley? (115 replies) |
| Visiting WilkesBarre from Seattle... help? (33 replies) |
| What is a NEPA? (38 replies) |
| Where to Live as a Young Professional (45 replies) |
1.7% of Back Mountain, PA residents are foreign-born , which is 307.0% less than the foreign-born rate of 7.0% across the entire state of Pennsylvania.
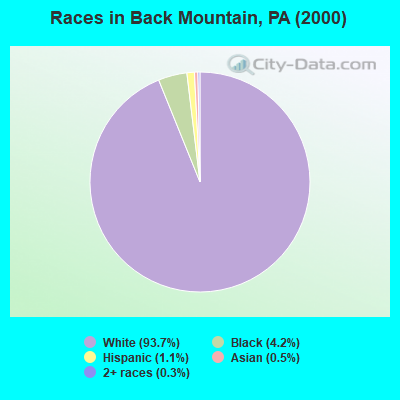
Race distribution in Back Mountain

- 25,01293.7%White alone
- 1,1334.2%Black alone
- 2811.1%Hispanic
- 1360.5%Asian alone
- 890.3%Two or more races
- 240.09%American Indian alone
- 110.04%Other race alone
- 40.01%Native Hawaiian and Other
Pacific Islander alone
2000
2022
-
- 10,322,45584.1%White alone
- 1,202,4379.8%Black alone
- 394,0883.2%Hispanic
- 218,2961.8%Asian alone
- 113,0970.9%Two or more races
- 13,0860.1%Other race alone
- 14,9040.1%American Indian alone
- 2,6910.02%Native Hawaiian and Other
Pacific Islander alone

-
- 9,487,22873.1%White alone
- 1,311,58110.1%Black alone
- 1,115,9978.6%Hispanic
- 493,9423.8%Two or more races
- 487,1243.8%Asian alone
- 63,5820.5%Other race alone
- 10,1300.08%American Indian alone
- 2,4240.02%Native Hawaiian and Other
Pacific Islander alone

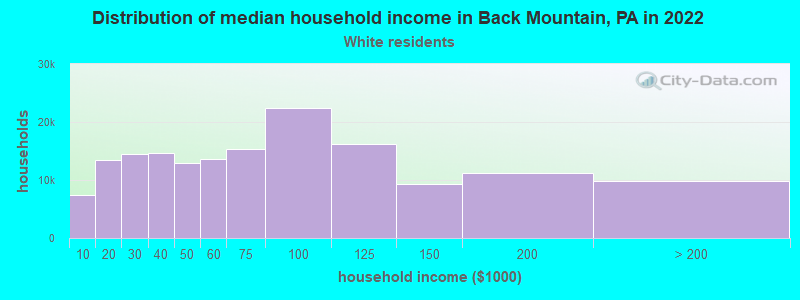
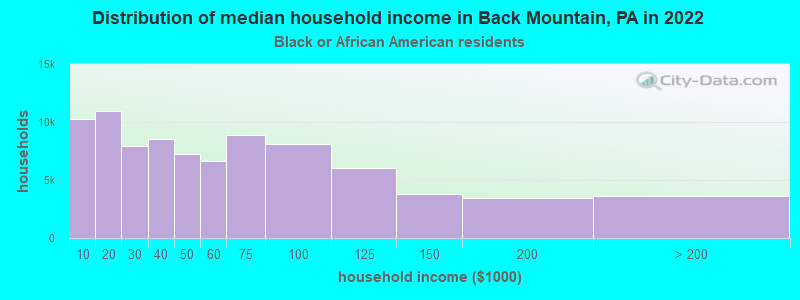
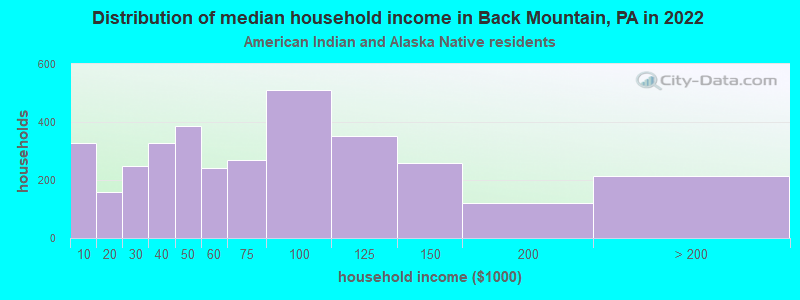
Income and house value in Back Mountain
- Median household income in 2022
- $91,975White non-Hispanic householders
- $18,039Black householders
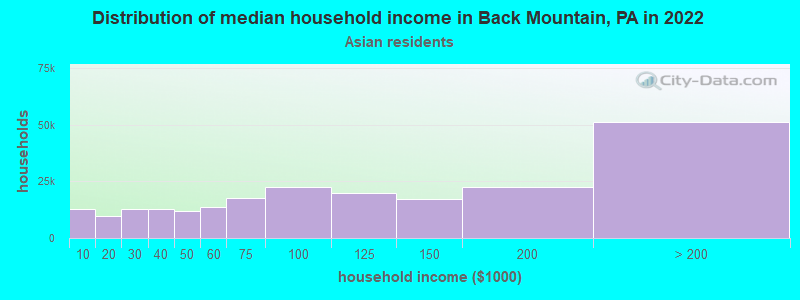
- $153,895Asian householders
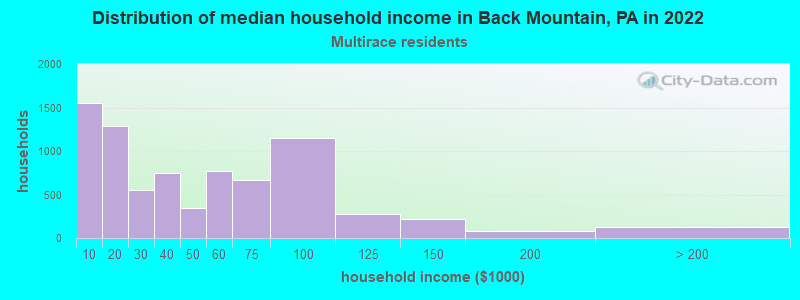
- $28,241Two or more races householders
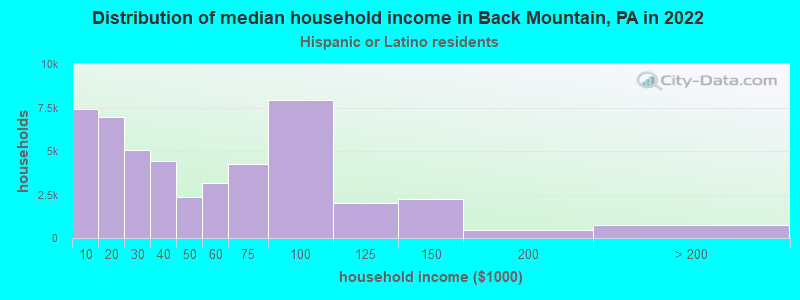
- $103,576Hispanic or Latino race householders
- Median 2022 house value
- $246,986White Non-Hispanic householders
- $111,712Black or African American householders
- $111,712American Indian or Alaska Native householders
- $372,307Asian householders
- $292,077Two or more races householders
- $310,357Hispanic or Latino householders
Household income for White non-Hispanic householders
Household income for Black householders
Household income for American Indian and Alaska Native householders
Household income for Asian householders
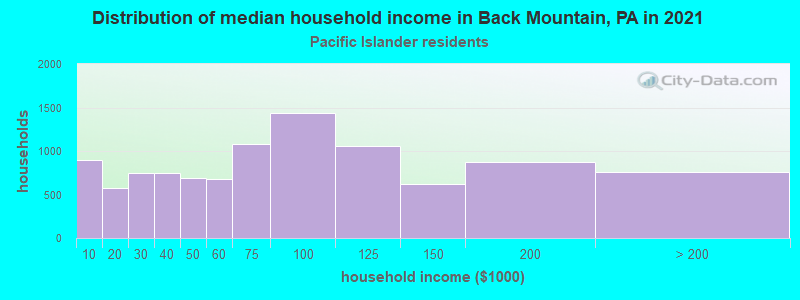
Household income for Native Hawaiian and other Pacific Islander householders
Household income for Two or more races householders
Household income for Hispanic or Latino race householders
Foreign-born residents in Back Mountain
459 residents are foreign born
| This city: | 1.7% |
| Pennsylvania: | 4.1% |
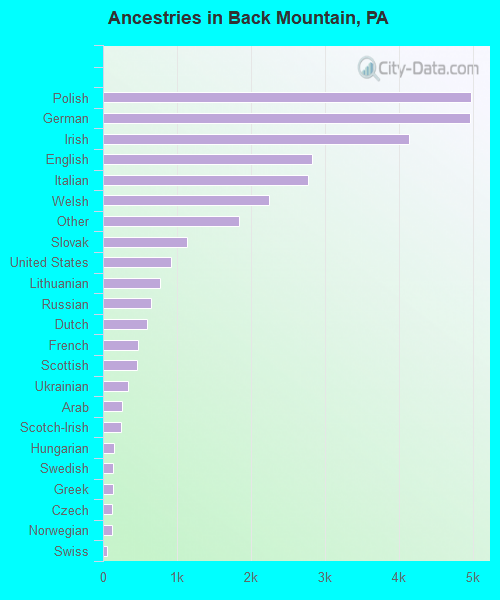
Ancestries in Back Mountain

- 4,97016.3%Polish
- 4,96116.3%German
- 4,14113.6%Irish
- 2,8299.3%English
- 2,7749.1%Italian
- 2,2477.4%Welsh
- 1,8376.0%Other
- 1,1353.7%Slovak
- 9223.0%United States
- 7752.5%Lithuanian
- 6472.1%Russian
- 5891.9%Dutch
- 4701.5%French
- 4561.5%Scottish
- 3441.1%Ukrainian
- 2620.9%Arab
- 2420.8%Scotch-Irish
- 1550.5%Hungarian
- 1350.4%Swedish
- 1300.4%Greek
- 1210.4%Czech
- 1150.4%Norwegian
- 520.2%Swiss
- 360.1%French Canadian
- 230.08%Danish
- 200.07%Portuguese
- 130.04%Subsaharan African
Zip codes: 18612.