Races in Bainbridge Island, Washington (WA) Detailed Stats
Data:
Races - White alone (%)
Races - White alone (% change since 2000)
Races - Black alone (%)
Races - Black alone (% change since 2000)
Races - American Indian alone (%)
Races - American Indian alone (% change since 2000)
Races - Asian alone (%)
Races - Asian alone (% change since 2000)
Races - Hispanic (%)
Races - Hispanic (% change since 2000)
Races - Native Hawaiian and Other Pacific Islander alone (%)
Races - Native Hawaiian and Other Pacific Islander alone (% change since 2000)
Races - Two or more races(%)
Races - Two or more races(% change since 2000)
Races - Other race alone (%)
Races - Other race alone (% change since 2000)
Racial diversity
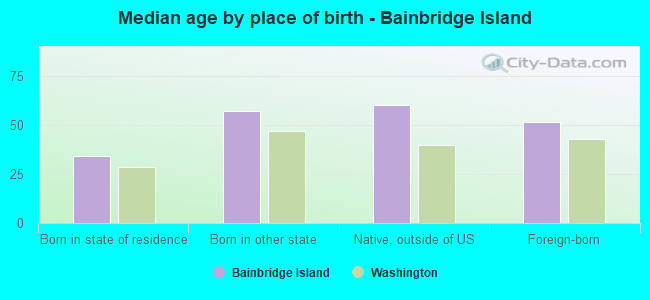
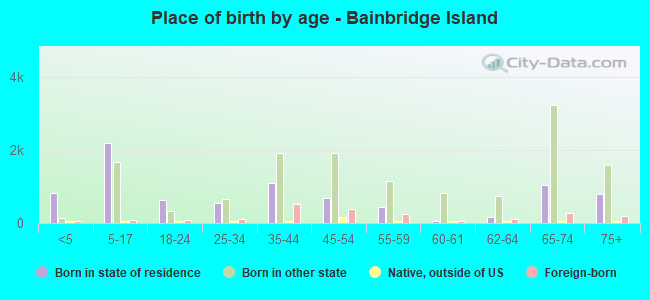
Place of birth - Born in state of residence (%)
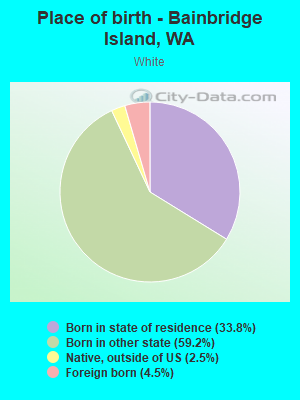
Place of birth - Born in state of residence (%) - White
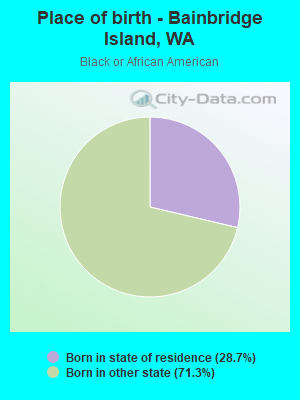
Place of birth - Born in state of residence (%) - Black or African American
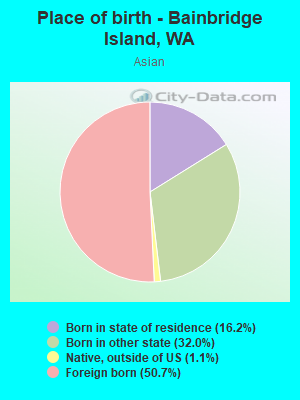
Place of birth - Born in state of residence (%) - Asian
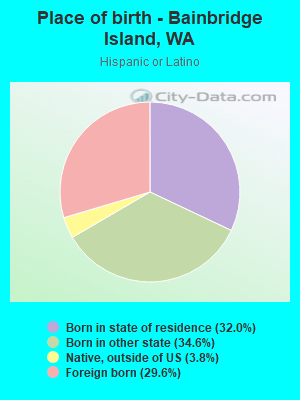
Place of birth - Born in state of residence (%) - Hispanic or Latino
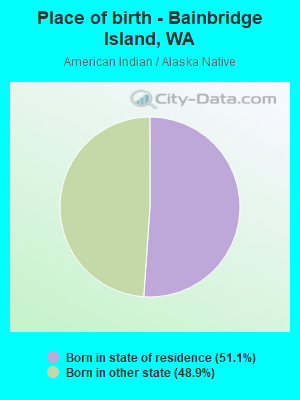
Place of birth - Born in state of residence (%) - American Indian and Alaska Native
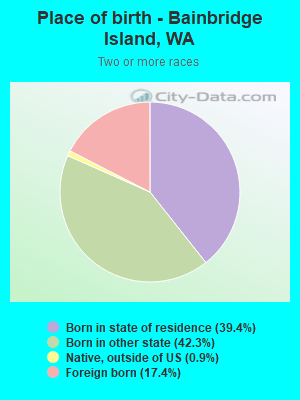
Place of birth - Born in state of residence (%) - Multirace
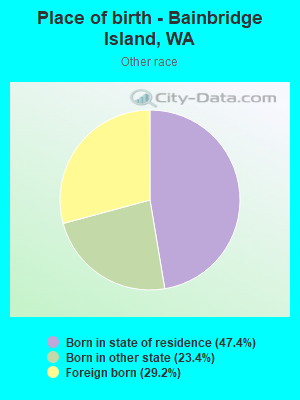
Place of birth - Born in state of residence (%) - Other Race
Place of birth - Born in other state (%)
Place of birth - Born in other state (%) - White
Place of birth - Born in other state (%) - Black or African American
Place of birth - Born in other state (%) - Asian
Place of birth - Born in other state (%) - Hispanic or Latino
Place of birth - Born in other state (%) - American Indian and Alaska Native
Place of birth - Born in other state (%) - Multirace
Place of birth - Born in other state (%) - Other Race
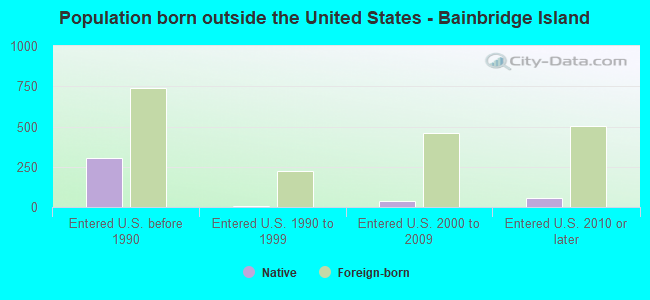
Place of birth - Native, outside of US (%)
Place of birth - Native, outside of US (%) - White
Place of birth - Native, outside of US (%) - Black or African American
Place of birth - Native, outside of US (%) - Asian
Place of birth - Native, outside of US (%) - Hispanic or Latino
Place of birth - Native, outside of US (%) - American Indian and Alaska Native
Place of birth - Native, outside of US (%) - Multirace
Place of birth - Native, outside of US (%) - Other Race
Place of birth - Foreign born (%)
Place of birth - Foreign born (%) - White
Place of birth - Foreign born (%) - Black or African American
Place of birth - Foreign born (%) - Asian
Place of birth - Foreign born (%) - Hispanic or Latino
Place of birth - Foreign born (%) - American Indian and Alaska Native
Place of birth - Foreign born (%) - Multirace
Place of birth - Foreign born (%) - Other Race
Residents speaking English at home (%)
Residents speaking English at home - Born in the United States (%)
Residents speaking English at home - Native, born elsewhere (%)
Residents speaking English at home - Foreign born (%)
Residents speaking Spanish at home (%)
Residents speaking Spanish at home - Born in the United States (%)
Residents speaking Spanish at home - Native, born elsewhere (%)
Residents speaking Spanish at home - Foreign born (%)
Residents speaking other language at home (%)
Residents speaking other language at home - Born in the United States (%)
Residents speaking other language at home - Native, born elsewhere (%)
Residents speaking other language at home - Foreign born (%)
Marital status - Never married (%)
Marital status - Now married (%)
Marital status - Separated (%)
Marital status - Widowed (%)
Marital status - Divorced (%)
Ancestries Reported - Arab (%)
Ancestries Reported - Czech (%)
Ancestries Reported - Danish (%)
Ancestries Reported - Dutch (%)
Ancestries Reported - English (%)
Ancestries Reported - French (%)
Ancestries Reported - French Canadian (%)
Ancestries Reported - German (%)
Ancestries Reported - Greek (%)
Ancestries Reported - Hungarian (%)
Ancestries Reported - Irish (%)
Ancestries Reported - Italian (%)
Ancestries Reported - Lithuanian (%)
Ancestries Reported - Norwegian (%)
Ancestries Reported - Polish (%)
Ancestries Reported - Portuguese (%)
Ancestries Reported - Russian (%)
Ancestries Reported - Scotch-Irish (%)
Ancestries Reported - Scottish (%)
Ancestries Reported - Slovak (%)
Ancestries Reported - Subsaharan African (%)
Ancestries Reported - Swedish (%)
Ancestries Reported - Swiss (%)
Ancestries Reported - Ukrainian (%)
Ancestries Reported - United States (%)
Ancestries Reported - Welsh (%)
Ancestries Reported - West Indian (%)
Ancestries Reported - Other (%)
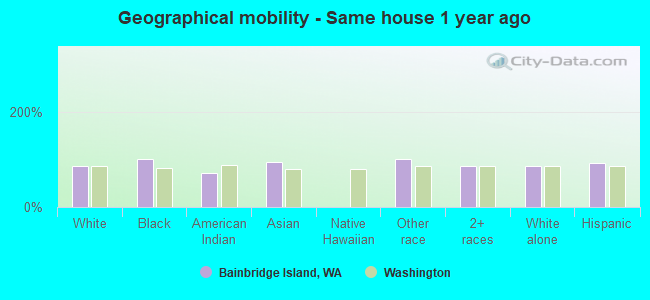
Geographical mobility - Same house 1 year ago (%)
Geographical mobility - Same house 1 year ago (%) - White
Geographical mobility - Same house 1 year ago (%) - Black or African American
Geographical mobility - Same house 1 year ago (%) - Asian
Geographical mobility - Same house 1 year ago (%) - Hispanic or Latino
Geographical mobility - Same house 1 year ago (%) - American Indian and Alaska Native
Geographical mobility - Same house 1 year ago (%) - Multirace
Geographical mobility - Same house 1 year ago (%) - Other Race
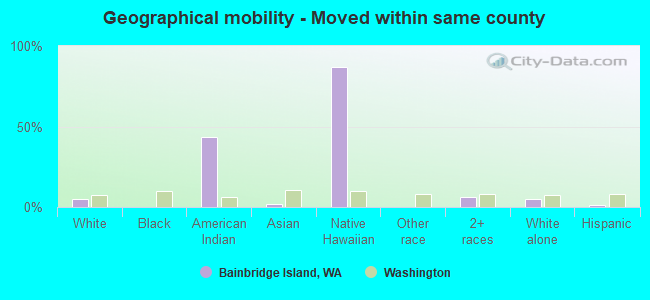
Geographical mobility - Moved within same county (%)
Geographical mobility - Moved within same county (%) - White
Geographical mobility - Moved within same county (%) - Black or African American
Geographical mobility - Moved within same county (%) - Asian
Geographical mobility - Moved within same county (%) - Hispanic or Latino
Geographical mobility - Moved within same county (%) - American Indian and Alaska Native
Geographical mobility - Moved within same county (%) - Multirace
Geographical mobility - Moved within same county (%) - Other Race
Geographical mobility - Moved from different county within same state (%)
Geographical mobility - Moved from different county within same state (%) - White
Geographical mobility - Moved from different county within same state (%) - Black or African American
Geographical mobility - Moved from different county within same state (%) - Asian
Geographical mobility - Moved from different county within same state (%) - Hispanic or Latino
Geographical mobility - Moved from different county within same state (%) - American Indian and Alaska Native
Geographical mobility - Moved from different county within same state (%) - Multirace
Geographical mobility - Moved from different county within same state (%) - Other Race
Geographical mobility - Moved from different state (%)
Geographical mobility - Moved from different state (%) - White
Geographical mobility - Moved from different state (%) - Black or African American
Geographical mobility - Moved from different state (%) - Asian
Geographical mobility - Moved from different state (%) - Hispanic or Latino
Geographical mobility - Moved from different state (%) - American Indian and Alaska Native
Geographical mobility - Moved from different state (%) - Multirace
Geographical mobility - Moved from different state (%) - Other Race
Geographical mobility - Moved from abroad (%)
Geographical mobility - Moved from abroad (%) - White
Geographical mobility - Moved from abroad (%) - Black or African American
Geographical mobility - Moved from abroad (%) - Asian
Geographical mobility - Moved from abroad (%) - Hispanic or Latino
Geographical mobility - Moved from abroad (%) - American Indian and Alaska Native
Geographical mobility - Moved from abroad (%) - Multirace
Geographical mobility - Moved from abroad (%) - Other Race
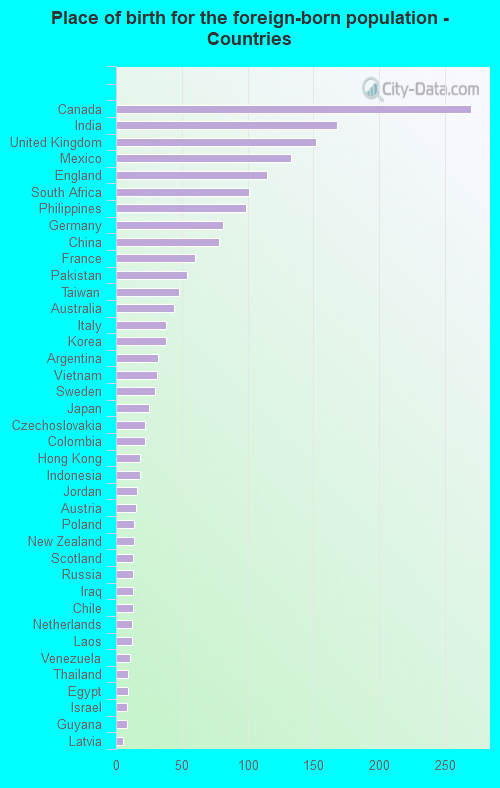
Place of birth for the foreign-born population - Ireland (%)
Place of birth for the foreign-born population - Denmark (%)
Place of birth for the foreign-born population - Norway (%)
Place of birth for the foreign-born population - Sweden (%)
Place of birth for the foreign-born population - United Kingdom (%)
Place of birth for the foreign-born population - England (%)
Place of birth for the foreign-born population - Scotland (%)
Place of birth for the foreign-born population - Other Northern Europe (%)
Place of birth for the foreign-born population - Austria (%)
Place of birth for the foreign-born population - Belgium (%)
Place of birth for the foreign-born population - France (%)
Place of birth for the foreign-born population - Germany (%)
Place of birth for the foreign-born population - Netherlands (%)
Place of birth for the foreign-born population - Switzerland (%)
Place of birth for the foreign-born population - Other Western Europe (%)
Place of birth for the foreign-born population - Greece (%)
Place of birth for the foreign-born population - Italy (%)
Place of birth for the foreign-born population - Portugal (%)
Place of birth for the foreign-born population - Spain (%)
Place of birth for the foreign-born population - Other Southern Europe (%)
Place of birth for the foreign-born population - Albania (%)
Place of birth for the foreign-born population - Belarus (%)
Place of birth for the foreign-born population - Bosnia and Herzegovina (%)
Place of birth for the foreign-born population - Bulgaria (%)
Place of birth for the foreign-born population - Croatia (%)
Place of birth for the foreign-born population - Czechoslovakia (%)
Place of birth for the foreign-born population - Hungary (%)
Place of birth for the foreign-born population - Latvia (%)
Place of birth for the foreign-born population - Lithuania (%)
Place of birth for the foreign-born population - North Macedonia (Macedonia) (%)
Place of birth for the foreign-born population - Moldova (%)
Place of birth for the foreign-born population - Poland (%)
Place of birth for the foreign-born population - Romania (%)
Place of birth for the foreign-born population - Russia (%)
Place of birth for the foreign-born population - Serbia (%)
Place of birth for the foreign-born population - Ukraine (%)
Place of birth for the foreign-born population - Other Eastern Europe (%)
Place of birth for the foreign-born population - China (%)
Place of birth for the foreign-born population - Hong Kong (%)
Place of birth for the foreign-born population - Taiwan (%)
Place of birth for the foreign-born population - Japan (%)
Place of birth for the foreign-born population - Korea (%)
Place of birth for the foreign-born population - Other Eastern Asia (%)
Place of birth for the foreign-born population - Afghanistan (%)
Place of birth for the foreign-born population - Bangladesh (%)
Place of birth for the foreign-born population - India (%)
Place of birth for the foreign-born population - Iran (%)
Place of birth for the foreign-born population - Kazakhstan (%)
Place of birth for the foreign-born population - Nepal (%)
Place of birth for the foreign-born population - Pakistan (%)
Place of birth for the foreign-born population - Sri Lanka (%)
Place of birth for the foreign-born population - Uzbekistan (%)
Place of birth for the foreign-born population - Other South Central Asia (%)
Place of birth for the foreign-born population - Burma (%)
Place of birth for the foreign-born population - Cambodia (%)
Place of birth for the foreign-born population - Indonesia (%)
Place of birth for the foreign-born population - Laos (%)
Place of birth for the foreign-born population - Malaysia (%)
Place of birth for the foreign-born population - Philippines (%)
Place of birth for the foreign-born population - Singapore (%)
Place of birth for the foreign-born population - Thailand (%)
Place of birth for the foreign-born population - Vietnam (%)
Place of birth for the foreign-born population - Other South Eastern Asia (%)
Place of birth for the foreign-born population - Armenia (%)
Place of birth for the foreign-born population - Iraq (%)
Place of birth for the foreign-born population - Israel (%)
Place of birth for the foreign-born population - Jordan (%)
Place of birth for the foreign-born population - Kuwait (%)
Place of birth for the foreign-born population - Lebanon (%)
Place of birth for the foreign-born population - Saudi Arabia (%)
Place of birth for the foreign-born population - Syria (%)
Place of birth for the foreign-born population - Turkey (%)
Place of birth for the foreign-born population - Yemen (%)
Place of birth for the foreign-born population - Other Western Asia (%)
Place of birth for the foreign-born population - Eritrea (%)
Place of birth for the foreign-born population - Ethiopia (%)
Place of birth for the foreign-born population - Kenya (%)
Place of birth for the foreign-born population - Somalia (%)
Place of birth for the foreign-born population - Uganda (%)
Place of birth for the foreign-born population - Zimbabwe (%)
Place of birth for the foreign-born population - Other Eastern Africa (%)
Place of birth for the foreign-born population - Cameroon (%)
Place of birth for the foreign-born population - Congo (%)
Place of birth for the foreign-born population - Democratic Republic of Congo (Zaire) (%)
Place of birth for the foreign-born population - Other Middle Africa (%)
Place of birth for the foreign-born population - Egypt (%)
Place of birth for the foreign-born population - Morocco (%)
Place of birth for the foreign-born population - Sudan (%)
Place of birth for the foreign-born population - Other Northern Africa (%)
Place of birth for the foreign-born population - South Africa (%)
Place of birth for the foreign-born population - Other Southern Africa (%)
Place of birth for the foreign-born population - Cabo Verde (%)
Place of birth for the foreign-born population - Ghana (%)
Place of birth for the foreign-born population - Liberia (%)
Place of birth for the foreign-born population - Nigeria (%)
Place of birth for the foreign-born population - Senegal (%)
Place of birth for the foreign-born population - Sierra Leone (%)
Place of birth for the foreign-born population - Other Western Africa (%)
Place of birth for the foreign-born population - Australia (%)
Place of birth for the foreign-born population - New Zealand (%)
Place of birth for the foreign-born population - Fiji (%)
Place of birth for the foreign-born population - Micronesia (%)
Place of birth for the foreign-born population - Bahamas (%)
Place of birth for the foreign-born population - Barbados (%)
Place of birth for the foreign-born population - Cuba (%)
Place of birth for the foreign-born population - Dominica (%)
Place of birth for the foreign-born population - Dominican Republic (%)
Place of birth for the foreign-born population - Grenada (%)
Place of birth for the foreign-born population - Haiti (%)
Place of birth for the foreign-born population - Jamaica (%)
Place of birth for the foreign-born population - St. Vincent and the Grenadines (%)
Place of birth for the foreign-born population - Trinidad and Tobago (%)
Place of birth for the foreign-born population - West Indies (%)
Place of birth for the foreign-born population - Other Caribbean (%)
Place of birth for the foreign-born population - Belize (%)
Place of birth for the foreign-born population - Costa Rica (%)
Place of birth for the foreign-born population - El Salvador (%)
Place of birth for the foreign-born population - Guatemala (%)
Place of birth for the foreign-born population - Honduras (%)
Place of birth for the foreign-born population - Mexico (%)
Place of birth for the foreign-born population - Nicaragua (%)
Place of birth for the foreign-born population - Panama (%)
Place of birth for the foreign-born population - Other Central America (%)
Place of birth for the foreign-born population - Argentina (%)
Place of birth for the foreign-born population - Bolivia (%)
Place of birth for the foreign-born population - Brazil (%)
Place of birth for the foreign-born population - Chile (%)
Place of birth for the foreign-born population - Colombia (%)
Place of birth for the foreign-born population - Ecuador (%)
Place of birth for the foreign-born population - Guyana (%)
Place of birth for the foreign-born population - Peru (%)
Place of birth for the foreign-born population - Uruguay (%)
Place of birth for the foreign-born population - Venezuela (%)
Place of birth for the foreign-born population - Other South America (%)
Place of birth for the foreign-born population - Canada (%)
Place of birth for the foreign-born population - Other Northern America (%)
Place of birth for the foreign-born population - Other (%)
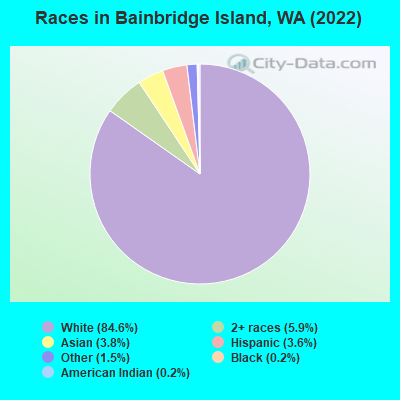
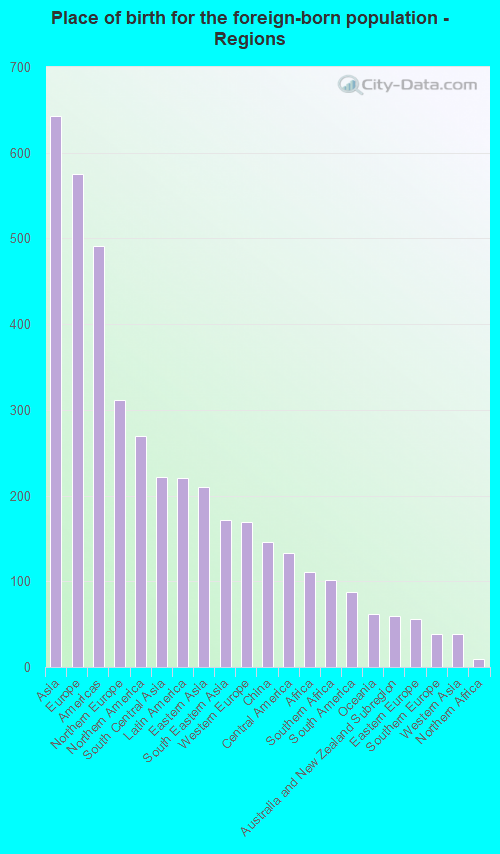
According to 2022 data, the most numerous races in Bainbridge Island, WA are White alone (21,043 residents), Hispanic (893 residents), and Asian alone (951 residents). 93.5% of Bainbridge Island residents speak English at home. 7.6% of Bainbridge Island, WA residents are foreign-born (2.5% born in Asia, 2.2% born in Europe, 1.1% born in North America, 0.9% born in Latin America), which is 98.1% less than the foreign-born rate of 15.0% across the entire state of Washington.
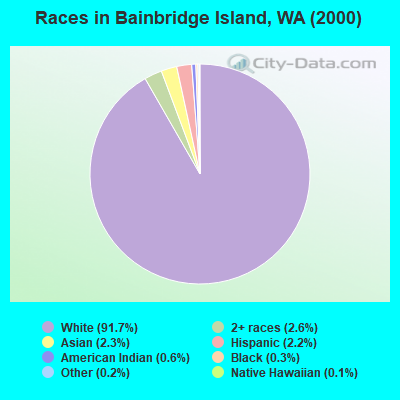
Race distribution in Bainbridge Island
2000 2022
4,652,490 78.9% White alone 441,509 7.5% Hispanic 319,401 5.4% Asian alone 184,631 3.1% Black alone 175,926 3.0% Two or more races 85,396 1.4% American Indian alone 22,779 0.4% Native Hawaiian and Other 11,989 0.2% Other race alone
4,941,456 63.5% White alone 1,093,313 14.0% Hispanic 755,832 9.7% Asian alone 523,448 6.7% Two or more races 299,537 3.8% Black alone 69,024 0.9% American Indian alone 52,231 0.7% Native Hawaiian and Other 50,945 0.7% Other race alone
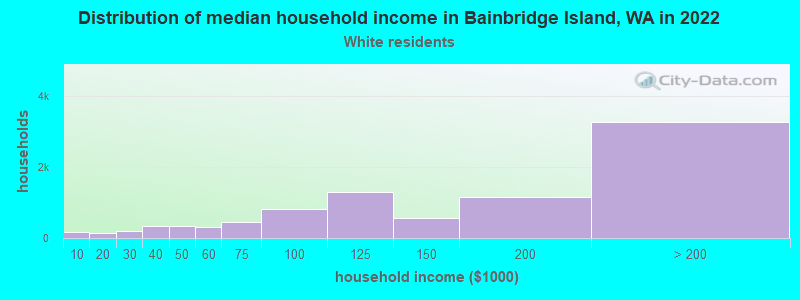
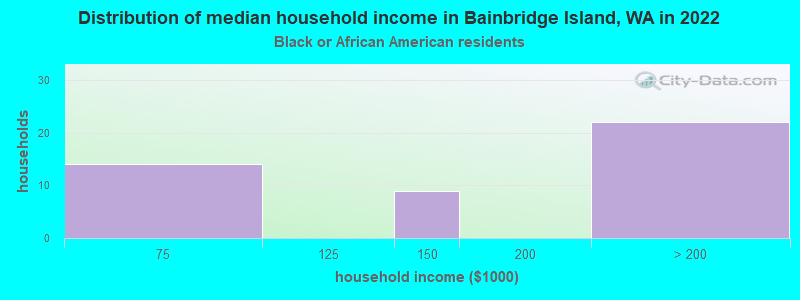
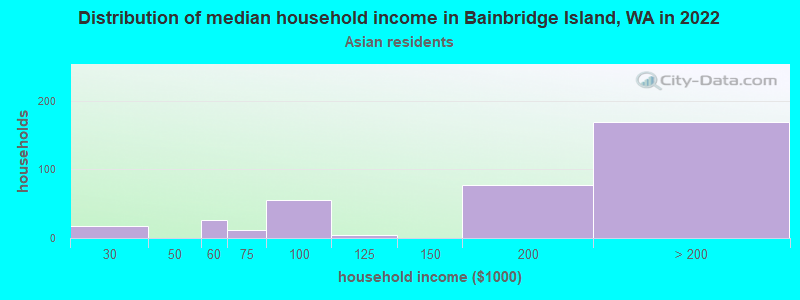
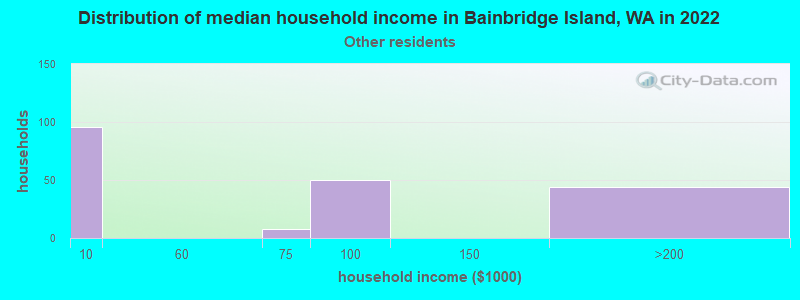
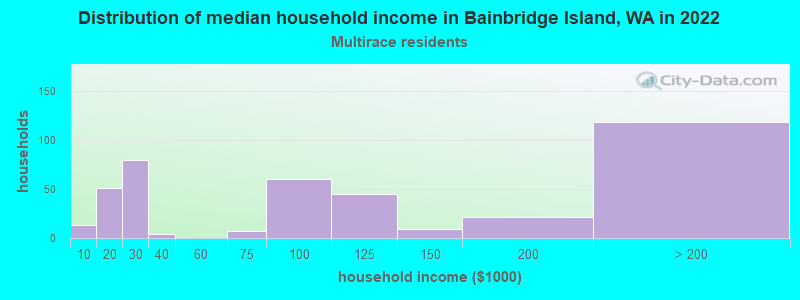
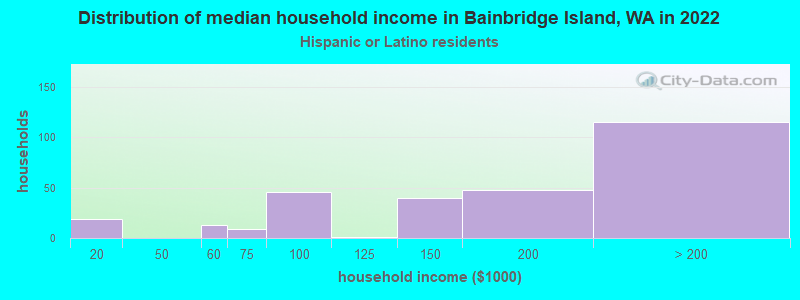
Income and house value in Bainbridge Island Median household income in 2022 $153,085 White non-Hispanic householdersover $200,000 Asian householders$175,210 Hispanic or Latino race householdersMedian 2022 house value over $1,000,000 White Non-Hispanic householders$924,091 Black or African American householders$824,929 American Indian or Alaska Native householders over $1,000,000 Asian householders$302,106 Native Hawaiian and other Pacific Islander householdersover $1,000,000 Some other race householdersover $1,000,000 Two or more races householders$736,074 Hispanic or Latino householders
Median age by race in Bainbridge Island
52.4 Median age for White residents51.9 53.6 71.8 Median age for Black or African American residents-873,638,343.4 38.7 59.4 Median age for American Indian / Alaska Native residents-820,346,319.5 64.8 45.7 Median age for Asian residents38.3 48.4 -608,782,434.5 Median age for Native Hawaiian / Pacific Islander residents-639,639,639.0 -686,716,791.3 33.0 Median age for Other race residents16.2 34.8 20.8 Median age for Two or more races residents29.6 22.0 53.3 Median age for White alone residents52.5 54.0 38.4 Median age for Hispanic or Latino residents34.3 39.6
Owner/renter occupied households by race in Bainbridge Island
House owners and renters - White residents 7,306 81.2% Owner occupied1,688 18.8% Renter occupiedHouse owners and renters - Black or African American residents 35 85.5% Owner occupied6 14.5% Renter occupiedHouse owners and renters - American Indian / Alaska Native residents 13 100.0% Renter occupiedHouse owners and renters - Asian residents 368 95.3% Owner occupied18 4.7% Renter occupiedHouse owners and renters - Other race residents 38 17.7% Owner occupied179 82.3% Renter occupiedHouse owners and renters - Two or more races residents 422 90.6% Owner occupied44 9.4% Renter occupiedHouse owners and renters - White alone residents 7,194 81.1% Owner occupied1,673 18.9% Renter occupiedHouse owners and renters - Hispanic or Latino residents 222 77.6% Owner occupied64 22.4% Renter occupied
Language usage in Bainbridge Island
English speakers - Total 93.5% of residents of Bainbridge Island speak English at home.
1.5% of residents speak Spanish at home 301 85.8% Speak English very well50 14.2% Speak English less than very well4.4% of residents speak other language at home 964 91.7% Speak English very well87 8.3% Speak English less than very well
English speakers - Born in the United States 96.4% of residents of Bainbridge Island speak English at home.
1.0% of residents speak Spanish at home 109 82.6% Speak English very well23 17.4% Speak English less than very well2.2% of residents speak other language at home 299 97.1% Speak English very well9 2.9% Speak English less than very well
English speakers - Native, born elsewhere 93.9% of residents of Bainbridge Island speak English at home.
9.8% of residents speak other language at home 30 88.2% Speak English very well4 11.8% Speak English less than very well
English speakers - Foreign-born 56.7% of residents of Bainbridge Island speak English at home.
5.0% of residents speak Spanish at home 100 100.0% Speak English very well28.0% of residents speak other language at home 515 91.3% Speak English very well49 8.7% Speak English less than very well
White (Caucasian) - Speak only English Native:
97.5% (19,114)Foreign-born:
59.2% (566)
White (Caucasian) - Speak another language Native:
2.6% (501)Foreign-born:
36.9% (353)
Asian - Speak only English Native:
100.0% (422)Foreign-born:
61.4% (311)
Asian - Speak another language Native:
4.6% (19)Foreign-born:
41.1% (208)
Other race - Speak only English Native:
67.0% (220)Foreign-born:
36.7% (57)
Other race - Speak another language Native:
32.5% (107)Foreign-born:
60.9% (95)
Two or more races - Speak only English Native:
95.0% (1,317)Foreign-born:
71.7% (248)
Two or more races - Speak another language Native:
5.3% (73)Foreign-born:
15.9% (55)
White alone - Speak only English Native:
97.9% (18,966)Foreign-born:
54.5% (528)
White alone - Speak another language Native:
2.1% (403)Foreign-born:
41.0% (398)
Hispanic or Latino - Speak only English Native:
76.2% (434)Foreign-born:
25.4% (68)
Hispanic or Latino - Speak another language Native:
23.7% (135)Foreign-born:
64.7% (175)
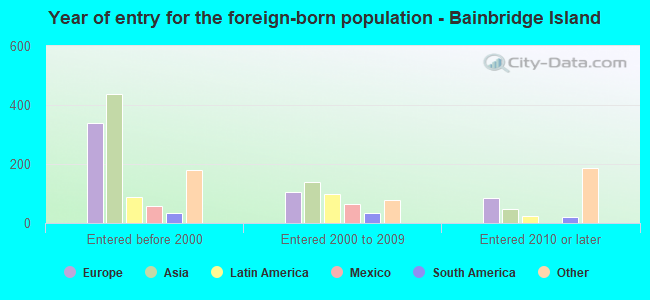
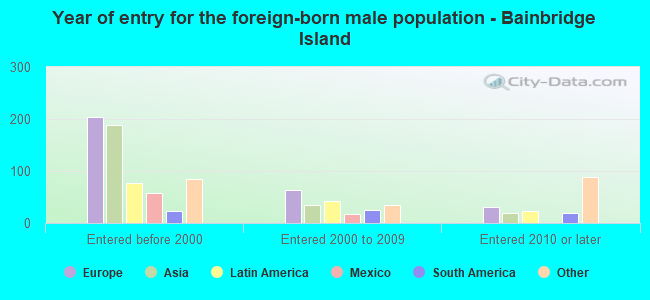
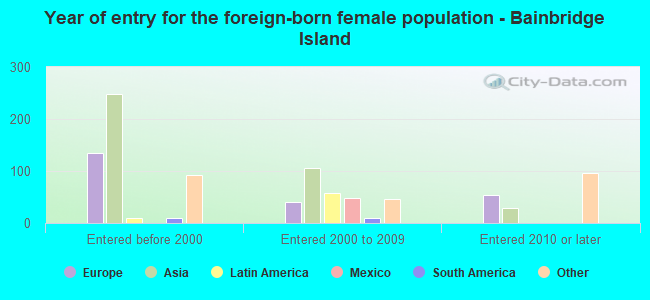
Foreign-born residents in Bainbridge Island 1,884 residents are foreign born (2.5% Asia , 2.2% Europe , 1.1% North America , 0.9% Latin America ).
This city:
7.6%Washington:
14.9%
Marital status for residents in Bainbridge Island Marital status - White (Caucasian) population 15 years and over
Males 21.5% Never married68.7% Now married1.0% Separated1.8% Widowed6.9% DivorcedFemales 17.0% Never married64.1% Now married0.9% Separated6.0% Widowed12.0% DivorcedWomen who gave birth in the past 12 months Now married:
80.6% (196)Unmarried:
19.4% (47)
Women who did not give birth in the past 12 months Now married:
48.1% (1,657)Unmarried:
51.9% (1,791)
Marital status - Black or African American population 15 years and over
Males 10.5% Never married0.0% Now married0.0% Separated0.0% Widowed89.5% DivorcedFemales 53.8% Never married46.2% Now married0.0% Separated0.0% Widowed0.0% DivorcedWomen who did not give birth in the past 12 months Now married:
0.0% (0)Unmarried:
100.0% (21)
Marital status - American Indian / Alaska Native population 15 years and over
Males 0.0% Never married100.0% Now married0.0% Separated0.0% Widowed0.0% DivorcedFemales 25.0% Never married40.6% Now married0.0% Separated0.0% Widowed34.4% DivorcedMarital status - Asian population 15 years and over
Males 5.5% Never married91.2% Now married0.0% Separated0.0% Widowed3.3% DivorcedFemales 13.2% Never married72.2% Now married5.8% Separated8.8% Widowed0.0% DivorcedWomen who gave birth in the past 12 months Now married:
100.0% (4)Unmarried:
0.0% (0)
Women who did not give birth in the past 12 months Now married:
79.6% (141)Unmarried:
20.4% (36)
Marital status - Other race population 15 years and over
Males 32.9% Never married67.1% Now married0.0% Separated0.0% Widowed0.0% DivorcedFemales 32.8% Never married34.5% Now married10.0% Separated0.0% Widowed22.7% DivorcedWomen who did not give birth in the past 12 months Now married:
41.9% (63)Unmarried:
58.1% (88)
Marital status - Two or more races population 15 years and over
Males 29.1% Never married54.4% Now married0.0% Separated0.0% Widowed16.5% DivorcedFemales 41.5% Never married43.8% Now married0.0% Separated2.7% Widowed12.0% DivorcedWomen who gave birth in the past 12 months Now married:
100.0% (38)Unmarried:
0.0% (0)
Women who did not give birth in the past 12 months Now married:
36.5% (167)Unmarried:
63.5% (291)
Marital status - White alone, not Hispanic / Latino population 15 years and over
Males 21.1% Never married69.2% Now married1.0% Separated1.9% Widowed6.8% DivorcedFemales 17.2% Never married63.7% Now married0.9% Separated6.1% Widowed12.2% DivorcedWomen who gave birth in the past 12 months Now married:
80.6% (197)Unmarried:
19.4% (47)
Women who did not give birth in the past 12 months Now married:
47.3% (1,587)Unmarried:
52.7% (1,769)
Marital status - Hispanic or Latino population 15 years and over
Males 37.3% Never married47.6% Now married0.0% Separated0.0% Widowed15.1% DivorcedFemales 20.3% Never married68.8% Now married6.1% Separated2.4% Widowed2.4% DivorcedWomen who did not give birth in the past 12 months Now married:
61.0% (137)Unmarried:
39.0% (88)
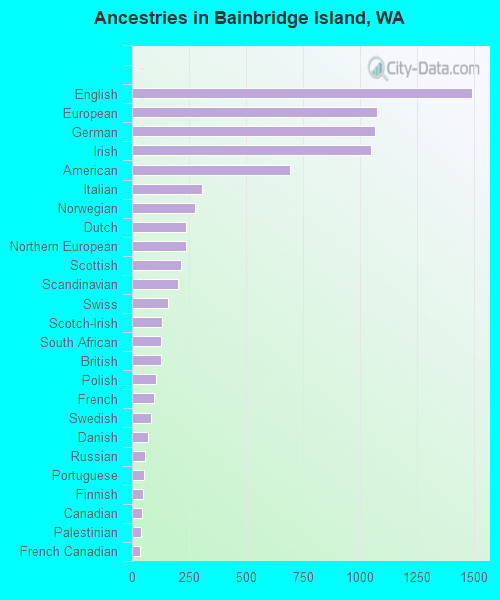
Ancestries in Bainbridge Island
1,492 14.8% English1,076 10.7% European1,066 10.6% German1,050 10.4% Irish695 6.9% American306 3.0% Italian277 2.7% Norwegian238 2.4% Dutch236 2.3% Northern European216 2.1% Scottish202 2.0% Scandinavian158 1.6% Swiss133 1.3% Scotch-Irish129 1.3% South African127 1.3% British107 1.1% Polish96 1.0% French84 0.8% Swedish72 0.7% Danish56 0.6% Russian54 0.5% Portuguese48 0.5% Finnish43 0.4% Canadian39 0.4% Palestinian37 0.4% French Canadian32 0.3% Eastern European29 0.3% Austrian20 0.2% Croatian17 0.2% German Russian17 0.2% Celtic17 0.2% Belgian15 0.1% Lithuanian15 0.1% Israeli14 0.1% Ukrainian10 0.10% Welsh9 0.09% Arab7 0.07% Guyanese7 0.07% Slovene6 0.06% Latvian1 0.01% African
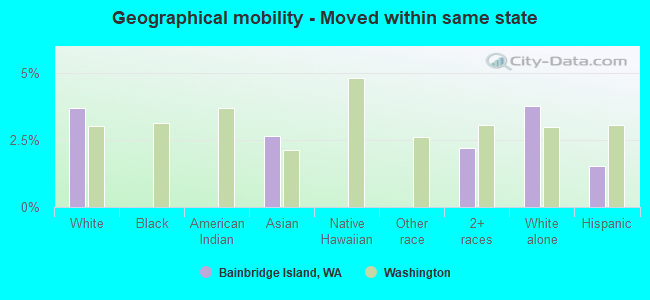
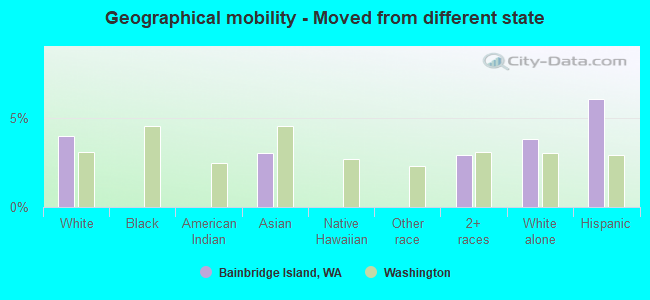
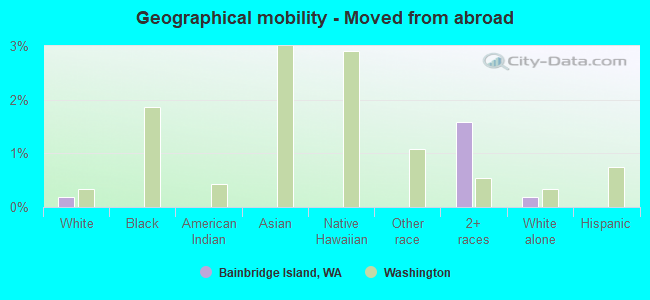
Geographical mobility in Bainbridge Island Same house 1 year ago 18,042 85.3% White (Caucasian)61 100.0% Black or African American27 71.7% American Indian / Alaska Native880 93.6% Asian475 100.0% Other race1,539 85.5% Two or more races17,829 85.3% White alone, not Hispanic / Latino790 92.3% Hispanic or LatinoMoved within same county 1,062 5.0% White / Caucasian17 43.7% American Indian / Alaska Native18 2.0% Asian3 87.0% Native Hawaiian / Pacific Islander112 6.2% Two or more races1,078 5.2% White alone, not Hispanic / Latino13 1.5% Hispanic or LatinoMoved within same state 785 3.7% White / Caucasian25 2.7% Asian39 2.2% Two or more races788 3.8% White alone, not Hispanic / Latino13 1.5% Hispanic or LatinoMoved from different state 834 3.9% White / Caucasian28 3.0% Asian52 2.9% Two or more races796 3.8% White alone, not Hispanic / Latino52 6.0% Hispanic or LatinoMoved from abroad 40 0.2% White29 1.6% Two or more races40 0.2% White alone, not Hispanic / Latino
Children Nativity (place of birth) in Bainbridge Island
Children under 6 years - Living with two parents Both parents native 811 100.0% NativeBoth parents foreign-born 40 100.0% NativeOne native, one foreign-born parent 106 100.0% NativeChildren under 6 years - Living with one parent Native parent 292 100.0% NativeChildren 6 to 17 years - Living with two parents Both parents native 2,362 99.1% Native22 0.9% Foreign-bornBoth parents foreign-born 177 77.9% Native50 22.1% Foreign-bornOne native, one foreign-born parent 302 100.0% NativeChildren 6 to 17 years - Living with one parent Native parent 632 100.0% NativeForeign-born parent 125 54.3% Native105 45.7% Foreign-born
Grandparents responsible for own grandchildren in Bainbridge Island
Grandparents (30 to 59 years) White / Caucasian 7 100.0% Responsible for grandchildrenWhite alone, not Hispanic / Latino 7 100.0% Responsible for grandchildrenGrandparents (60 years and over) White / Caucasian 36 19.7% Responsible for grandchildren145 80.3% Not responsible for grandchildrenWhite alone, not Hispanic / Latino 36 20.2% Responsible for grandchildren141 79.8% Not responsible for grandchildren